Introduction
Alloys with a miscibility gap in the liquid state are significant materials for a diversity of applications [Reference Inoue, Yano, Matsuzaki and Masumoto1, Reference Kaban, Köhler, Ratke, Hoyer, Mattern, Eckert and Greer2, Reference Ratke and Diefenbach3], such as welding materials, self-lubricating materials, and electrical contact materials. Al-based monotectic alloys are potential materials for the development of advanced self-lubricant bearings and solders [Reference Inoue, Yano, Matsuzaki and Masumoto1, Reference Dai, Zhang, Zhang and Li4]. Immiscible alloys, containing a stable or metastable miscibility gap in the liquid state, undergo a liquid–liquid phase separation during the solidification process, i.e., a homogeneous liquid decomposes into two immiscible liquids [Reference Ratke and Diefenbach3]. Under normal circumstances, since the two immiscible liquids have different enrichments relative to the components, there is a large difference in density between them. Hence, immiscible alloys tend to form severe gravity segregation and even component stratification under conventional solidification condition, resulting in the loss of application value. Therefore, if the minority phase is dispersed in the matrix by appropriate methods, the special physical and mechanical properties they exhibit will have broad application prospects. Thus, it is important to obtain a uniform structure of immiscible alloys.
Al–Bi–Sn monotectic alloys are characterized by microstructures formed by immiscible phases with the minority phase dispersed throughout the Al matrix. The dispersed minority phase can provide appropriate tribological characteristics acting as a solid lubricant, while the matrix provides required structural integrity [Reference Costa, Freitas, Dias, Brito, Cheung and Garcia5]. To effectively control the distribution of the minority phase of Al–Bi–Sn alloy, the solidification mechanism of immiscible alloys must be understood. However, little literature has discussed the solidification mechanism. In recent years, experimental studies on factors influencing the structure of solidification have been conducted, including composition [Reference Kotadia, Das, Doernberg and Schmid-Fetzer6, Reference Dai, Zhang, Guo and Li7], temperature gradient [Reference Lu, Zhang and Li8], the cooling rate [Reference Dai, Zhang, Li, Guo and Li9], and the degree of undercooling [Reference Ning10]. As for Al–Bi–Sn immiscible alloys, the minority phase with higher density tends to move downward under gravity conditions. What’ more, the thermal Marangoni motion rate of the minority phase will be affected by the temperature gradient. Cooling rate is an important factor affecting the minority phase distribution, which determines directly the minority phase droplets growth, roughening, moving, and the duration separated from the matrix phase [Reference Wu, Li, Jia, Liu, Cui and Geng11]. Therefore, under different cooling conditions, the morphology and distribution of minority phase droplets are different and then can be controlled. However, few studies were researched about the effect of cooling rate on the morphology of the minority phase.
In this paper, a ternary immiscible alloy with the composition of Al70Bi10Sn20 (at.%) was prepared, where the alloy composition was designed to fall into the stable miscibility gap in the liquid state. What’s more, temperature range of stable miscibility gap of this composition is about 200 °C, which is benefit to study the process of liquid phase separation. Three different cooling conditions were conducted to investigate the structural evolution. By this means, the formation and evolution of the microstructure of this component melt under different solidification conditions were studied. The corresponding solidification mechanism was further discussed and uncovered.
Results
Morphology and microstructure of Al–Bi–Sn alloy under conventional solidification condition
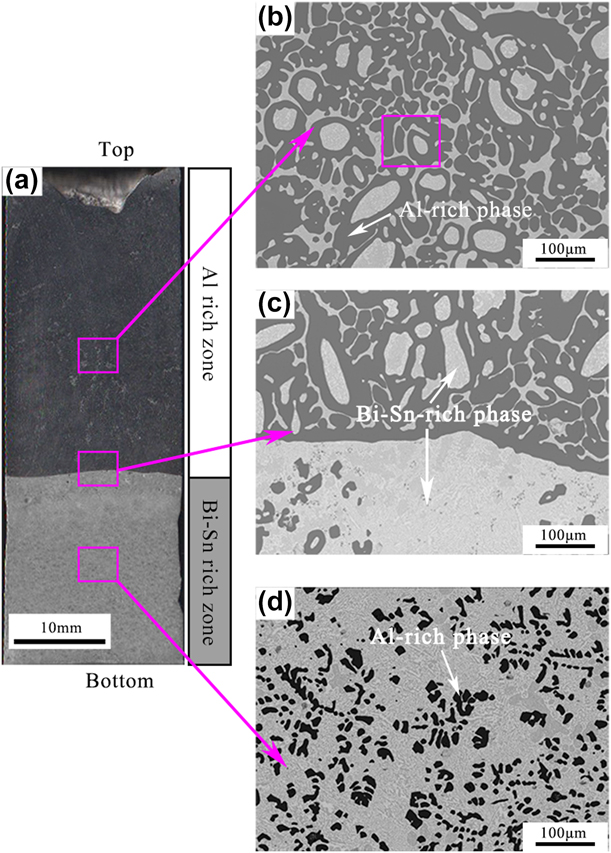
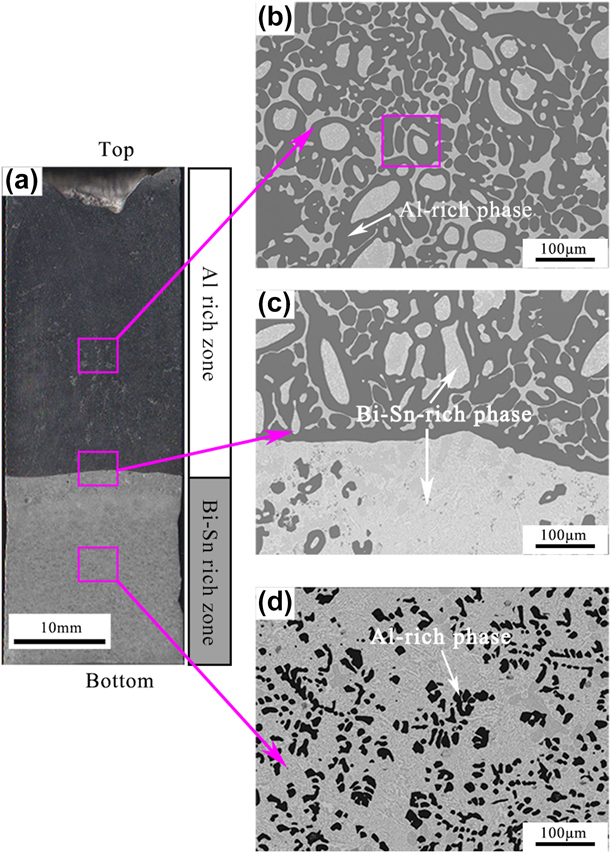
Figure 1(a) shows the macroscopic solidification structure of the Al70Bi10Sn20 ingot cast into graphite mold. A serious spatial phase separation appears, i.e., the upper is the Al-rich region with a lower density and the bottom is the Bi–Sn-rich region. In addition, a clear boundary can be observed between the Al-rich and Bi–Sn-rich regions, as shown in Fig. 1(c). A portion of the Bi–Sn-rich phase distributes in the upper Al-rich region [Fig. 1(b)], and a considerable amount of Al-rich phase distributes in the lower Bi–Sn-rich region [Fig. 1(d)].
(a) Total longitudinal section view of Al70Bi10Sn20 alloy cast into a graphite mold at 1000 °C. (b)–(d) Enlarged backscattered electron images of the corresponding rectangle region in (a).
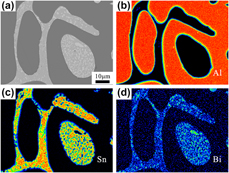
Generally, there are mainly two different morphology types of Bi–Sn-rich phase in the Al-rich region, i.e., a spherical type within the α-Al grain and continuous net structure distributed in the α-Al interdendrites (Fig. 2). It can be ascertained that the Bi–Sn-rich spherical or ellipsoidal droplets in the Al-rich region are the product of the liquid–liquid phase separation. Accompanied by the solidification of α-Al phase with the high liquidus temperature, the Bi–Sn-rich droplets are frozen in the Al matrix during the solidification process. Under the action of interfacial tension, the Bi–Sn-rich droplets maintain a spherical morphology. Another Bi–Sn-rich phase distributes in the α-Al interdendrites, forming a continuous net structure, which is the product of monotectic reaction [Reference Wu, Li, Jia, Liu, Cui and Geng11].
(a) Backscattered electron image of the enlarged rectangle region in Fig. 1(b). (b)–(d) Map scanning of (a) by electron probe micro-analyzer.
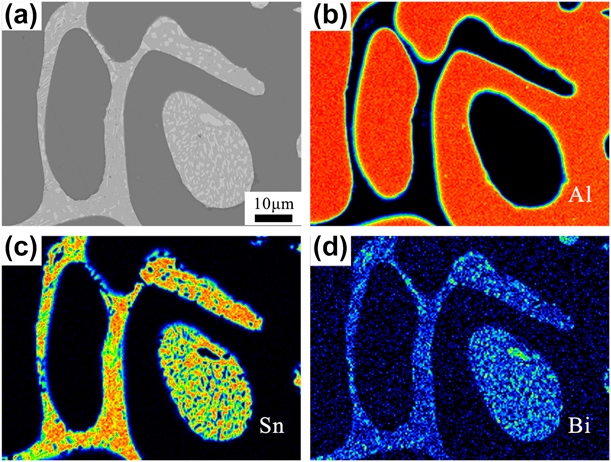
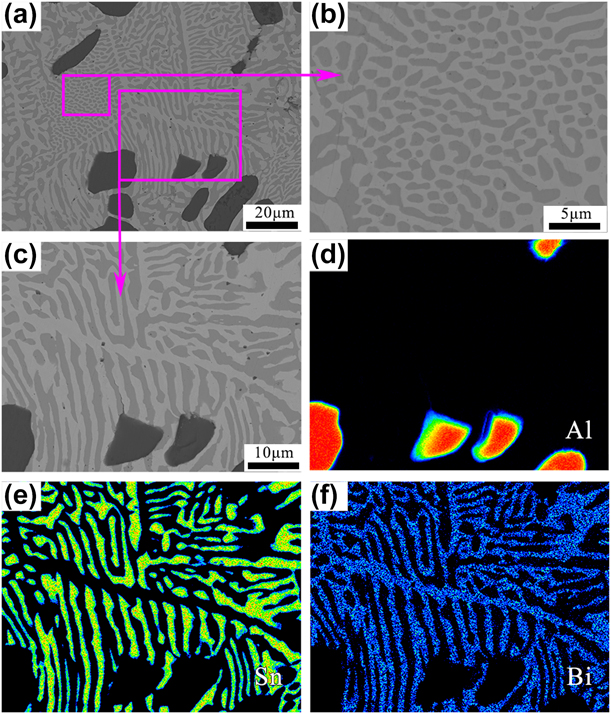
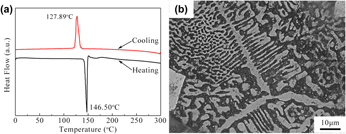
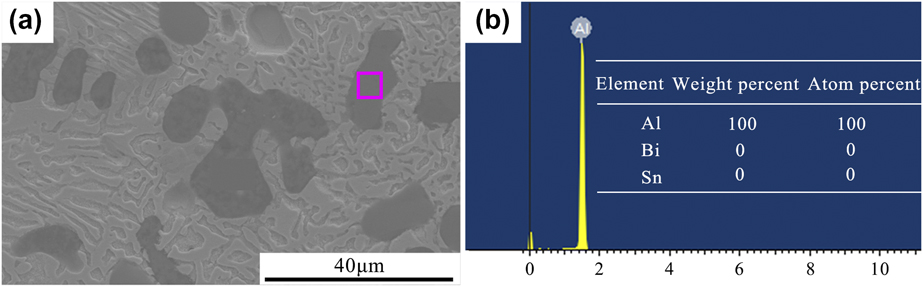
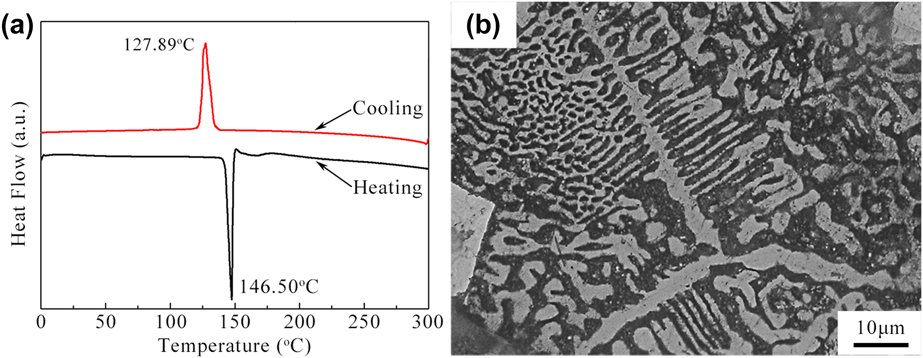
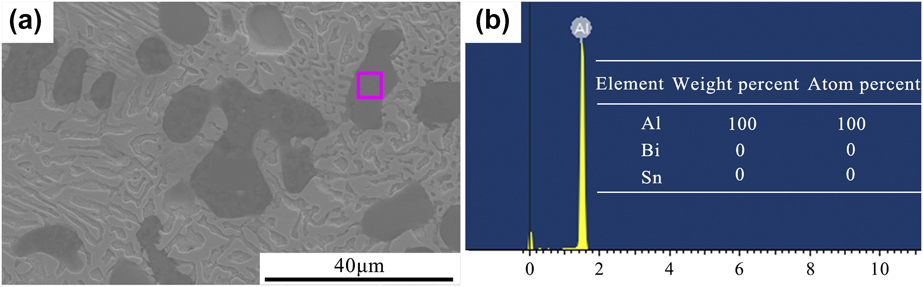
Figure 3(a) is the further enlarged structure of the Bi–Sn-rich region in the lower layer of the sample. It can be observed that the lamellar structure is distributed as a matrix in the Bi–Sn-rich region, which was also found in the previous study [Reference Li, Zhang, Chen and Geng12]. Nevertheless, the corresponding formation reason has rarely been reported. The map scanning result shows that the lamellar structure consists of Bi and Sn [Figs. 3(d)–3(f)]. To identify the formation of the lamellar structure, differential scanning calorimeter (DSC) test was carried out. Figure 4(a) shows the DSC result of the sample taken from the Bi–Sn-rich region of the Al70Bi10Sn20 alloy ingot solidified in the graphite mold. During heating and cooling process, the endothermic (146.50 °C) and exothermic (127.89 °C) peaks can be clearly observed, which is approximately close to the Bi–Sn eutectic reaction temperature (140.69 °C) [Reference Silva, Reinhart, Nguyen-Thi, Mangelinck-Noël, Garcia and Spinelli13, Reference Li, Geng, Fang, Min, Liu and Lu14]. However, two distinct types of Bi–Sn lamellar structures [Fig. 3(a)] are observed in the Bi–Sn-rich region, namely, the discontinuous lamellar structure [Fig. 3(b)] and the regular lamellar pattern like the shape of “fishbone” [Fig. 3(c)]. To further ascertain whether the lamellar structure is the production of eutectic structure or discontinuous precipitation, the as-taken Bi–Sn-rich sample was solution treated at 130 °C, which is below the eutectic temperature for 5 h. Interestingly, the lamellar structure barely changes as shown in Fig. 4(b), which further demonstrates that it is the production of eutectic reaction. In addition, it can be observed from the energy-dispersive spectroscopy (EDS) pattern of the rectangle region in Fig. 5 that Bi and Sn solutes do not exist in the primary α-Al phase, demonstrating that both Bi and Sn elements have negligible solid solubility in the Al-rich matrix.
(a) Backscattered electron (BSE) image of Bi–Sn-rich region of the Al70Bi10Sn20 alloy cast into a graphite mold. (b) and (c) Enlarged BSE images of the corresponding rectangle region in (a). (d)–(f) Map scanning of (c) by electron probe micro-analyzer.

(a) DSC curves of Bi–Sn-rich region of the Al70Bi10Sn20 alloy cast into a graphite mold. (b) Backscattered electron image of Bi–Sn-rich region after solution treatment at 130 °C for 5 h.
(a) Scanning electron microscopic image of the Bi–Sn-rich region. (b) EDS result of the rectangle region in (a).
Solidification microstructure evolution of Al–Bi–Sn alloy at different cooling rates
Based on the above experimental results, it is found that the gravity segregation leads to serious phase separation at a low cooling rate. To further study the solidification mechanism of the immiscible alloy, the rapid cooling in copper mold and water quenching experiments were carried out.
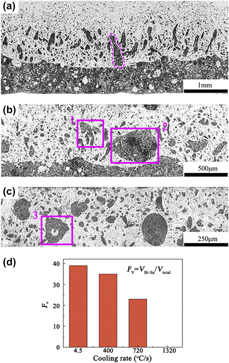
Figure 6 shows the microstructures of Al70Bi10Sn20 alloy solidified in the copper mold. It can be seen that the samples at different cooling rates present various morphology. Figure 6(a) presents the solidification microstructure solidified at a cooling rate of about 400 °C/s. A significant gravity segregation takes place. Macroscopically, the sample exhibits a distinct layered microstructure, in which the upper and bottom regions are Al-rich and Bi–Sn-rich structures, respectively. Meanwhile, just above the interface of the two regions, there are many tadpole-like Bi–Sn-rich droplets, which are elongated along the vertical direction. It is generally accepted that the nucleation of the minority phase during liquid–liquid separation process can be considered as uniform nucleation [Reference Ratke and Diefenbach3]. Thus, the nucleation rate in each position should be approximately spatially identical. The newly generated Bi–Sn-rich droplets near the bottom can easily coagulate and settle down under the driving of gravity, which ultimately results in the settled Bi–Sn-rich region. For other generated Bi–Sn-rich droplets away from the bottom of mold, they have no enough time to sink to the bottom, instead they are trapped in the middle of alloy eventually. In addition, these Bi–Sn-rich droplets tend to collide and coalesce during solidification process [Reference Liu, Jie, Dong, Guo, Wang and Li15]; meanwhile, they migrate downward due to the influence of gravity [Reference Liu, Jie, Dong, Guo, Wang and Li15, Reference Shi, Wang, Wang and Liu16]. Thus, the Bi–Sn-rich droplets elongated in the vertical direction indicate the trend of downward movement. It is worth noting that two ellipsoidal Bi–Sn-rich droplets in the dashed box in Fig. 6(a) are frozen in the process of coalescing and eventually solidify in morphology of the tadpole.
(a)–(c) Microstructure of Al70Bi10Sn20 alloys poured into the copper mold at different cooling rates: (a) 400 °C/s, (b) 720 °C/s, and (c) 1320 °C/s. (d) The volume fractions of the Bi–Sn-rich region (F V) of the alloy with different cooling rates.
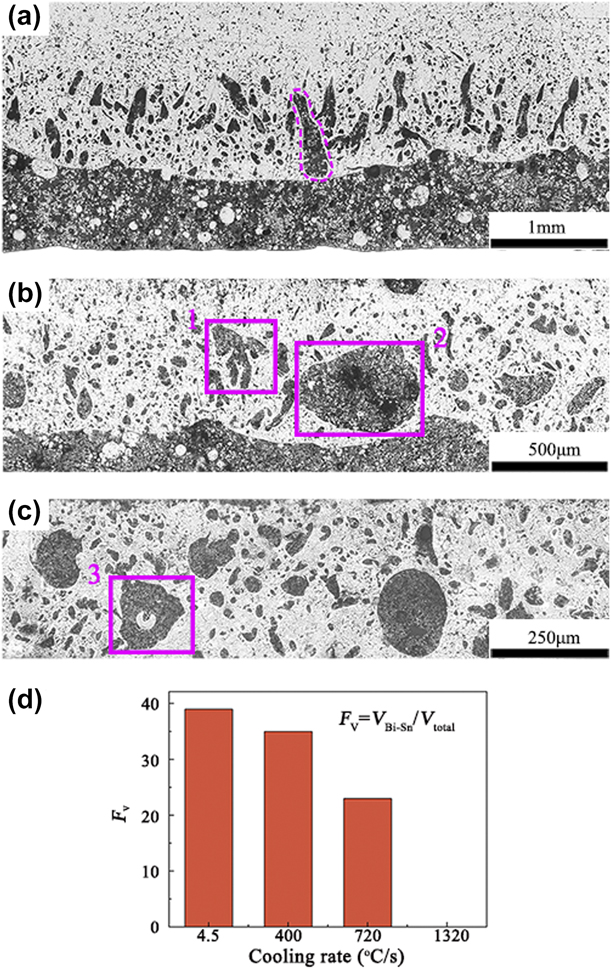
For the solidification microstructure of Al70Bi10Sn20 solidified at a cooling rate of about 720 °C/s, it can be seen in Fig. 6(b) that a large part of the Bi–Sn-rich phase still concentrates at the bottom, similar to that observed in Fig. 6(a). Meanwhile, another part of the Bi–Sn-rich phase is observed to solidify in the middle. It should be noted that several Bi–Sn-rich droplets with different sizes are merging together, while they do not complete the coalescence due to the large cooling rate [as can be seen in the rectangle 1 in Fig. 6(b)]. In addition, a large Bi–Sn-rich droplet is frozen in the Al-rich region [as highlighted by the rectangle 2 in Fig. 6(b)]. As the cooling rate further increases to about 1320 °C/s, a typical layered structure is not formed in the sample, instead several large Bi–Sn-rich droplets are distributed in the matrix [see Fig. 6(c)]. Interestingly, a special structure is formed that the Bi–Sn-rich phase encases the Al-rich phase, because the Bi–Sn-rich droplet envelops the Al-rich droplet during the growth and coagulation process [as highlighted by the rectangle 3 in Fig. 6(c)].
To determine the degree of spatial phase separation, the volume fraction of the bottom segregated Bi–Sn-rich region (F V) is estimated. F V is defined as follows:
 $${F_{\rm{V}}} = {{{V_{{\rm{Bi}} - {\rm{Sn}}}}} / {{V_{{\rm{total}}}}\quad ,}}$$
where V Bi–Sn denotes the volume of the bottom Bi–Sn-rich region and V total stands for the total volume of the alloy sample. Figure 6(d) plots the degree of spatial phase separation versus cooling rate. F V of the samples with cooling rates of 4.5 °C/s, 400 °C/s, 720 °C/s, and 1320 °C/s are 38.9%, 34.8%, 23.1%, and 0%, respectively. The result shows that the volume fraction of the bulk segregated Bi–Sn-rich region shows a significant decrease with increasing cooling rate. It is concluded that increasing the cooling rate can significantly suppress the spatial phase segregation.
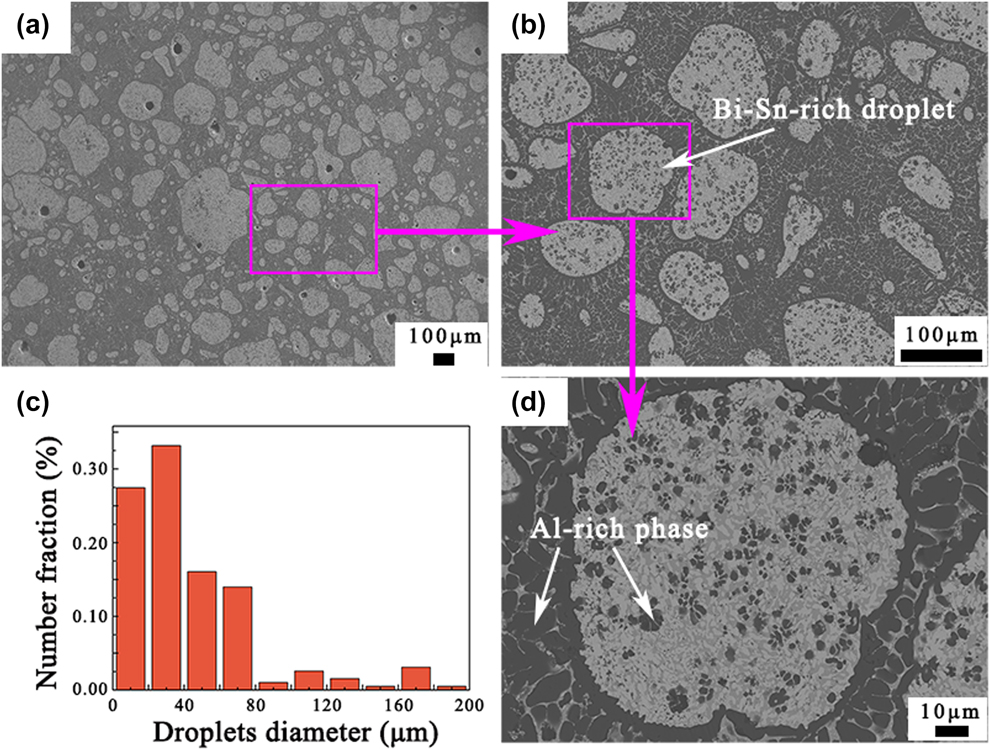
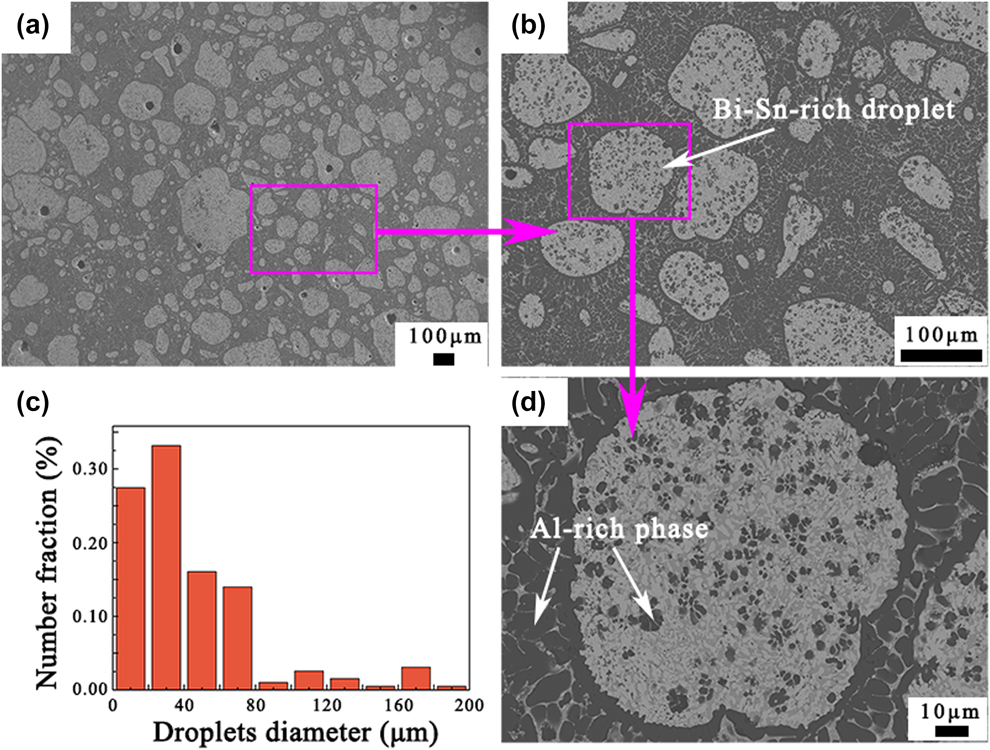
It is seen from Fig. 6 that the microstructure significantly changes with the increase in the cooling rate. Meanwhile, the degree of segregation can be greatly inhibited. Thus, to further investigate the microstructure of Al–Bi–Sn alloy with a high cooling condition, water quenching experiment was carried out. As estimated that the cooling rate is about 2900 °C/s under this condition. The microstructure of the Al70Bi10Sn20 alloy, which is cast into water directly, is presented in Fig. 7. Unlike the above-mentioned samples solidified in the copper mold, the sample does not exhibit spatial phase separation from a macro perspective [see Figs. 7(a) and 7(b)]. Figure 7(c) shows the statistical result of droplet size. Compared with the sample solidified at the cooling rate of 1320 °C/s, the number of Bi–Sn-rich droplets is larger and the size is smaller. At such extremely high cooling rate, the minority phase is dispersed relatively evenly in the matrix. Figure 7(d) shows the presence of some secondary Al grains distributed in the Bi–Sn-rich droplets.
(a) Microstructure of Al70Bi10Sn20 alloy solidified in water. (b) Enlarged image of (a). (c) 2D diameter distribution of the minority phase droplets in the Al70Bi10Sn20 alloy solidified in water. (d) Further enlarged image of (b).
Discussion
According to the previous studies, the solidification process of Al70Bi10Sn20 alloy can be summarized: when the homogeneous melt is undercooled into the miscibility gap, the liquid–liquid separation takes place, i.e., L → L1 (Al-rich) + L2 (Bi–Sn-rich). Then, the minority phase nucleates preferentially in a form of dispersed liquid globules [Reference Dai, Zhang, Zhang and Li4]. Subsequently, the minority phase droplets mainly grow by the multiple mechanisms, such as diffusion-controlled growth, Brownian motion, Marangoni motion, and Stokes sedimentation. When the temperature decreases to T m, the monotectic reaction occurs: L1 → S (Al) + L2, followed by the Bi–Sn eutectic reaction [Reference Lin, Li, Lin, Di and Zhao17].
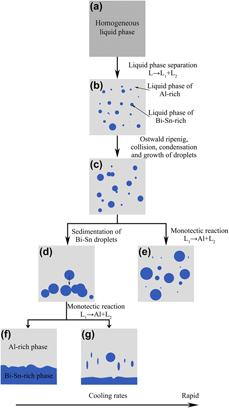
Thus, the schematic illustration of the solidification path of Al70Bi10Sn20 alloy under different cooling conditions is shown in Fig. 8. In the liquid–liquid phase separation process of Al70Bi10Sn20 alloy melt, the minority phase droplets have undergone processes such as nucleation, diffusion-controlled growth Brownian motion, Ostwald ripening, collision, Stokes sedimentation and Marangoni migration [Reference Zhao, Bo, Wang and Li18, Reference Liu, Jie, Zhang, Wang, Wang, Li and Yin19, Reference Jia, Li, Hu, Zhang, Teng, Zhao, Chen, Zuo, Liu and Yang20]. The Marangoni migration and Stokes sedimentation are the main reason for the macrosegregation of the immiscible alloys. The Stokes sedimentation velocity V s and Marangoni migration velocity V m of the minority phase droplets with radius r in the liquid alloy are described in the following equations [Reference Lavernia, Ghanshyam and Grant21, Reference Wang, Liu, Ohnuma, Kainuma and Ishida22]:
 $${V_{\rm{m}}} \approx {{ - 2r} \over {3\left( {2{\eta _1} + 3{\eta _2}} \right)}} \cdot {{\partial \sigma } \over {\partial T}} \cdot {{\partial T} \over {\partial x}}\quad ,$$
 $${V_{\rm{s}}} \approx {2 \over 3}{{\left( {{\rho _2} - {\rho _1}} \right)\left( {{\eta _2} + {\eta _1}} \right)g} \over {{\eta _1}\left( {2{\eta _1} + 3{\eta _2}} \right)}} \cdot {r^2}\quad ,$$
where η1 and η2 are the viscosities of the matrix and minor droplet, respectively; r is the radius of the minor droplet; σ is the interfacial energy; x is the distance; ρ1 and ρ2 are the densities of the matrix and minor droplet, respectively; and g is the gravity coefficient.
Schematic illustration of the solidification process of Al70Bi10Sn20 alloy solidified under different cooling conditions (a–g) correspond to different stages during solidification process.

According to Eqs. (2) and (3), V m is influenced by σ and V s is related to g. So the minority phase droplets will move toward the high-temperature center driven by the Marangoni effect and move downward driven by Stokes motion. Furthermore, V m is proportional to r, whereas V s is proportional to r 2, indicating that V s increases quicker with r than V m. The motion direction of the minority phase droplets is determined by the combined velocity of V m and V s [Reference Wang, Li and Wei23]. Therefore, in the initial period of liquid–liquid phase separation, V m is much larger than V s because of the small size of droplets and the large temperature gradient [Reference Dai, Zhang, Li, Guo and Li9, Reference Jia, Li, Hu, Zhang, Teng, Zhao, Chen, Zuo, Liu and Yang20]. Because the inner region of the as-cast sample has a higher temperature than the surface, the small droplets move toward the inner region by the thermal Marangoni migration, accompanying the growth by collision and coagulation during movement. In addition, gravity-induced Stokes velocity (V s) direction of the Bi–Sn-rich droplets is always downward. With the proceeding of cooling, the temperature gradient decreases and the size of minority droplets increases. The effect of gravity becomes increasingly pronounced accordingly. Obviously, the cooling rate determines the duration in which the alloy melt remains liquid, which is an important factor in determining the impact of gravity.
Different solidification structures are formed under different cooling conditions. When the cooling rate is 4.5 °C/s, the time period of collision and growth of the minority phase droplets is long that lots of large minority phase droplets will be formed during liquid phase separation process [Fig. 8(d)]. Under this condition, the Stokes migration plays a major role, and eventually a serious spatial separation structure is formed [Fig. 8(f)]. When the cooling rate is increased to 400 °C/s, the volume fraction of the bottom-settled Bi–Sn-rich region reduces due to the shorter migration time. A large part of the Bi–Sn-rich phase droplets is deposited to the bottom and another part of the minority phase is frozen in the Al-rich region [Fig. 8(g)]. When the cooling rate reaches 720 °C/s, the bulk separated Bi–Sn-rich phase frozen in the Al-rich region is caused by the coaction between Stokes sedimentation and Marangoni migration. The newly nucleated Bi–Sn-rich droplets near the bottom coagulate and deposit due to the Stokes motion. It is worth mentioning that the degree of spatial phase separation greatly decreases with increasing cooling rate. When the cooling rate reaches from 1320 to 2900 °C/s, spatial separation disappears, instead the minority phase droplets are evenly distributed in the Al-rich matrix to some extent [Fig. 8(e)].
In general, the cooling rate has a significant effect on the microstructure of Al–Bi–Sn alloy. When the alloy melt solidifies at a slower cooling rate, significant spatial phase separation occurs. As the cooling rate increases, the microstructure of the alloy can be tuned and the degree of phase separation is to a great extent suppressed. Therefore, the present research offers a new set into the method to tailor the microstructure of the Al–Bi–Sn immiscible alloy.
Conclusions
In this study, the effect of cooling rate on the microstructure of the Al70Bi10Sn20 alloy, which is located in the immiscible region, was studied by the designed three different cooling conditions. The result shows that cooling rate has a significant effect on the morphology and distribution of the minority phase of Al70Bi10Sn20 alloy. Under conventional solidification conditions, because of the different density between minority phase and matrix, macrosegregation is inevitable, or even forms an obvious stratification. As the cooling rate increases, the degree of spatial phase separation decreases, and more minority phase droplets are frozen in the Al-rich matrix. When the cooling rate reaches 2900 °C/s, the minority phase droplets are evenly distributed in the Al-rich matrix to some extent. Therefore, the formation of the microstructure of the Al70Bi10Sn20 ternary immiscible alloy can be controlled by adjusting the solidification condition.
Experimental procedure
Preparation of the Al70Bi10Sn20 alloy
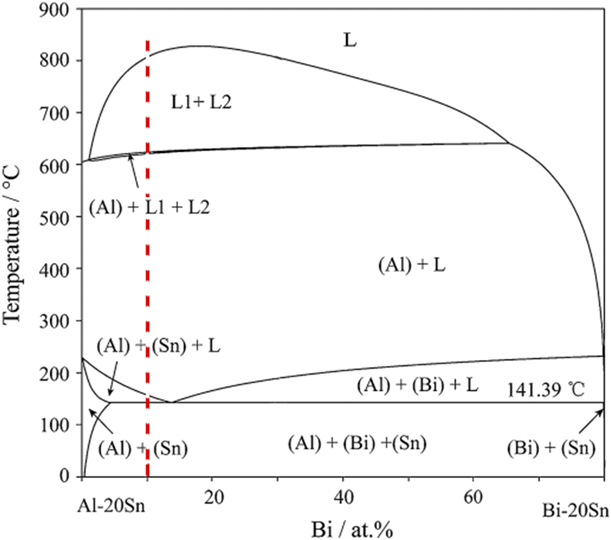
The alloy ingot with the nominal composition of Al–10 at.% Bi–20 at.% Sn was prepared by pure Al (99.85 wt%), Bi (99.99 wt%), and Sn (99.99 wt%) through medium frequency induction melting. The pseudo-binary diagram is depicted in Fig. 9 relative to a parameterized concentration of 20 at.% Sn [Reference Liu, Wang, Yu, Liu, Takaku, Ohnuma, Kainuma and Ishida24]. The location of the experimental alloy was in the liquid miscibility gap, indicating that the solidification path of the experimental alloy would undergo the liquid–liquid separation process. The pure Al, Bi, and Sn were melted in a graphite crucible. Then, the alloy melt was mechanically stirred during the smelting process to make sure the sufficient mixing of all components for homogeneity. After induction melting and holding for 10 min at 1000 °C, the alloy melt was cast under different conditions.
The calculated vertical sections of the Al–Bi–Sn ternary system with 20 at.% Sn.

Solidification at different cooling rates
To obtain different solidification rates, three kinds of solidification processes were adopted. The following is the experimental procedure:
(i) Conventional solidification process in the graphite mold. The melt was cast into a graphite crucible with an inner diameter of 20 mm and a depth of 60 mm. The graphite crucible parceled by two layers of insulation asbestos was preheated to 700 °C. The cooling rate of this sample was 4.5 °C/s, according to the measured cooling curve by using the K-type thermocouple.
(ii) Copper mold rapid cooling experiment. The melt was rapidly cast into a copper plate mold with the orthogonal groove and covered immediately by another copper plate in the meantime. Three prepared samples were in the shape of lamellae with dimensions of 10 × 8 × 2.58 mm, 10 × 8 × 0.98 mm, and 10 × 8 × 0.37 mm. For this condition, the cooling rate
 $\dot{T}$ can be estimated by an empirical equation as follows [Reference Curiotto, Pryds, Johnson and Battezzati25].

 $$\dot{T} = K{Z^n}\quad ,$$
where K and n are constants dependent on the material and the geometry of the mold. For this experiment, the parameters K = 715 and n = −0.619 are estimated [Reference Liu, Jie, Guo, Yin, Wang and Li26]. Hence, it was estimated that the cooling rates were about 400 °C/s, 720 °C/s, and 1320 °C/s in the copper plate molds with the sample thicknesses of 2.58 mm, 0.98 mm, and 0.37 mm, respectively.
(iii) Water quenching experiment. Some spherical samples were prepared by quenching the melt into water directly after holding for 10 min at 1000 °C in medium frequency induction furnace. Because of the small size of liquid alloy spheres and dispersion in the water, it is difficult to measure the temperature change in the real-time manner. The heat conduction and heat convection processes were considered when alloy droplets descended in water [Reference Lu, Zhang and Li8]. The cooling rate R c was calculated by the Newtonian model as follows [Reference Ruan, Wang, Chang and Wei27, Reference Zhu, Ruan, Gu, Yan and Dai28]:
 $${R_{\rm{c}}} = \left| {{{{\rm{d}}T} \over {{\rm{d}}t}}} \right| = {6 \over {{\rho _{\rm{d}}}{C_{\rm{p}}}D}}h{\left( {T - T} \right)_{\rm{l}}}\quad ,$$
with
 $$h = {{{k_{\rm{l}}}} \over D}\left( {2 + 0.3 {{\Pr }^{0.33}} {{{\mathop{\rm Re}\nolimits} }^{0.6}}} \right)\quad ,$$
 $$\Pr = {{{C_{\rm{p}}}\mu } \over {{k_{\rm{l}}}}},\;{\mathop{\rm Re}\nolimits} = {{{\rho _{\rm{l}}}DV} \over \mu }\quad ,$$
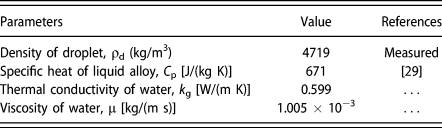
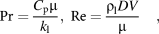
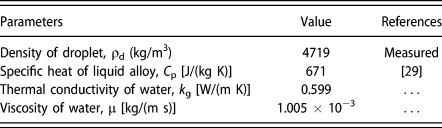
where ρd is the density of alloy droplets, C p is the specific heat, D is the diameter of alloy droplets, h is the heat transfer coefficient of water, T is the casting temperature, T l is the temperature of water, k l is the thermal conductivity of water, P r is Prandtl number, Re is Reynolds number, μ is the dynamic viscosity of water, and ρl is the density of water. The corresponding parameters are presented in Table I. When D = 5 mm, it is estimated that the cooling rate R c was about 2900 °C/s.
The parameters used in the calculation.
Characterization
To reveal the solidification behavior of immiscible Al70Bi10Sn20 alloy at different cooling rates, the samples were ground, polished, and etched for morphology observation and phase composition analysis. The samples were etched by a solution containing 5 g FeCl3, 5 mL HCl, and 95 mL C2H5OH. Microstructures were examined by an optical microscope (Japan, Olympus GX51), a scanning electron microscope (Germany, Zeiss supra 55) equipped with an EDS (UK, Oxford INCA X-ACT), and an electron probe micro-analyzer (Japan, JXA-8530F PLUS). The samples used for composition analysis were not etched. Phase transformation behavior was investigated using DSC (STA 449C) at a scan rate of 10 °C/min from room temperature to 300 °C (Germany, NETZSCHS—TA449C).
Acknowledgments
The authors gratefully acknowledge the supports of National Key Research and Development Program of China (Nos. 2016YFB0301303 and 2017YFA0403800) and the National Natural Science Foundation of China (Nos. 51771040, 51501028, 51690163, and 51525401).