I. INTRODUCTION
Most wireless sensor networks (WSN) are battery powered. Despite significant progress, batteries still have a limited lifetime. This explains the motivation to find alternative ways to power these objects. A promising method consists in harvesting energy from the ambient environment of the microsystems. Besides using thermal gradients, mechanical vibrations, or light waves as sources of energy, electromagnetic waves have recently drawn interest as a possible source of energy [Reference Paradiso and Starner1]. Unlike most energy sources, the electromagnetic or RF energy sources are continuously available. Although being ubiquitous in our daily lives, the drawback of RF sources is that the power density they can provide is low compared to other sources [Reference Visser, Reniers and Theeuwes2]. In order to assess the practicable locations of ambient RF energy harvesters, the RF power density level in the sensor environment has to be quantified. In addition, due to the multitude of sensor applications, these measurements have to be made in various environments, i.e. city, countryside [Reference Tentzeris and Kawahara3, Reference Mann, Cooper, Allen, Blackwell and Lowe4].
The goal of an ambient RF energy harvester is to convert the RF energy received from RF ambient sources into DC power. Such harvesters are called rectenna (rectifying antenna) [Reference Brown, George, Heenan and Wonson5]. A typical rectenna circuit consists of a receiving antenna followed by an impedance matching network, a rectifier, a DC filter and a load. Previous works focusing on RF harvesting circuits have been presented for a single frequency operating band [Reference Vyas, Cook, Kawahara and Tentzeris6, Reference Huang, Zhang, Chen, Huang and Liu7]. The functionality of such harvesters is drastically degraded if the operating frequency is changed from the optimal resonance frequency. So, a single-tone rectenna is not suitable in ambient environment as the predominant frequencies are different depending on the sensor location [Reference Visser, Reniers and Theeuwes2]. Other works report multiple single frequencies, which are used to increase the amount of power harvested [Reference Keyrouz, Visser and Tijhuis8–Reference Suh and Chang10]. This type of rectenna benefits from the accumulation of RF radiation for several frequencies and its RF-to-DC conversion efficiency in ambient environment is potentially higher than that of a single-tone rectenna [Reference Keyrouz, Visser and Tijhuis8]. But such rectenna type is frequency selective and does not take into account the entire RF base stations bandwidth available. To cover this issue, RF wideband rectennas appear as an opportunistic solution. It is not tuned to specific frequencies but to various signals over a bandwidth, typically several hundreds of MHz [Reference Nimo, Grgic and Reindl11]. The issue of such a technique is its low RF-to-DC conversion efficiency compared to the multi-band ones. In order to improve the RF-to-DC conversion efficiency on a wide RF band, a new wideband filter synthesis technique is proposed in this paper. It takes into account both wideband behavior constrains as well as impedance matching conditions of the different involved components, e.g. rectifier and antenna. In this paper, a method to calculate the RF filter components values yielding the maximum power transfer on RF frequency bands chosen is described. This method is used to design a rectenna covering the GSM1800, UMTS and Wi-Fi frequency bands. Simulation and measurements confirm the proposed architecture efficiency is at least 10% better compared to previous work [Reference Nimo, Grgic and Reindl11, Reference Hagerty, Helmbrecht, McCalpin, Zane and Popovic12].
The paper is organized as follows: Section II shows the RF power density measurement data produced by RF base stations in France and local Wi-Fi transmitters. Section III explains the structure of a wideband RF harvester. Section IV, describes the design method to maximize energy transfer. Finally, Section V presents the RF wideband harvester measurements. Section VI concludes the paper.
II. RF POWER DENSITY: MEASUREMENT DATA
Before starting the design of RF harvesters it is of interest to estimate the power density RF base stations can provide in different living environments. Data can be available from measurement campaigns usually performed to evaluate the exposure of the population to electromagnetic fields [Reference Visser, Reniers and Theeuwes2, 13–Reference Kawahara, Tsukada and Asami15]. So, in order to complete these reports, raw data provided by the French National Frequencies Agency (ANFR) have been used to compute the statistical results presented in this section.
A) Preliminary indications
Relay antennas transmit continuously with a power ranging from few watts up to 30 W depending on the geographical coverage and the type of cells considered [16]. Geographical indications of points of emission, He, and reception, Hr, are detailed on Fig. 1. Since loss is a function of the distance between two points, i.e. emission and reception, both the ground distance d, and the height difference, Delta, must be taken into account [Reference Haslett17].
Geographical measurement indications with d: distance between emission and reception points. Hr and He are the heights of reception and emission points, respectively.

B) Summary of ANFR data
On the ANFR web site, an interactive map is available [14]. It provides power measurements and parameters information from RF base stations. From these raw data, the average power density and the standard deviation are calculated for 200 measurement points in urban environments and 200 other in the countryside.
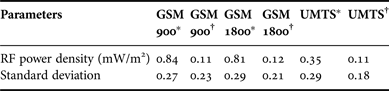
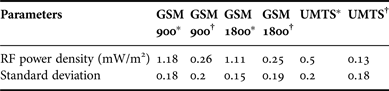
The three predominant RF bands from all RF transmitter base stations are GSM900, i.e. 935–960 MHz, GSM1800, i.e. 1805–1880 MHz and UMTS, i.e. 2110–2170 MHz. Tables 1 and 2 summarize the calculation results for these three RF bands. Either in urban environments or in the countryside, GSM900 and GSM1800 base stations emit similar RF power density levels. For either RF base stations, the average RF power density is 30% higher in urban environments than in the countryside. It has to be noted that the measurements conditions between Tables 1 and 2 are slightly different. This is linked with the emitter point heights, He = 25 m for a micro cell and He = 35 m for a macro cell. The higher standard deviation in the countryside implies a higher dispersion in term of RF power density compared to the data in urban environments. So, the latter is more appropriated for the RF harvester workability.
Average RF power density and standard deviation measured in the countryside.
*Conditions: d = 50 m and Delta = 30 m.
†d = 200 m, Delta = 30 m.
Average RF power density and standard deviation measured in urban environment.
*Conditions: d = 50 m and Delta = 20 m.
†d = 200 m, Delta = 20 m.
C) Wi-Fi routers and indoor exposure levels
Wi-Fi signals appear today as widely available RF sources in ambient environment. Consequently Wi-Fi can be considered for providing energy to sensors, if acceptable RF powers remain available. In France, the radiated power of a Wi-Fi router must not exceed 100 mW, as regulated by the Autorité de Régulation des Télécommunications (ACERP) [18]. Nevertheless, French routers are configured to radiate 50 mW [19]. Since data on Wi-Fi exposure levels are not readily available in the literature, measurements have been performed to compare the RF power transmission of two different routers. A portable dosimeter [20] placed 50 cm from two different Wi-Fi routers [21, 22] show that same power levels are obtained. Moreover, the radiated power does not depend on the number of users but only on whether data are downloaded or not. It is lower in the latter mode.
D) Summary
The RF power density from a Wi-Fi signal remains lower than that of a GSM base station. But Wi-Fi is more or less confined to indoor environments and the distance to a router is usually small. In this case, high power density levels can be obtained. An RF harvester has to be located at most at 300 m from an RF base station or at few meters from a Wi-Fi router.
All these measurements highlight that the RF power density is low in ambient environment. So, harvesting multi RF bands is a relevant solution to increase the amount of power harvested. A wideband RF harvester design is presented in the following section.
III. WIDEBAND RF HARVESTER ARCHITECTURE
A) Global topology choice
In order to harvest RF energy from several frequencies, either wideband or multi-band can be investigated. The difference lies in the design of the RF filter design. In the multi-band case, several specific frequencies are selected. One of the two possible architectures is illustrated on Fig. 2(a). The RF filter is designed to select a specific frequency. Then, several rectennas are stacked in parallel and their DC outputs are added to the same load [Reference Keyrouz, Visser and Tijhuis8–Reference Suh and Chang10]. In [Reference Keyrouz, Visser and Tijhuis8], this principle is used for three RF frequencies. With an incident power of −15 dBm per frequency, 45% RF-to-DC conversion efficiency is obtained at 0.9 and 1.8 GHz and 25% at 2.45 GHz. The issue of this topology is that no energy is harvested outside the selected frequencies. Furthermore, it is not suitable for compact applications due to the number of antennas used. Figure 2(b) illustrates another architecture to harvest multi-band RF frequencies. Only one RF filter is designed to select several specific frequencies. A dual band prototype has been designed in [Reference Sun, Guo, He and Zhong23]. For an incident power of −15 dBm at 1.8 and 2.1 GHz, a power efficiency of 40% is obtained for both frequencies. Few works are reported with this RF filter topology. In most prototypes, no more than two frequencies are used due to the filter design constraints. Indeed, additional frequencies make the RF filter complex to design and the losses become predominant. This causes a drastic decrease in RF-to-DC conversion efficiency [Reference Collado and Georgiadis24]. Generally speaking, multiband harvesters require highly selective RF filters. The difficulty to design these filters lies in the fact that each branch has to be adapted for the dedicated frequency and has to be seen as an open circuit for the other branches for the rest of the RF band. For instance, the proximity between 2.1 and 2.4 GHz bands requires high order RF filters, with drawbacks concerning induced losses and complexity. So, neither this topology has been considered. Figure 2(c) shows the wideband approach. This topology relaxes the inter-band isolation criterion since the RF filter is designed to pass signals over a wide bandwidth. In [Reference Nimo, Grgic and Reindl11], for an incident power of −30 dBm and a 300 MHz bandwidth, a RF-to-DC conversion efficiency of 5% is obtained. The global RF-to-DC conversion efficiency is lower compared to that of the multi-band harvesters but it is operational on a wide RF frequency band. It is consequently less sensitive to RF spectrum availability. Figure 2(d) illustrates the architecture proposed in this paper. It benefits from both the multi-band and wideband concepts. Several rectennas are parallelized and their DC outputs are added to the same load. The number of branch is not limited.
(a) Several RF monotone rectennas parallelized, (b) one multi-band RF filter, (c) wideband RF harvester, (d) wideband RF harvester topology proposed and (e) RF filter bandwidth enlarged to create a wideband RF harvester.
By carefully selecting the bandwidth around each frequency, it is then possible to harvest energy within a wide frequency band, as illustrated on Fig. 2(e). To ensure the best possible RF-to-DC conversion efficiency, selecting the right rectifier topology is crucial as shown on the following section.
B) Rectifier criteria
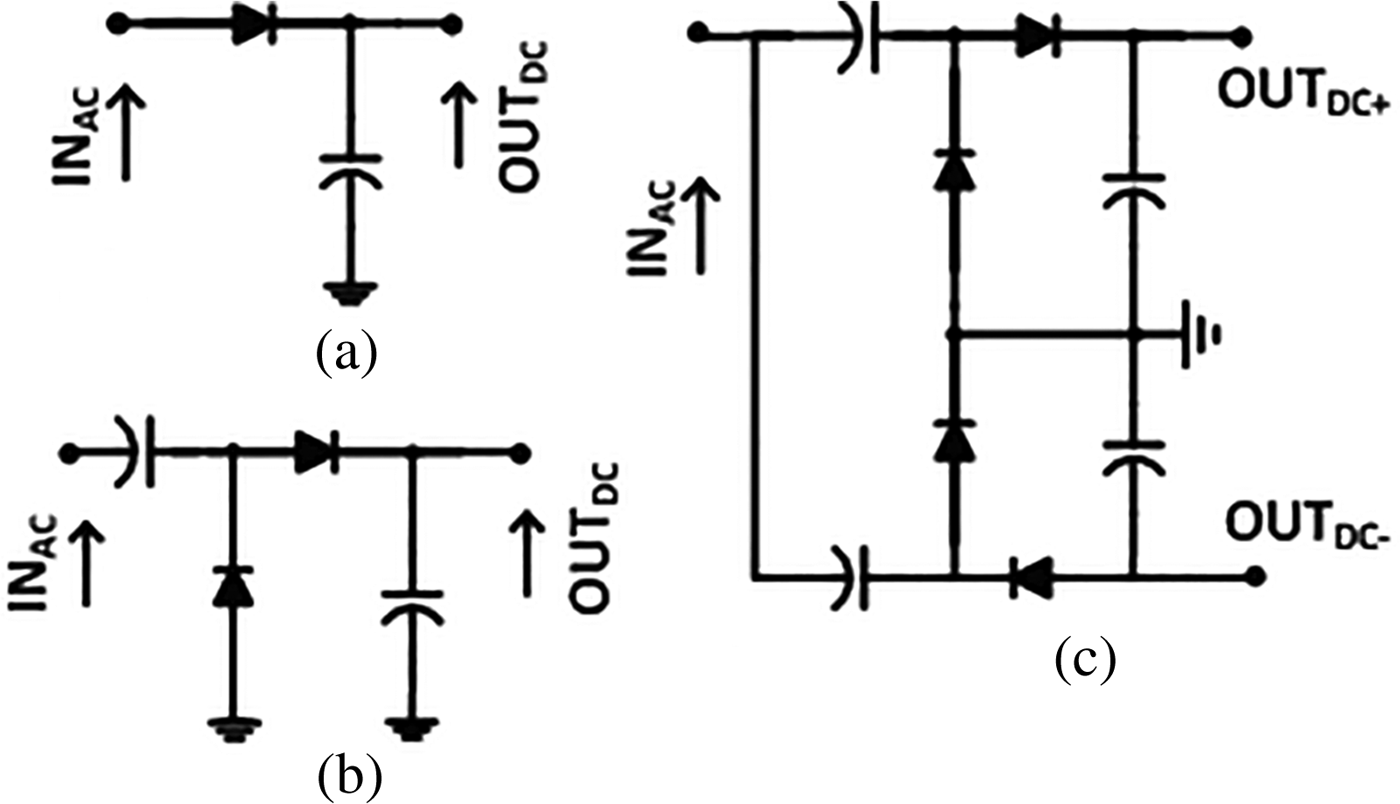
Several rectifier topologies exist depending on the incident power and frequency. Some examples are given on Fig. 3. The series topology, Fig. 3(a), is preferred to the other ones when considering low incident power [Reference Pinuela, Mitcheson and Lucyszyn9, Reference Sun, Guo, He and Zhong23, Reference Collado and Georgiadis24]. Other structures like voltage doubler [Reference Keyrouz, Visser and Tijhuis8, Reference Li, Shao, Shahshahan, Goldsman, Salter and Metze25, Reference Zhang, Huang and Cao26], Fig. 3(b), or Greinacher [Reference Pavone, Buonanno, D'Urso and Della Corte27] illustrated on Fig. 3(c), have higher DC voltage levels than series structures for a given input power level. The association of several rectifiers as described in the previous section and illustrated in Fig. 2(a), can also directly affect the overall efficiency of the architecture [Reference Olgun, Chen and Volakis28]. Indeed, rectifiers have a differential or single-ended output. The association of two Greinacher rectifiers allows a better DC summation [Reference Pavone, Buonanno, D'Urso and Della Corte27] than two series rectifiers. But two staked Greinacher rectifiers require higher incident power than two series rectifiers to switch on the numerous diodes.
Three topologies of rectifier: (a) series, (b) voltage doubler and (c) Greinacher.
Consequently, choosing the rectifier topology implies a compromise between output voltage, incident power and DC output associations. The optimal trade-off, in the context of outdoor Wireless Sensor Nodes (WSN), is the single series diode structure as demonstrated in [Reference Kuhn, Seguin, Lahuec and Person29].
C) Schottky diode choice
The diode used in the rectifier is a determinant component in case of low levels of incident power. When only low power levels are available in the environment, the magnitude of the incident signal can be closed to the threshold voltage V TH. Then, losses in the diodes themselves become predominant [Reference Merabet30]. A solution to overcome this problem is to use “zero bias” Schottky diodes with low V TH, e.g. 150 mV. In the literature many prototypes are designed with the SMS7630 [Reference Sun, Guo, He and Zhong23] or HSMS2852 [Reference Keyrouz, Visser and Tijhuis8] Schottky diode. Diode HSMS2852 is not considered due to its high junction capacitor [Reference Suh and Chang10]. In [Reference Hagerty, Helmbrecht, McCalpin, Zane and Popovic12], three different diodes are compared. Out of the three the SMS7630 has the lowest threshold voltage. Another diode with the same V TH is the MSS20-141 diode which is used in commercial dosimeters. In order to choose between the SMS7630 and the MSS20-141 diode, two series rectifier have been fabricated and tested. A R&S®SMJ100A power generator directly connected to the rectifier emulates the RF source. At 1.8 GHz, the input power level is swept from −30 to 0 dBm and the DC output voltage is measured on a 1 kΩ load. The power efficiency, η, is defined as (1), where P dc is the DC output power and Pin is the RF input power.
 $$\eta = \displaystyle{P_{dc} \over P_{in}}.$$
The measured RF-to-DC conversion efficiencies of the two series rectifiers as a function of the input power are shown on Fig. 4. The best diode to design the rectifier with is the MSS20-141 since it offers the highest efficiency for incident power lower than −5 dBm.
RF-to-DC conversion efficiency measured for two series rectifier: one with the metelics diode and the other one with the SMS7630.
Once the topologies of the RF harvester and of the rectifier and the diode have been chosen, the goal now consists in designing the harvester for maximum power transfer from the antenna to the load over a given frequency bandwidth. For this purpose, a design methodology valid for any bandwidth is proposed in the next section.
IV. DESIGN METHOD TO MAXIMISE THE POWER TRANSFER
A) Matching network designed
Thanks to the maximum power transfer theorem, the highest power is transferred to the load if the source and load complex impedances are complex conjugates [Reference Cuthbert31]. This is achieved by means of an impedance matching network placed between the antenna and the rectifier. Whenever a source or a load has a reactive component, the adaptation depends on the frequency for which it is designed. Thus, the matching network is also considered as an RF filter. The most frequently used matching networks are the L, the Π and the T networks [Reference Breed32, Reference Kanaya, Tsukamaoto, Hirabaru, Kanemoto, Pokharel and Yoshida33]. Regarding the matching network concept, the ratio between the energy stored in the filter and the energy dissipated, denoted the quality factor, Q, is an important parameter. A high Q means a small amount of energy dissipation but also a narrow bandwidth.
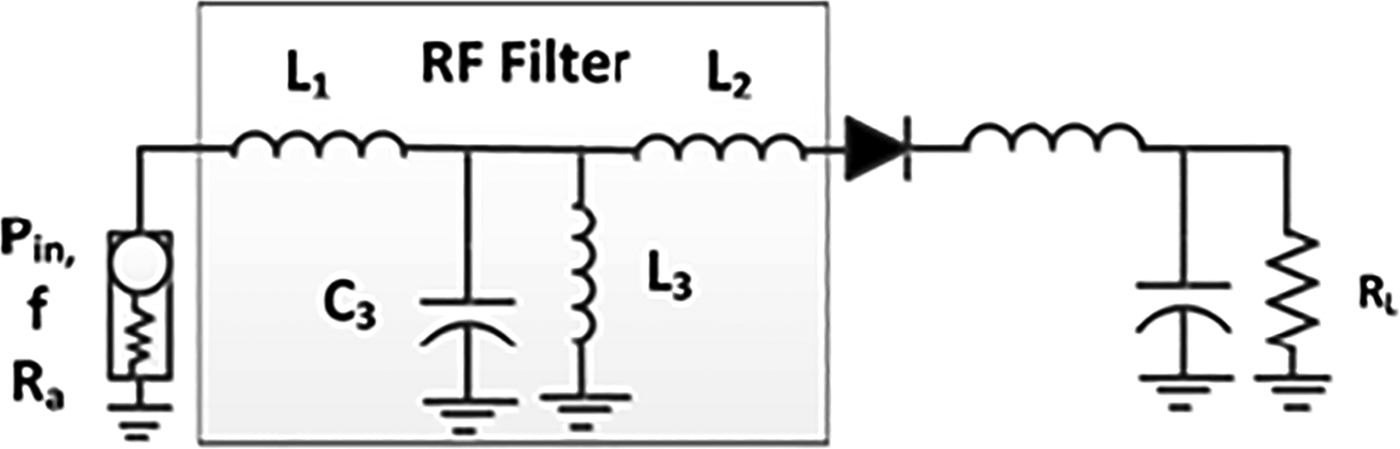
The RF harvester is illustrated on Fig. 5(a). To design the impedance matching network, the input impedance of the rectifier, Z rect, is first determined. The receiving antenna is modeled as a simple resistor R a, which can also depend on the frequency. The RF harvester is simulated using the Advanced Design System (ADS), software from AgilentTM. To take into account the non-linear behavior of the rectifier, harmonic-balance method is employed. As shown on Fig. 5(b), Z rect varies with frequency and incident power.
(a) RF harvester schematic. (b) Rectifier input impedance: real part (upper plane) and imaginary part (lower plane) depending on the incident power and on the frequency.
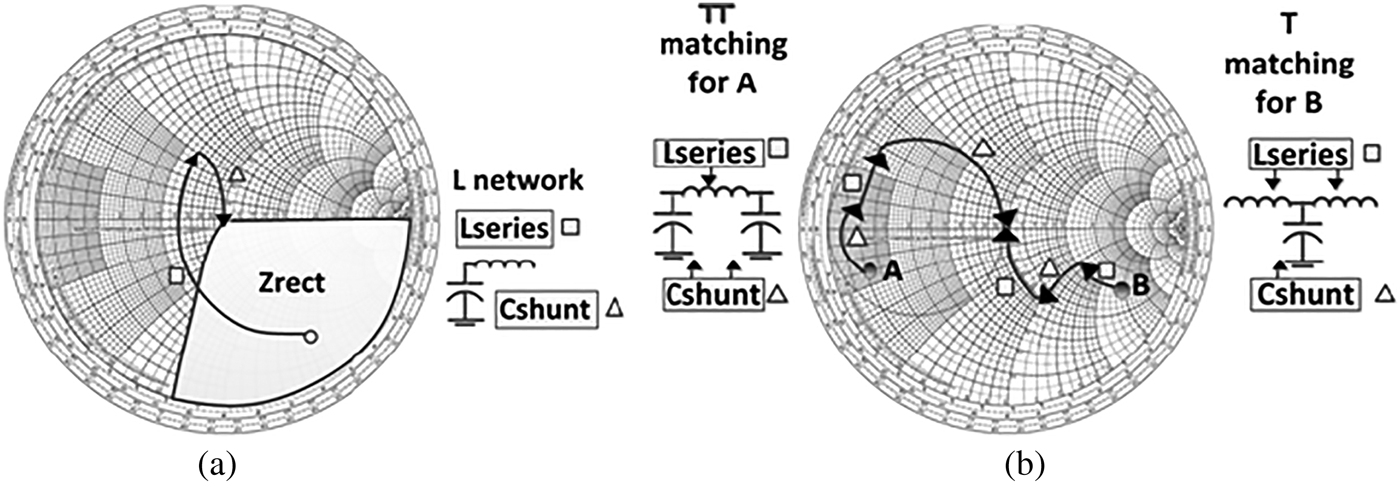
Despite the variations, Z rect is within the highlighted zone of the Smith Chart, Fig. 6(a). This figure shows the L topology can be used as matching network. This 2-variable network can be easily tuned for a given load impedance. However, no other design parameters such as parasitic effects, harmonic rejection or bandwidth control can be adjusted. For these purposes, both the Π and T-networks, shown on Fig. 6(b), are best suited [Reference Thompson and Fidler34]. Points A and B on this figure are examples of input impedances of circuits to adapt. The T-network is chosen as it correlates with the Z rect zone of Fig. 6(a). The RF harvester designed is depicted on Fig. 7.
(a) Rectifier input impedance, L network. (b) T and Π network on the Smith chart. A and B are input impedance circuit examples
Harvester topology including RF filter circuit.
In order to increase the bandwidth and suppress undesired high frequencies close to the resonance frequency F s (2), a capacitor C 3 in parallel with an inductor L 3 replaces the usual shunt capacitor of the T-network.
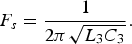 $${F_s}=\displaystyle{1 \over 2\pi \sqrt{L_3 C_3}}.$$
However, with four component variables, virtually unlimited combinations of inductor and capacitor values may be used to achieve the desired impedance matching condition. So, an optimization process is required to achieve the design goal.
B) Optimization process
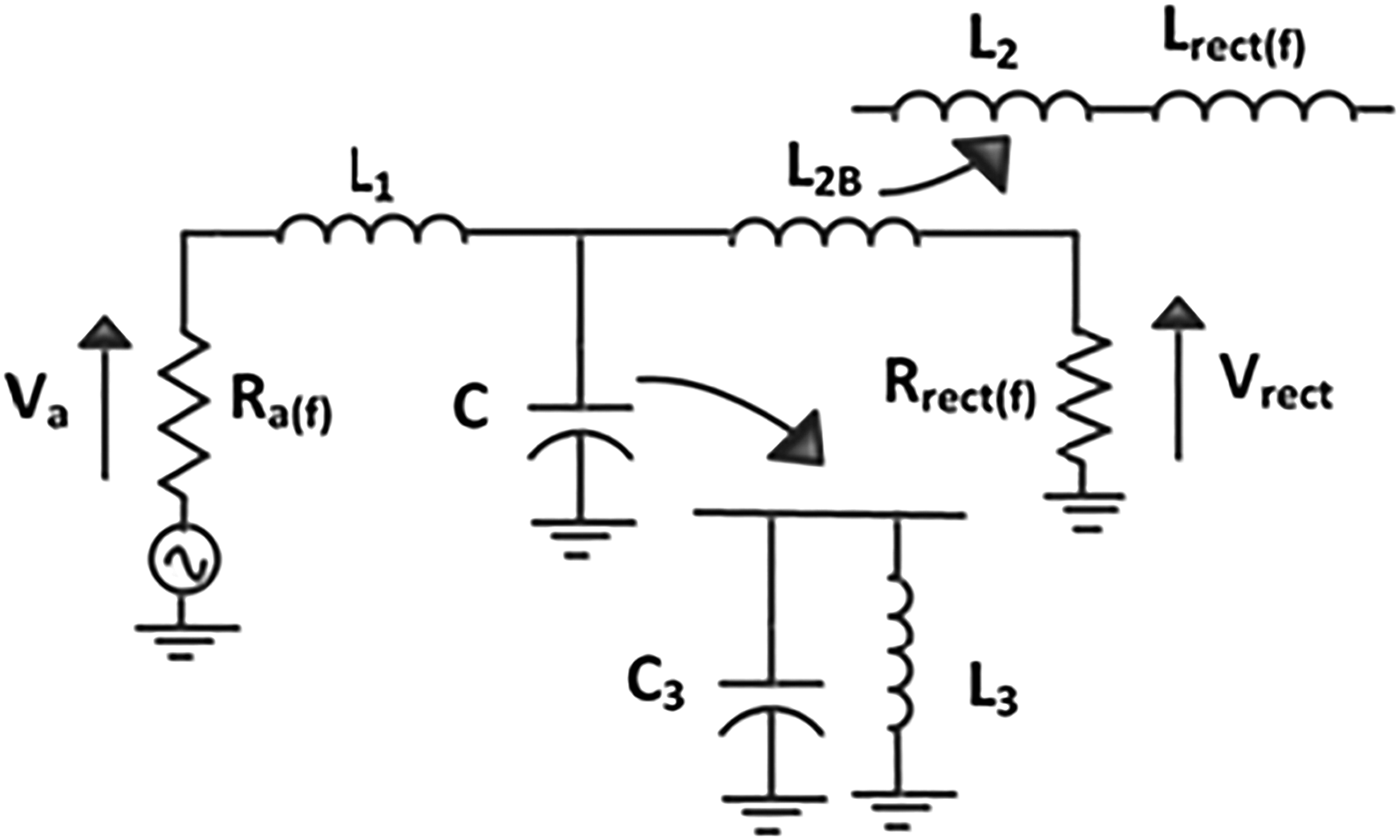
The purpose is to calculate the component values of the matching network designed such that the maximum power is transferred from the receiving antenna to the load in the chosen RF band. Considering the circuit of Fig. 8, the receiving antenna impedance seen by the matching network is equal to R a. The load is the input impedance of the rectifier modeled as Z rect = R rect + j*X rect. As Z rect is complex, the reactance X rect can be absorbed into the impedance matching network, hence L 2B = L 2 + L rect.
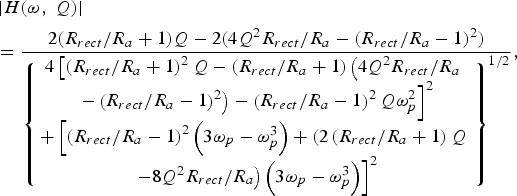 $$\eqalign{&\left\vert H\lpar \omega\comma \; Q\rpar \right\vert \cr & = \displaystyle{2\lpar R_{rect} / R_a + 1\rpar Q - 2\lpar 4{Q^2} R_{rect} / R_a - \lpar R_{rect} / R_a - 1 \rpar^2 \rpar \over \left\{\matrix{4\left[\left(R_{rect}/R_a + 1\right)^2 Q - \left(R_{rect}/R_a + 1 \right) \left(4Q^2R_{rect}/R_a \right. \right. \cr \left. \left. -\left(R_{rect}/R_a- 1\right)^2\right)- \left(R_{rect}/R_a-1\right)^2 Q\omega _p^2\right]^2 \cr + \left[\left(R_{rect}/R_a-1 \right)^2\left(3\omega_p-\omega_p^3\right) +\left(2\left(R_{rect}/R_a+1\right)Q \right. \right. \cr \left. \left. - 8 Q^2 R_{rect}/R_a\right)\left(3\omega_p-\omega_p^3\right) \right]^2} \right\}^{1/2}} \comma}$$
where ω p = ω/ω c and 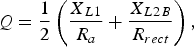 $Q = \displaystyle{1 \over 2}\left({X_{L1} \over R_a} + {X_{L2B} \over R_{rect}} \right),$
 $$L_1 = \displaystyle{R_{rect} \lpar 2 Q_0 - \sqrt{4Q_0^2 R_{rect} / R_a - \lpar} R_{rect} / R_a - 1 \rpar^2 \over \omega _c \lpar 1 - R_{rect} / R_a \rpar^2} \comma \;$$
 $$L_2 = \displaystyle{\matrix{R_{rect} \lpar 2 Q_0 R_{rect}/ R_a \hfill \cr - \sqrt{4Q_0^2 R_{rect}/R_a - \lpar R_{rect} / R_a - 1\rpar^2}} \over \omega _c \lpar 1 - R_{rect}/ R_a \rpar} - L_{rect}\comma \;$$
 $$C_3 = \displaystyle{2Q_0 \over \omega_c} R_{rect} \lpar 1 + \lpar L_1 / R_a \rpar^2 \rpar\comma \;$$
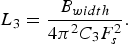 $${L_3}=\displaystyle{{{B_{width}}} \over {4{\pi ^2}{C_3}F_s^2 }}.$$
The voltage transfer function, H (ω), can be expressed as a function of the quality factor, Q (3). Furthermore, the network components have been expressed as a function of Q in (4)–(7). It has to be noted that L 3 depends on the RF filter bandwidth B width, which is another degree of freedom in the design. The goal here is to maximize the power transfer in B width.
RF filter schematic.
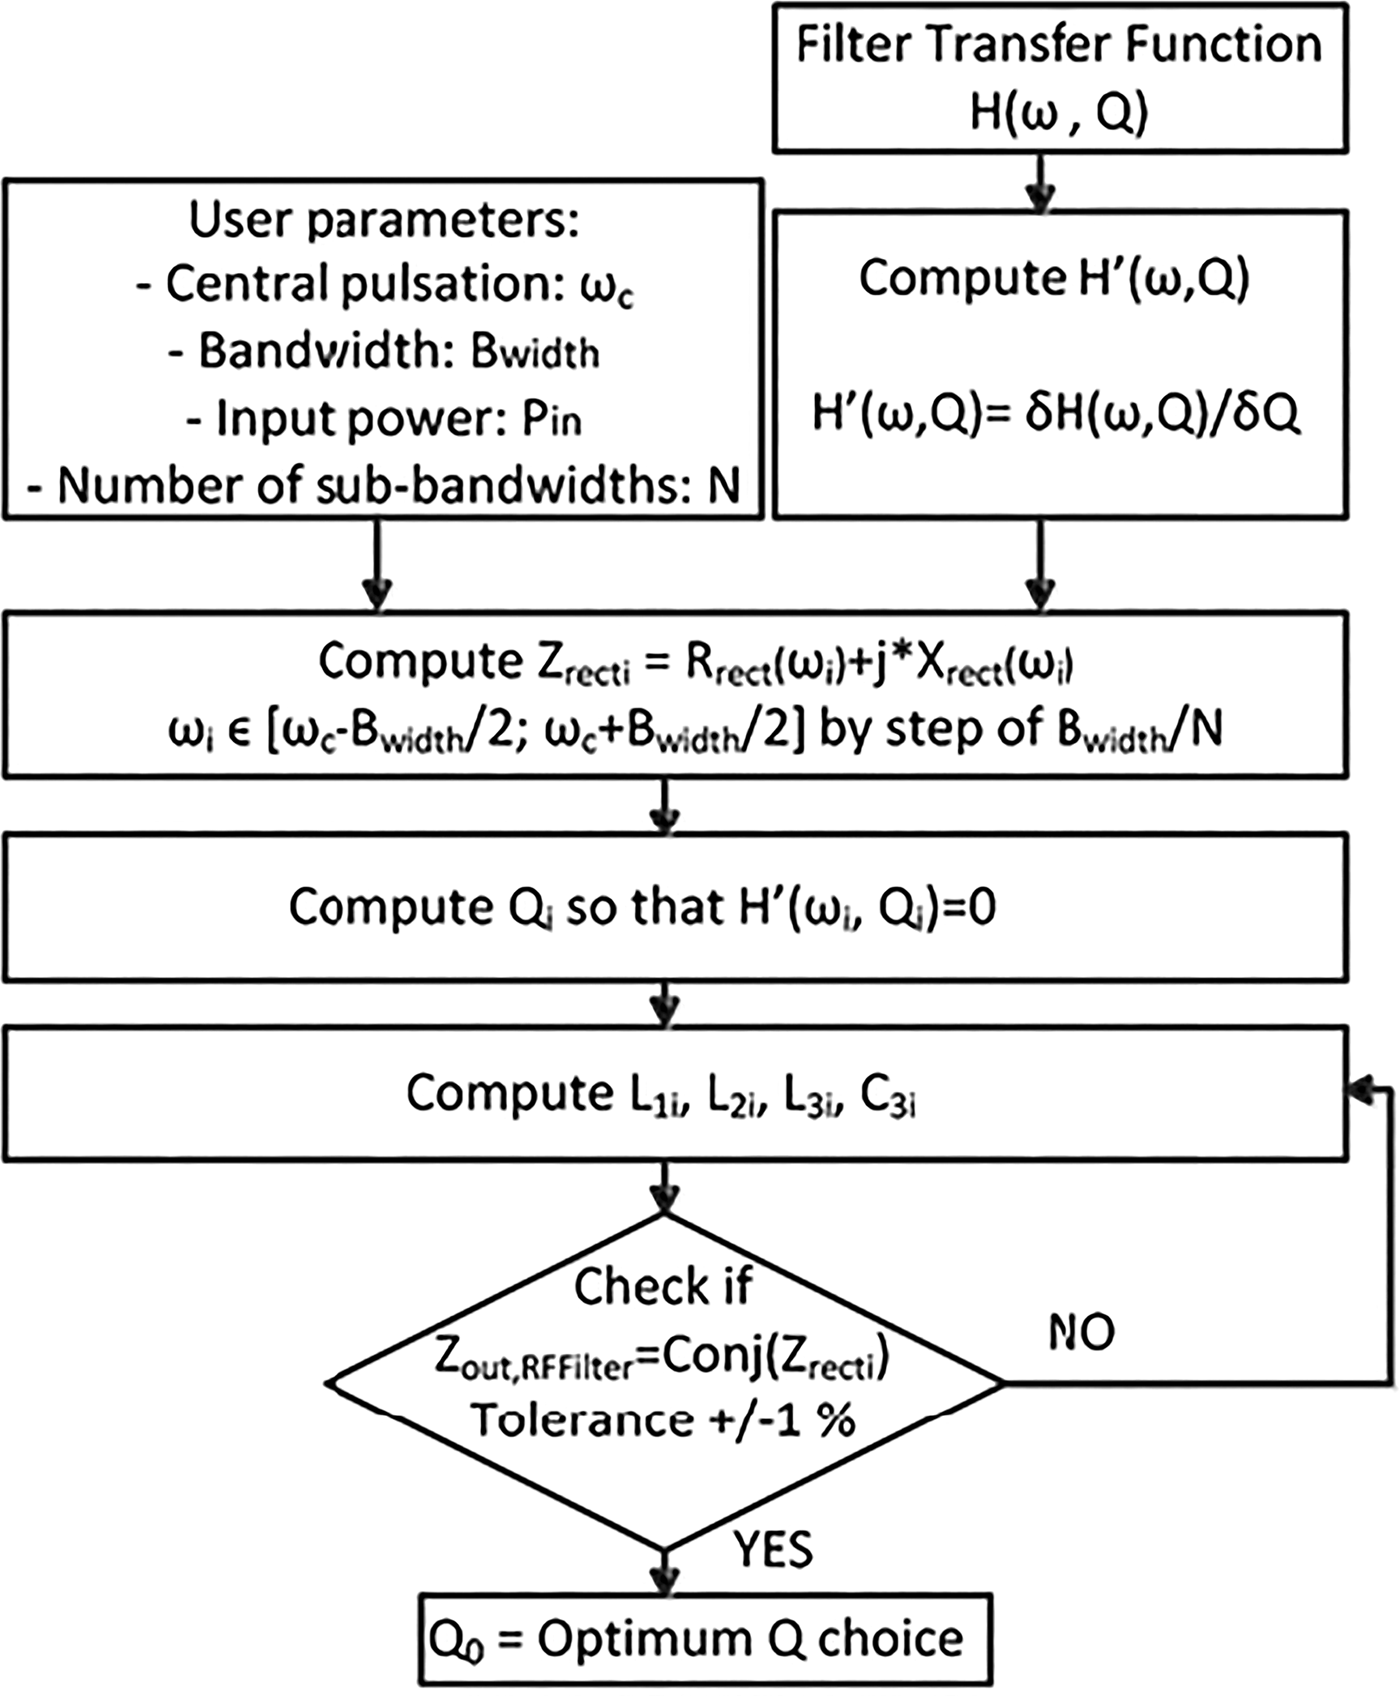
An algorithm has been developed and is illustrated on Fig. 9. Q 0 is obtained by nulling the derivative, with respect to Q, of the filter transfer function. As the rectifier input impedance Z rect is not constant, several Z recti are computed over the bandwidth, B width. This allows finding filter components values L 1i, L 2i, L 3i, and C 3i. This calculation is iterated until the RF filter output impedance, Z out,RFfilter, is matching with the conjugate of the rectifier input impedance, Z rect, over the bandwidth considered with a 1% tolerance. At the end of the process, the optimum quality factor Q 0 is obtained. For a given bandwidth the highest Q 0 is always obtained since Z out,RFfilter matches Z rect, i.e. maximum power transfer and thus maximum conversion RF-DC efficiency.
Algorithm to find the optimum Q 0.
A Matlab© program has been used to solve these equations by means of the Newton's method to obtain the optimum impedance adaptation in the chosen RF band. The optimization process is done with ωc = 1.8, 2.1, and 2.4 GHz, B width = 200 MHz, P in = −15 dBm, and N = 20.
V. PROTOTYPE AND EXPERIMENTAL RESULTS
A) Prototype design
The prototype has been designed for three RF bands. Based on power density data given in Section II, GSM1800, UMTS2100 and Wi-Fi bands are selected. The proposed design method is applied to compute the components values of the three corresponding RF filters having B width = 200 MHz. The bandwidth of 200 MHz has been selected in order to be able to harvest RF energy between 1.8 and 2.5 GHz as the GSM1800, UMTS and Wi-Fi are closed to each other. Indeed, the GSM1800 entire band is from 1710 to 1880 GHz including UL, i.e. UpLink, and DL, i.e. DownLink, modes, the UMTS band is from 1920 to 2170 GHz (including UL and DL modes) and finally the Wi-Fi band is from 2.41 to 2.48 GHz.
Agilent ADS harmonic balance is used to simulate the rectifier DC output voltage as a function of the frequency. The Schottky diode is the Metelics MSS20-141 and the DC filter is a 3.3 nH self in series and a 68 pF capacitor in parallel. The input power is set to 0 dBm. The antenna impedance, R a, is set to 50 Ω in the considered RF band and R L to 430 Ω. This load has been set to this value as it corresponds to several sensors input impedance [Reference Wong35]. The frequency response in terms of DC output voltage for an RF harvester, Fig. 10(a), for each of the three RF bands is simulated with the components values from Matlab©. As illustrated on this figure, each RF band is covered and the bandwidth is around 200 MHz. It has to be noted that depending on the RF bandwidth chosen, the value of Q 0 changes. The DC output voltage for an RF harvester designed for the UMTS band, is simulated as a function of the frequency for several Q 0 values as illustrated in Fig. 10(b). The higher Q 0 is, the narrower the RF bandwidth is. Although the method correctly evaluates the components values, it does not take into account parasitic components and substrate effect. Furthermore, it does not fit with standard CMS values. Although these can be integrated into Matlab©, it is easier to assign this task to ADS software.
(a) Simulated DC output voltage of the 3 rectennas with components value found with Matlab and of the proposed wideband architecture. (b) Simulated DC output voltage for the 2.1 GHz rectenna as a function of frequency for several Q 0 values.
With starting values (*) defined in Table 3, the ADS harmonic balance optimizer yields values (**) shown in Table 3. DC output voltage of the optimized wideband RF harvester is simulated as a function of frequency. As shown on Fig. 10(b), the DC response is constant over a wide frequency range i.e. from 1.8 to 2.6 GHz. Figure 11 shows the prototype RF harvester fabricated on a 508 µm thick Rogers R04003 substrate, with permittivity ε r = 3.3.
RF wideband harvester.
Matching network parameters obtained with the proposed method (Matlab (*)) and the final architecture (ADS (**)).
B) Rectifier measurements
Figure 12(a) illustrates the measured input port voltage reflection coefficient, i.e. S 11, of the rectifier for a −15 dBm input level. The impedance matching is well achieved from 1.8 to 2.6 GHz. In order to validate the other rectifier functionalities, a test bench consists of an R&S®SMJ100A power generator directly connected to the rectifier and a 430 Ω resistor, R L, as load, across which a voltmeter is connected. The value of the resistor is optimum for maximizing power transfer on the entire RF band based on simulations. The incident frequency is swept from 1 to 3 GHz at a fixed given output power Pin and the DC output voltage is measured. As Fig. 12(b) shows, the measured output power is in line with the one simulated with ADS.
(a) Measured S11 at P in =− 15 dBm. (b) DC output power comparison between simulation and measurements.
Figure 13(a) shows the rectifier RF-to-DC conversion efficiency calculated, using (1), from DC output voltage measurements with P in = 0, −10, −20 and −25 dBm. A 42% efficiency is obtained with Pin = 0 dBm and drops to 15% for P in = −20 dBm. The three targeted RF bands are covered and the efficiency obtained is almost constant over the 800 MHz frequency band. The effects of R L on the RF-to-DC conversion efficiency are also assessed and are depicted on Fig. 13(b) for two frequencies, 1.9 and 2.1 GHz and P in = −10 dBm. The optimum load value, i.e. 430 Ω, correlates between simulations and measurements. Its value has been used for all following measurements.
(a) Rectifier's RF-to-DC conversion efficiency measured for several Pin with R L = 430 Ω. (b) RF-to-DC conversion efficiency comparison between simulation and measurements as a function of the load R L for Pin: −10 dBm.
After having characterized the rectifier, the complete rectenna is tested in real conditions.
C) Rectenna measurements
The selected wideband dipole is pictured on Fig. 14(a). Its dimensions are 10 cm × 10 cm and its gain is given on Fig. 14(b). The complete RF energy harvester is placed in an anechoic chamber to evaluate the performance of the rectenna in presence of one to three RF sources. The load value R L is 430 Ω. Each RF source is emulated by means of an R&S®SMJ100A power generator delivering a 10 dBm input power. The first is set to 1.88 GHz, the second to 2.17 GHz and the third to 2.45 GHz. Each generator is connected to a dipole antenna having 900 MHz bandwidth, from 1.8 to 2.7 GHz with a gain of 2 dBi in the RF band. The RF transmitters and the rectenna are distanced from 30 to 200 cm. Figure 15(a) shows the DC output power as a function of distance with one, two or three emitting sources. The DC output power increases in the presence of additional RF sources. Figure 15(b) represents the RF-to-DC conversion efficiency with one or three RF sources emitting simultaneously as a function of the distance. The RF-to-DC conversion efficiency is 15% higher with three RF sources than with only one. Those results confirm the added value of this architecture in the presence of multi RF sources.
(a) Measured gain of the dipole antenna as a function of the frequency. (b) Dipole antenna picture.
(a) Measured DC output power as a function of distance (d) for one, two or three RF sources Pin = 10 dBm RL = 430 Ω. (b) RF-to-DC conversion efficiency as a function of distance (d) for one or three RF sources on 430 Ω.
Based on the results of Fig. 15(b), the RF to DC conversion efficiency is plotted as a function of the received power density as showed in Fig. 16. This conversion efficiency is higher than 45% for RF power density over 0.5 µW/cm2 and still remains at 40% at 0.15 µW/cm2 RF power density. Figure 16 also shows that the DC output power grows with RF power density.
DC output power measured and RF-to-DC conversion efficiency as a function of the total RF power density for three RF sources emitting.
D) Indoor and outdoor measurements
The rectenna has been tested in indoor conditions. The RF harvester is placed 50 cm away from a Wi-Fi box and a computer downloading data or not. The DC output power is measured at 5 and 12 µW, respectively, with R L = 430 Ω.
The rectenna has been also tested in outdoor conditions as illustrated on Figs 17(a) and 17(b). The RF harvester is placed 50 m away from a GSM1800 and UMTS base station. A dosimeter is placed near the RF harvester. The RF power density is measured at 1.2 mW/m2 and 375 µW/m2 for GSM1800 and UMTS base stations, respectively. The DC output power is measured at 7 µW with R L = 430 Ω.
(a) Test-bench: outdoor measurements. (b) Outdoor prototype measurements.
The DC output power measured in indoor and outdoor environments is large enough to power a small sensor as the one in the WSN context, which consumes an average of a dozen of µW. Furthermore, today several sensors kick-start voltages can be below 0.3 V [Reference Chang36, Reference Chen, Chang, Hsieh and Hwang37]. So, this prototype would be able to supply these sensors in low RF power density environment, e.g. −10 dBm.
E) Performance comparison
Table 4 and Fig. 18 summarize this work along with previously published works reporting measurements. Only publications with measurements considering P in below 0 dBm have been taken into account. They show that the efficiency of the proposed wideband harvester is better than the others except for the dual band harvester published in [Reference Sun, Guo, He and Zhong23]. For a total input of −18 dBm, its RF-to-DC efficiency is 38%. In the same conditions, the efficiency of the proposed harvester is 35% with three RF tones. A highly selective filter with two frequencies is designed in [Reference Sun, Guo, He and Zhong23]. It is less sensitive to losses at very low incident powers than the proposed RF filter. But for higher input power, such as at −5 dBm, their RF-to-DC efficiency is 50% and the prototype with 3 RF tones is 60%. For a global input power higher than −15 dBm, the prototype is more efficient than [Reference Sun, Guo, He and Zhong23] and it is able to harvest more power than [Reference Sun, Guo, He and Zhong23].
RF-to-DC conversion efficiency as a function of P in for one, two or three RF sources and comparison with state of the art.
Performance comparison.
VI. CONCLUSION
A wideband 1.8 to 2.6 GHz rectenna has been developed for RF energy harvesting in the context of WSN. The RF density power level in indoor or outdoor context has been evaluated. A method to optimize the design of the RF energy harvester over a wideband has been proposed. Using this method a prototype has been designed to cover three RF bands: GSM1800, UMTS and Wi-Fi. The fabricated prototype shows a 15% of RF-to-DC conversion efficiency over the three RF bands at −20 dBm input power per RF source. The efficiency reaches 25% in the presence of three RF sources for a total incident power of −20 dBm. Final results confirm the workability of the RF harvester in an ambient environment.
ACKNOWLEDGEMENT
The authors would like to thank Satimo Company and the Research Institute Pracom. (http://www.pracom.org/)
Véronique Kuhn received her engineering diploma in microelectronic from ENSICAEN engineering school, Caen, France, in 2004. From 2004 to 2012, she worked as a design engineer on audio and power management analog circuits at ST Microelectronics in Grenoble. From 2012, she is pursuing a Ph.D. degree in Electronics and Microwaves in Telecom Bretagne, Brest, France. Her main research interests are design and optimization of systems in the energy harvesting context.
Fabrice Seguin was born in Talence, France in 1973. He received his Ph.D. degree from the Universite Bordeaux 1, France, in 2001. His doctoral research concerned the current mode design of high-speed current-conveyors and applications in RF circuits. In 2002, he joined the Electronic Engineering Department of Telecom Bretagne, Brest, France, as a full-time lecturer. At PRACOM, (Pôle de Recherche Avancée en Communications) he is currently involved with design issues of analogue channel decoders and related topics, energy harvesting, reliability in nanoscale circuits and systems, and implementation of clique-based neural networks.
Cyril Lahuec was born in Orléans, France, in 1972. He received his B.Sc. (Hon.) degree from the University of Central Lancashire (UK) in 1993, his M. Eng. and Ph.D. degrees from Cork Institute of Technology (Ireland) in 1999 and 2002, respectively. He was with Parthus Technologies (now Ceva) Cork for his Ph.D. work and then as a consultant. He joined the Department of Electronic Engineering of TELECOM Bretagne as a full-time lecturer in 2002. He was with the CMOS Sensors and Systems group from the University of Edinburgh as a Visiting Researcher for 4 months in 2011. His research interests are in frequency synthesis, analogue IC design, channel decoding and biomedical applications.
Christian Person (M’94) received the Ph.D. degree in electronics from the University of Brest, Brest, France in 1994. Since 1991, he has been an Assistant Professor with the Microwave Department, Ecole Nationale Supérieure des Télécommunications de Bretagne, Brest, France. In 2003, he became a Professor with the Telecom Institute/Telecom Bretagne, where he currently conducts research with the “Information and Communication Science and Technology” Laboratory (Lab-STICC UMR CNRS 3192). He is involved in the development of new technologies for Microwave and Millimeter-wave applications and systems. His activities are especially focused on the design of passive functions (filters, couplers) and antennas, providing original solutions in terms of synthesis techniques, analysis and optimization procedures as well as technological implementation (Foam, plastic, LTCC). He is also concerned by RF integrated Front-ends on Si, and he is presently involved in different research programs dealing with SoC/SiP antennas and reconfigurable structures for smart systems.