


Introduction
Scholarship on the causes of democracy has sought to understand two empirical patterns: the strong correlative relationship between levels of material well-being and democracy (Acemoglu et al. Reference Acemoglu, Johnson, Robinson and Yared2008; Reference Acemoglu, Johnson, Robinson and Yared2009; Boix and Stokes Reference Boix and Stokes2003; Lipset Reference Lipset1959; Przeworski et al. Reference Przeworski, Alvarez, Cheibub and Limongi2000) and the spatial and temporal clustering of democratization events (Ahlquist and Wibbels Reference Ahlquist and Wibbels2012; Brinks and Coppedge Reference Brinks and Coppedge2006; Gleditsch and Ward Reference Gleditsch and Ward2006; Houle, Kayser, and Xiang Reference Houle, Kayser and Xiang2016; Huntington Reference Huntington1993). Existing studies have treated these as distinct objects of inquiry, separately assessing the influence of domestic and international factors on the propensity to democratize. In this paper, we develop and estimate a model of elite belief formation that combines both domestic and systemic features in order to jointly explain the correlation between economic development and democracy and the clustering of democratic transitions.
We explicitly model the choice by incumbent elites to promote or subvert democracy.Footnote 1 This choice influences their likelihood of retaining power both directly and through its effect on economic growth. Incumbents are uncertain about the relationship between democracy and growth, and they rely upon worldwide economic history to update their beliefs. We allow beliefs to be spatially correlated so that incumbents may learn more from the experiences of more proximate (or similar) countries.Footnote 2 In accordance with their beliefs, incumbents pursue democracy or autocracy, seeking to maximize the probability they remain in power. For a panel of 151 countries, we use data from 1875–1950 to calibrate initial conditions and data from 1951–2000 to structurally estimate our model.Footnote 3
To assess the ability of our learning model to explain observed patterns of economic growth and democracy adoption, we conduct a series of goodness-of-fit and out-of-sample (2001–2010) prediction exercises that pit our model against a range of reduced-form panel regressions typical of the approach taken in the existing empirical literature on democratization (Acemoglu et al. Reference Acemoglu, Johnson, Robinson and Yared2008; Boix Reference Boix2011). We show that learning from past experiences is crucial to explaining observed transitions to and from democracy, delivering an improvement in predictive success of over 100% relative to the best-fitting specification that does not account for learning—even after allowing for other potential channels of diffusion.
The success of our learning model is rooted, first, in our estimates of the political implications of economic growth. In line with a sizable empirical literature in political economy, we find that democracies tend to reward incumbents for growth by keeping them in power (Alesina, Roubini, and Cohen Reference Alesina, Roubini and Cohen1997; Brender and Drazen Reference Brender and Drazen2008; Hibbs Reference Hibbs1977). In contrast, we find that growth tends to be destabilizing in autocracies. That is, our estimates are consistent with the view that rapid economic expansion in autocracies produces actors—a middle class, for example—able to challenge the group in power (Hirschman and Rothschild Reference Hirschman and Rothschild1973; Olson Reference Olson1963; Huntington Reference Huntington1968). Together, these results imply that the cross-sectional correlation between levels of material well-being and democracy is largely driven by elites who seek to benefit politically from the economic consequences of institutional choice. In particular, democratic incumbents will subvert democracy when they come to believe that it does not produce sufficient economic growth to win a fair election, whereas autocratic incumbents will transition to democracy when expected rates of growth make them more likely to retain power via election than under continued authoritarian rule.
Importantly, we distinguish transitions of power, where only the identity of the incumbent changes, from transitions into or out of democracy, where the form of government changes. Sudden changes in economic conditions, for instance, may lead to generalized political instability regardless of the system of government in place. However, whenever an incumbent is replaced—be it through election, coup, or revolution—the new group in power again faces the choice to support or subvert democracy. Our focus is on this choice, not transitions of power between factions.
The second feature of our learning model that underpins its empirical success is its ability to capture the wave-like nature of democratic transitions. We find that beliefs about the relationship between democracy and economic growth are highly correlated both temporally and spatially, which provides a structural interpretation for the observed clustering of transitions. Our estimates indicate there is an approximately 5,000-kilometer radius within which learning occurs. Outside this distance, virtually no additional information is gleaned. This advances the literature on the diffusion of democracy, which has struggled to disentangle competing mechanisms.Footnote 4
Our methodological approach allows us to conduct counterfactual experiments of three types, each of which highlights the importance of learning. First, it enables us to study how systemic shocks to prosperity affect the worldwide prospects for democracy. Specifically, our model predicts considerable reversals to authoritarianism if the world were hit with a shock to growth the size of the Great Depression. Second, it allows us to ask retrospective questions about historical democratization events, such as whether Greece, Portugal, and Spain would have democratized when they did had western European democracies suffered a recession in the early 1970s. Third, our model allows us to prospectively explore conditions that would presently lead countries to transition to or from democracy. Overall, our results suggest that, ultimately, democracy is a fragile system of government, one which depends significantly upon its own economic success.
Taken together, our findings contribute to a substantial body of work on modernization and democracy. Dating to at least the mid-twentieth century, social scientists have debated whether increases in per capita income have a causal effect on the probability that a state democratizes.Footnote 5 We bring to bear two innovations. First, we do not rely on the instrumental-variables or reduced-form selection-on-observables identification strategies deployed—with mixed results—in the existing literature. Rather, we propose an explicit model of the relationship between economic growth and democracy that we take directly to the data. Second, we approach modernization as a systemic phenomenon. Indeed, our results suggest that focusing on the within-country causal effect of economic development is too narrow an object of inquiry. Through its influence on neighbors’ beliefs, a country’s economic performance affects not only its own likelihood of transitioning to or from democracy but also the prospects for democracy outside of its borders.
Of course, we are not the first to propose diffusion through learning as a driver of democratic transitions (Dahl Reference Dahl1998; Diamond Reference Diamond2011; Miller Reference Miller2016). If direct and consistent measures of beliefs were available over a sufficiently long period and a wide enough set of countries, it would be conceivable to directly estimate the impact of changing beliefs on democratization.Footnote 6 Given the current lack of systematic or reliable data, our paper represents the first attempt at estimating this impact.
We are also not the first to examine the role of learning in policymaking more broadly (García-Jimeno Reference García-Jimeno2016; Primiceri Reference Primiceri2006). Our paper is most closely related to Buera, Monge-Naranjo, and Primiceri’s (Reference Buera, Monge-Naranjo and Primiceri2011) structural analysis of the effect of learning on the adoption of market-oriented (versus state-interventionist) policies. We build on their framework to model the worldwide evolution and diffusion of beliefs about the economic consequences of competing policies. Yet, while they consider the problem of a welfare-maximizing social planner, we take a political economy perspective and study institutional design as the outcome of self-interested choices by power-seeking elites—a natural next step in this line of inquiry.
A Learning Model of Democratization
Elites, Beliefs, and Learning
We consider the decision problem of the decisive group in power in country  $$ i $$ at time
 $$ t $$.Footnote 7 This decision-maker faces a choice between autocracy,
 $$ {D}_{i,t}=0 $$, and democracy,
 $$ {D}_{i,t}=1 $$. The incumbent’s objective is to retain power in period
 $$ t+1 $$. Let
 $$ {Y}_{i,t} $$ denote country
 $$ i $$’s per capita GDP in period
 $$ t $$, and let
 $$ {y}_{i,t}\equiv \log \left({Y}_{i,t}\right)-\log \left({Y}_{i,t-1}\right) $$ denote its growth rate. At the beginning of period
 $$ t $$, the incumbent solves
 $$ \underset{D_{i,t}\in \left\{0,1\right\}}{\max }{E}_{i,t-1}\left[\frac{\exp \left({\alpha}_i+{\theta}^{D={D}_{i,t}}{y}_{i,t}-{K}_{i,t}{D}_{i,t}\right)}{1+\exp \left({\alpha}_i+{\theta}^{D={D}_{i,t}}{y}_{i,t}-{K}_{i,t}{D}_{i,t}\right)}|{D}_{i,t}\right],$$
where the integrand represents the probability of remaining in power in period  $$ t+1 $$, and the expectation is taken with respect to
 $$ {y}_{i,t} $$, as explained below, conditional on the information available in country
 $$ i $$ at the conclusion of period
 $$ t-1 $$. The integrand is increasing in the index
 $$ {\alpha}_i+{\theta}^{D={D}_{i,t}}{y}_{i,t}-{K}_{i,t}{D}_{i,t} $$, where coefficient
 $$ {\alpha}_i $$ establishes a baseline for country
 $$ i $$, coefficients
 $$ {\theta}^{D=0} $$ and
 $$ {\theta}^{D=1} $$ respectively measure the (de)stabilizing effect of GDP growth on elite turnover under autocracy and democracy, and
 $$ {K}_{i,t} $$ captures the political cost of democracy to the incumbent—that is, its direct effect on the likelihood of retaining power.
The incumbent chooses  $$ {D}_{i,t} $$ at the start of period
 $$ t $$, forming a subjective forecast of its effect on GDP growth,
 $$ {y}_{i,t} $$, to solve (1).Footnote 8 Incumbents believe that the relationship between GDP growth and democracy takes the form
 $$ {\displaystyle \begin{array}{ccc}{y}_{i,t}=\left(1-{D}_{i,t}\right){\beta}_i^{D=0}+{D}_{i,t}{\beta}_i^{D=1}+{\epsilon}_{i,t},\end{array}} $$
where  $$ {\beta}_i^{D=0} $$ and
 $$ {\beta}_i^{D=1} $$ denote country
 $$ i $$’s long-run GDP growth rates under autocracy and democracy, respectively, and
 $$ {\epsilon}_{i,t} $$ is an exogenous shock to growth that is uncorrelated over time but potentially correlated across countries.Footnote 9 Specifically, the vector
 $$ {\epsilon}_t\equiv {\left[{\epsilon}_{1,t},\dots, {\epsilon}_{n,t}\right]}^{\prime } $$ of GDP growth shocks across the
 $$ n $$ countries of the world is independently and identically distributed (i.i.d.) over time according to a mean-zero Normal distribution with covariance matrix
 $$ \Sigma $$, i.e.,
 $$ {\epsilon}_t\overset{\mathrm{i}.\mathrm{i}.\mathrm{d}.}{\sim }N\left(0,\Sigma \right). $$
Incumbents do not know  $$ {\beta}_i\equiv {\left[{\beta}_i^{D=0},,,{\beta}_i^{D=1}\right]}^{\prime } $$, but they have perfect knowledge of all other features of the model, including
 $$ {K}_{i,t} $$, at the time of their choice.Footnote 10
The timing of events is as follows. At the end of period  $$ t-1 $$, incumbents collect data on worldwide GDP growth rates and systems of government, and they update their beliefs about long-run economic growth under autocracy and democracy accordingly. At the beginning of period
 $$ t $$, incumbents observe
 $$ {K}_{i,t} $$ and decide what system of government,
 $$ {D}_{i,t} $$, to adopt that period. Growth rates conditional on incumbents’ choices are then realized, which together determine elite turnover.
Learning
In period  $$ t=0 $$, incumbents start out with a Normal prior over the vector of unknown long-run GDP growth rates
 $$ \beta \equiv {\left[{\beta}_1^{D=0},\dots, {\beta}_n^{D=0},{\beta}_1^{D=1},\dots, {\beta}_n^{D=1}\right]}^{\prime } $$,
 $$ {\displaystyle \begin{array}{ccc}\beta \sim N\left({\bar {\;\beta}}_0,,,{P}_0^{-1}\right),\end{array}} $$
where  $$ {\bar {\;\beta}}_0 $$ and P 0 denote, respectively, the prior mean and precision matrix. We assume that incumbents’ initial beliefs assign no correlation and the same degree of uncertainty to growth under autocracy and democracy:
 $$ {P}_0^{-1}={I}_2\otimes (VRV), $$
where  $$ V=\operatorname{diag}\left(\left[{v}_1{\sigma}_1,\dots, {v}_n{\sigma}_n\right]\right) $$ is a diagonal matrix whose
 $$ i $$th diagonal entry measures prior uncertainty (standard deviation) about country
 $$ i $$’s long-run growth rate under autocracy/democracy, and
 $$ R $$ is the cross-country prior correlation matrix. Prior uncertainty is parameterized by
 $$ {\left\{{v}_i\right\}}_{i=1}^n $$, normalized by the standard deviation of growth shocks in each country
 $$ {\left\{{\sigma}_i\right\}}_{i=1}^n $$ (the square roots of the diagonal elements of
 $$ \Sigma $$).
Our assumptions yield simple, recursive, Bayesian updating formulas for beliefs in each period: letting  $$ {D}_t\equiv {\left[{D}_{1,t},\dots, {D}_{n,t}\right]}^{\prime } $$ and
 $$ {y}_t\equiv {\left[{y}_{1,t},\dots, {y}_{n,t}\right]}^{\prime } $$,
 $$ {\displaystyle \begin{array}{cccc}& {P}_t={P}_{t-1}+{\mathbf{D}}_t^{\prime }{\Sigma}^{-1}{\mathbf{D}}_t,& & \\ {}& {\bar {\;\beta}}_t={\bar {\;\beta}}_{t-1}+{P}_t^{-1}{\mathbf{D}}_t^{\prime }{\Sigma}^{-1}\left({y}_t-{\mathbf{D}}_t{\bar {\;\beta}}_{t-1}\right),& & \end{array}} $$
where  $$ {\mathbf{D}}_t\equiv \left[\operatorname{diag}\left(1-{D}_t\right),\operatorname{diag}\left({D}_t\right)\right] $$ is an
 $$ n\times (2n) $$ matrix such that the
 $$ i $$th element of the vector
 $$ {\mathbf{D}}_t{\bar {\;\beta}}_{t-1} $$ equals
 $$ \left(1-{D}_{i,t}\right){\bar {\;\beta}}_{i,t-1}^{D=0}+{D}_{i,t}{\bar {\;\beta}}_{i,t-1}^{D=1} $$. The impact of new data on the posterior mean
 $$ {\bar{\beta}}_t $$ is determined by
 $$ {P}_t^{-1}{\mathbf{D}}_t^{\prime }{\Sigma}^{-1} $$, which depends on three key factors. First, higher initial uncertainty in beliefs (higher
 $$ {\left\{{v}_i\right\}}_{i=1}^n $$) raises the relative precision of new information, increasing its impact. Second, higher correlation in growth shocks across countries (off-diagonal elements of
 $$ \Sigma $$) reduces the informational content of observed growth rates and slows down learning. Lastly, higher cross-country correlation in initial beliefs (off-diagonal elements of
 $$ R $$) increases belief responsiveness to data from other countries.
We allow incumbents to potentially learn more from neighboring (or more similar) countries. Letting  $$ {Z}_{i,j} $$ denote a vector that may include various measures of distance (geographic or otherwise) between countries
 $$ i $$ and
 $$ j $$, we write
 $$ {R}_{i,j}=\exp \left(-{Z}_{i,j}^{\prime}\gamma \right), $$
where  $$ \gamma $$ is constrained to be nonnegative to ensure correlations between 0 and 1.Footnote 11
Incumbents’ Optimal Choice
While incumbents observe the political cost of democracy,  $$ {K}_{i,t} $$, prior to choosing
 $$ {D}_{i,t} $$, this cost is unobservable to the researcher. We assume that
 $$ {K}_{i,t} $$ has the following structure:
 $$ {\displaystyle \begin{array}{ccc}{K}_{i,t}={f}_i+{X}_{i,t}^{\prime}\xi +{\kappa}_{i,t}.\end{array}} $$
Coefficient fi establishes a country-specific baseline, and the control vector Xi,t may include various observable economic and political characteristics of country i (e.g., lagged per capita GDP or incumbents’ time in power). Every period, country i also experiences an exogenous idiosyncratic shock,  $$ {\kappa}_{i,t} $$, to the political cost of democracy, where
 $$ {\kappa}_{i,t}\sim N\left(0,{\varsigma}_i^2\right). $$
The volatility of shocks to the political cost of democracy,  $$ {\varsigma}_i $$, is allowed to be country-specific, but
 $$ {\kappa}_{i,t} $$ is assumed to be independently distributed over time and across countries.
As discussed, when choosing  $$ {D}_{i,t} $$ incumbents have perfect knowledge of
 $$ {K}_{i,t} $$ and all features of the model except for the effect of their choice on GDP growth,
 $$ {y}_{i,t} $$. Together, (1), (2), and (4) imply that the optimal choice for country
 $$ i $$’s incumbent at time
 $$ t $$ is
 $$ {\displaystyle \begin{array}{cc}\begin{array}{cc}{D}_{i,t}=1\left\{{E}_{i,t-1}\left[\frac{\exp \left({\alpha}_i+{\theta}^{D=1}\left({\beta}_i^{D=1}+{\epsilon}_{i,t}\right)-{f}_i-{X}_{i,t}^{\prime}\xi -{\kappa}_{i,t}\right)}{1+\exp \left({\alpha}_i+{\theta}^{D=1}\left({\beta}_i^{D=1}+{\epsilon}_{i,t}\right)-{f}_i-{X}_{i,t}^{\prime}\xi -{\kappa}_{i,t}\right)}\right]\right.& \\ {}\left.>{E}_{i,t-1}\left[\frac{\exp \left({\alpha}_i+{\theta}^{D=0}\left({\beta}_i^{D=0}+{\epsilon}_{i,t}\right)\right)}{1+\exp \left({\alpha}_i+{\theta}^{D=0}\left({\beta}_i^{D=0}+{\epsilon}_{i,t}\right)\right)}\right]\right\}, \end{array}& \end{array}} $$
where the expectations are taken only with respect to  $$ {\beta}_i $$ and
 $$ {\epsilon}_{i,t} $$ in accordance with the incumbent’s beliefs at the conclusion of period
 $$ t-1 $$.
Opposition Groups and Strategic Experimentation
To conclude the description of our model, we briefly discuss how we account for non-elite learning and strategic interactions between incumbents and potential challengers.
The common prior assumption for incumbents in our model extends to all stakeholders in each country. Opposition groups (elite or non-elite) observe the same worldwide history of economic growth and democracy, and they would be faced with solving (1)—in the event they came to power—using information identical to that available to the incumbent. As a result, in this shared-learning environment, the identity of the incumbent only matters via its potential influence on the political cost of democracy.
For tractability, we abstract from explicitly modeling the intricacies of within-country elite turnover. However, objective (1) can be viewed as describing an equilibrium probability of staying in power resulting from a richer interaction between the incumbent and potential challengers, both elite and non-elite. Importantly, we distinguish transitions of power, where only the identity of the incumbent changes, from transitions into or out of democracy. Whenever an incumbent is overthrown by a rival elite faction or via a revolution from below, the new group in power again faces the choice to support or subvert democracy.Footnote 12 Understanding how this choice by self-interested elites—newly in power or entrenched—is shaped by the evolution of beliefs about the economic effects of democracy is the focus of this paper.Footnote 13
Finally, objective (1) precludes incumbents from adopting a form of government with negative expected consequences for the purpose of learning from the experience. Incumbents are myopic and focused only on their immediate survival. Nevertheless, while we do not explore a fully dynamic version of our model, as it would introduce strategic experimentation incentives that would render the analysis intractable (Bolton and Harris Reference Bolton and Harris1999; Bramoulleé, Kranton, and D’Amours Reference Bramoulleé, Kranton and D’Amours2014; Mossel, Sly, and Tamuz Reference Mossel, Sly and Tamuz2015), we believe objective (1) offers a good first-order approximation to optimal behavior by incumbents with longer time horizons.Footnote 14
Empirical Strategy
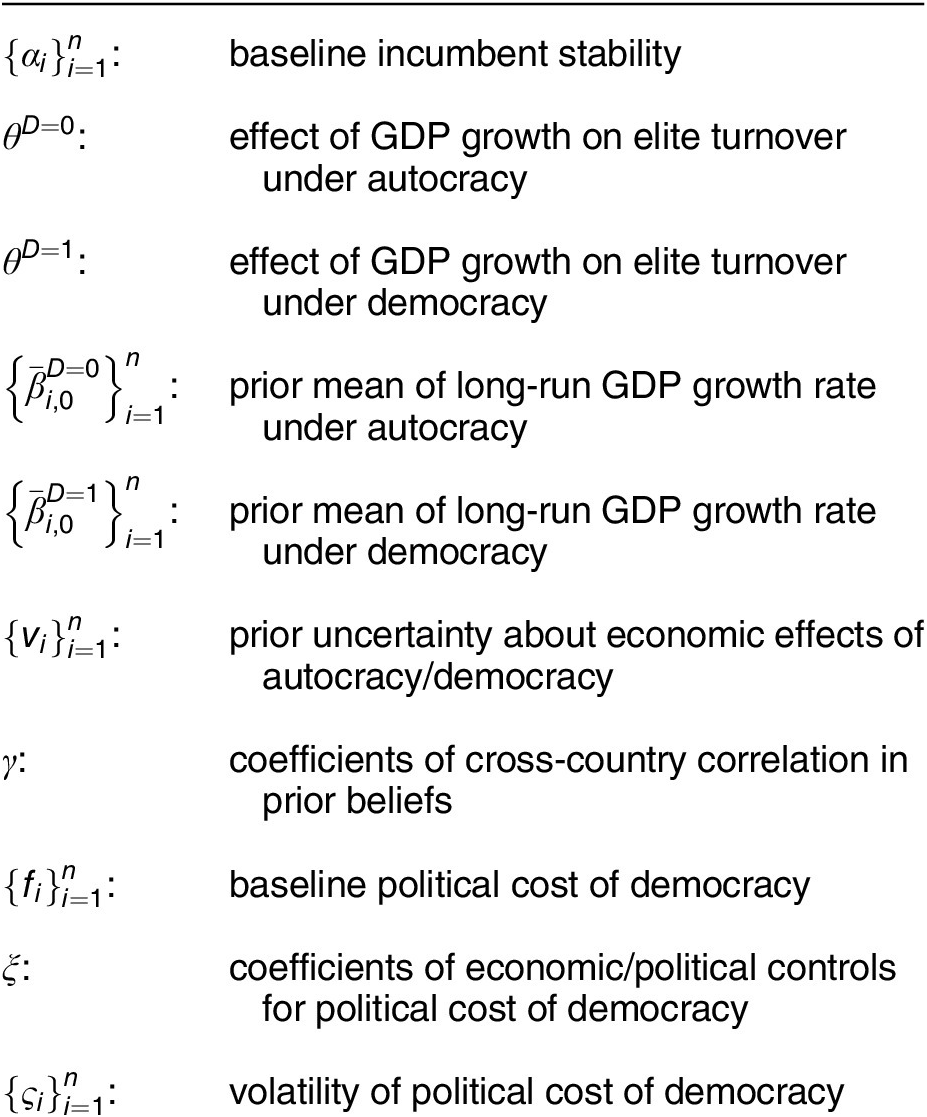
Like incumbents in our model, we adopt a Bayesian inference approach to recover the unknown structural parameters of our model, listed in Table 1.Footnote 15 Let the vector  $$ \varphi $$ collect all the parameters in Table 1, and let
 $$ {I}_{i,t} $$ be an indicator of whether the incumbent in country
 $$ i $$ retained power (
 $$ {I}_{i,t}=1 $$ ) or not (
 $$ {I}_{i,t}=0 $$ ) at the conclusion of period
 $$ t $$. Denote by
 $$ {W}^T\equiv {\left\{{I}_t,{y}_t,{D}_t,{X}_t\right\}}_{t=1}^T $$ the set of all data available up to period
 $$ T $$, where
 $$ {I}_t\equiv {\left[{I}_{1,t}\dots, {I}_{n,t}\right]}^{\prime } $$ and
 $$ {X}_t\equiv {\left[{X}_{1,t}\dots, {X}_{n,t}\right]}^{\prime } $$. Our goal is to estimate the true value of
 $$ \varphi $$ by computing the mode of the posterior distribution of the model parameters,
 $$ p\left(\varphi |{W}^T\right)\kern0.5em \propto \kern0.5em \mathbf{\mathcal{L}}\left({W}^T|\varphi \right)\pi \left(\varphi \right), $$
given the likelihood of the data,  $$ \mathbf{\mathcal{L}} $$, and our prior,
 $$ \pi $$. We describe
 $$ \mathbf{\mathcal{L}} $$ and
 $$ \pi $$ in turn.
Model Parameters

Likelihood of the Data
While the structure of our model described thus far specifies incumbents’ beliefs about how the data are generated as well as their optimal choices given those beliefs, we have refrained from specifying the “true” data generating process (DGP). Below, to perform counterfactual experiments, we discuss and specify the true DGP. Next, we only make one key assumption about the true DGP that simplifies inference about the model parameters.
We assume that observed outcomes are only affected by actual choices and not by the beliefs that led to those choices. That is, transitions of power ( $$ {I}_t $$), GDP growth (
 $$ {y}_t $$), and other economic and political characteristics of countries (
 $$ {X}_t $$) are shaped by realized institutions (
 $$ {D}_t $$), but they are not directly affected by beliefs about the potential effects of transitioning into or out of democracy. Formally, this assumption implies that the parameters in Table 1 are only involved in the component of the likelihood that describes the conditional probabilities of countries’ observed systems of government. While we relegate a full derivation of the likelihood to Online Appendix A3, with a slight abuse of notation—using
 $$ \mathbf{\mathcal{L}} $$ to denote arbitrary densities of the data—it can be written as
 $$ \mathbf{\mathcal{L}}\left({W}^T|\varphi \right)\kern.5em \propto {\Pi}_{t=1}^T{\Pi}_{i=1}^n\mathbf{\mathcal{L}}\left({D}_{i,t}|{X}_{i,t},{W}^{t-1},\varphi \right), $$
where
 $$ {\displaystyle \begin{array}{ccc}\mathbf{\mathcal{L}}\left({D}_{i,t}|{X}_{i,t},{W}^{t-1},\varphi \right)=\Phi {\left(\frac{{\overline{\kappa}}_{i,t}\left({X}_{i,t},{W}^{t-1},\varphi \right)}{\varsigma_i}\right)}^{D_{i,t}}{\left[1-\Phi \left(\frac{{\overline{\kappa}}_{i,t}\left({X}_{i,t},{W}^{t-1},\varphi \right)}{\varsigma_i}\right)\right]}^{1-{D}_{i,t}},\end{array}} $$
 $$ \Phi $$ denotes the standard Normal cumulative distribution function, and
 $$ {\overline{\kappa}}_{i,t}\left({X}_{i,t},{W}^{t-1},\varphi \right) $$ is the threshold value of
 $$ {\kappa}_{i,t} $$—the realized shock in period
 $$ t $$ to the political cost of democracy in country
 $$ i $$—that leaves country
 $$ i $$’s incumbent indifferent between autocracy and democracy. Note that (6) resembles the likelihood of a standard binary-choice Probit model. However,
 $$ {\overline{\kappa}}_{i,t}\left({X}_{i,t},{W}^{t-1},\varphi \right) $$ is a nonlinear function (with no closed-from expression) of the model parameters and the data up to period
 $$ t $$ that encodes how each country’s propensity for democracy evolves with incumbents’ beliefs.
Prior
Given the size of our model, we adopt an informative prior,  $$ \pi $$, to prevent overfitting. To do so in a principled manner, we calibrate our prior in the way agents in our model would, allowing the observed past to inform initial beliefs. We use data from 1875–1950 (excluding the two world wars), a period that immediately precedes our main sample, to set the prior mean and precision of the model parameters so as to match analogous empirical moments. For example, we ensure that our prior over incumbents’ initial beliefs about the relationship between democracy and GDP growth is consistent with average annual growth rates among autocracies and democracies in the presample period. Similarly, we use presample history of elite turnover to inform our prior over the parameters describing the likelihood of retaining power. We describe our prior in full and how it is calibrated in Online Appendix A4.
Estimation and Inference
Calculating  $$ {\overline{\kappa}}_{i,t}\left({X}_{i,t},{W}^{t-1},\varphi \right) $$ to evaluate the likelihood of the data is computationally quite expensive. To sidestep this burden, we follow the Mathematical Programming with Equilibrium Constraints (MPEC) approach of Su and Judd (Reference Su and Judd2012) to compute our maximum-a-posteriori estimator of
 $$ \varphi $$.Footnote 16 The idea behind this approach is simple: instead of calculating
 $$ {\overline{\kappa}}_{i,t}\left({X}_{i,t},{W}^{t-1},\varphi \right) $$ at every trial value of
 $$ \varphi $$, one treats each
 $$ {\overline{\kappa}}_{i,t} $$ as an auxiliary parameter and imposes the optimality (or equilibrium) conditions of the model as feasibility constraints on the log-posterior maximization program. This considerably reduces the computational cost of estimating the model. We describe our estimation strategy in detail in Online Appendix A5.
Data
For our main analysis, we obtain data from three sources, each measured at the country-year. First, we obtain data on GDP & Per Capita GDP from Maddison (Reference Maddison2010). The Maddison Project Database provides information on comparative economic growth and income levels over the very long run. The data give estimates of annual GDP and GDP per capita between 1875–2008 for all of the independent states in our sample of countries.Footnote 17 We obtain two additional years (2009 and 2010) of GDP per capita growth rates from the Penn World Table (Feenstra, Inklaar, and Timmer Reference Feenstra, Inklaar and Timmer2015) for out-of-sample predictions.
Second, we obtain our dichotomous measure of Democracy from Boix, Miller, and Rosato (Reference Boix, Miller and Rosato2013; BMR). This dataset provides an annual coding of democracy for every country in the world from 1800 to 2010. If the following three criteria are met, countries are coded as democratic:
1. The executive is directly or indirectly elected in popular elections and is responsible either directly to voters or to a legislature.
2. The legislature (or the executive if elected directly) is chosen in free and fair elections.
3. A majority of adult men has the right to vote.
If any of these criteria are not met, a country is coded as autocratic. While various alternative measures of democracy have been used in previous studies, the BMR coding is the most comprehensive and consistent for the period we cover (1875–2010). Nonetheless, our results are robust to employing alternative codings (see Online Appendix A7).
Finally, for each country-year, we code the Executive Faction from Goemans, Gleditsch, and Chiozza (Reference Goemans, Gleditsch and Chiozza2009). The Archigos database on leaders describes the date and manner of entry and exit for the executives of all countries in our sample from 1875–2015. With these data, we then code, using biographical information, the political party of each executive. If we cannot identify a political party (nearly all of these cases are military regimes), we identify the particular faction to which the executive belongs. In combination with the entry/exit dates, we construct our measure of change in the faction of the executive (elite turnover).
Estimation Results: The Importance of Learning
Before summarizing our structural parameter estimates, we subject our model to a series of goodness-of-fit and out-of-sample prediction tests that assess its ability to explain observed patterns of democracy adoption. We consider five alternative specifications of our model that differ in the number of covariates used to characterize the political cost of democracy. In our baseline specification with no covariates, the political cost of democracy,  $$ {K}_{i,t} $$, consists of simply a country-specific baseline,
 $$ {f}_i $$, plus an idiosyncratic shock,
 $$ {\kappa}_{i,t} $$. We then consider specifications where we successively control for (lagged) log-GDP per capita, the incumbent’s time in power, (lagged) trade volume as a percentage of GDP (Gleditsch Reference Gleditsch2002), and years as democratic (negative when autocratic) to account for consolidation effects (Svolik Reference Svolik2013).Footnote 18 Across specifications, we use geographic distance between capitals,
 $$ {Z}_{i,j} $$, to capture the cross-country correlation in initial beliefs.Footnote 19
To quantify the importance of learning for our model’s ability to fit the data, we also estimate a “no-learning” version of our model. For each specification, we constrain beliefs about long-run growth rates under autocracy and democracy to be constant over time, thus shutting down the learning mechanism. These no-learning specifications are otherwise identical to their learning counterparts.
We conduct our model performance tests as follows. With each estimated model, we compute one-year-ahead forecasts of the choice between autocracy and democracy for each country-year. That is, conditional on the state of the world at the end of year  $$ t-1 $$ as recorded in our data, we use (5) for each model to predict
 $$ {D}_{i,t} $$ worldwide. We produce forecasts for the in-sample period used to estimate each model (1951–2000) and for 10 additional out-of-sample years (2001–2010).
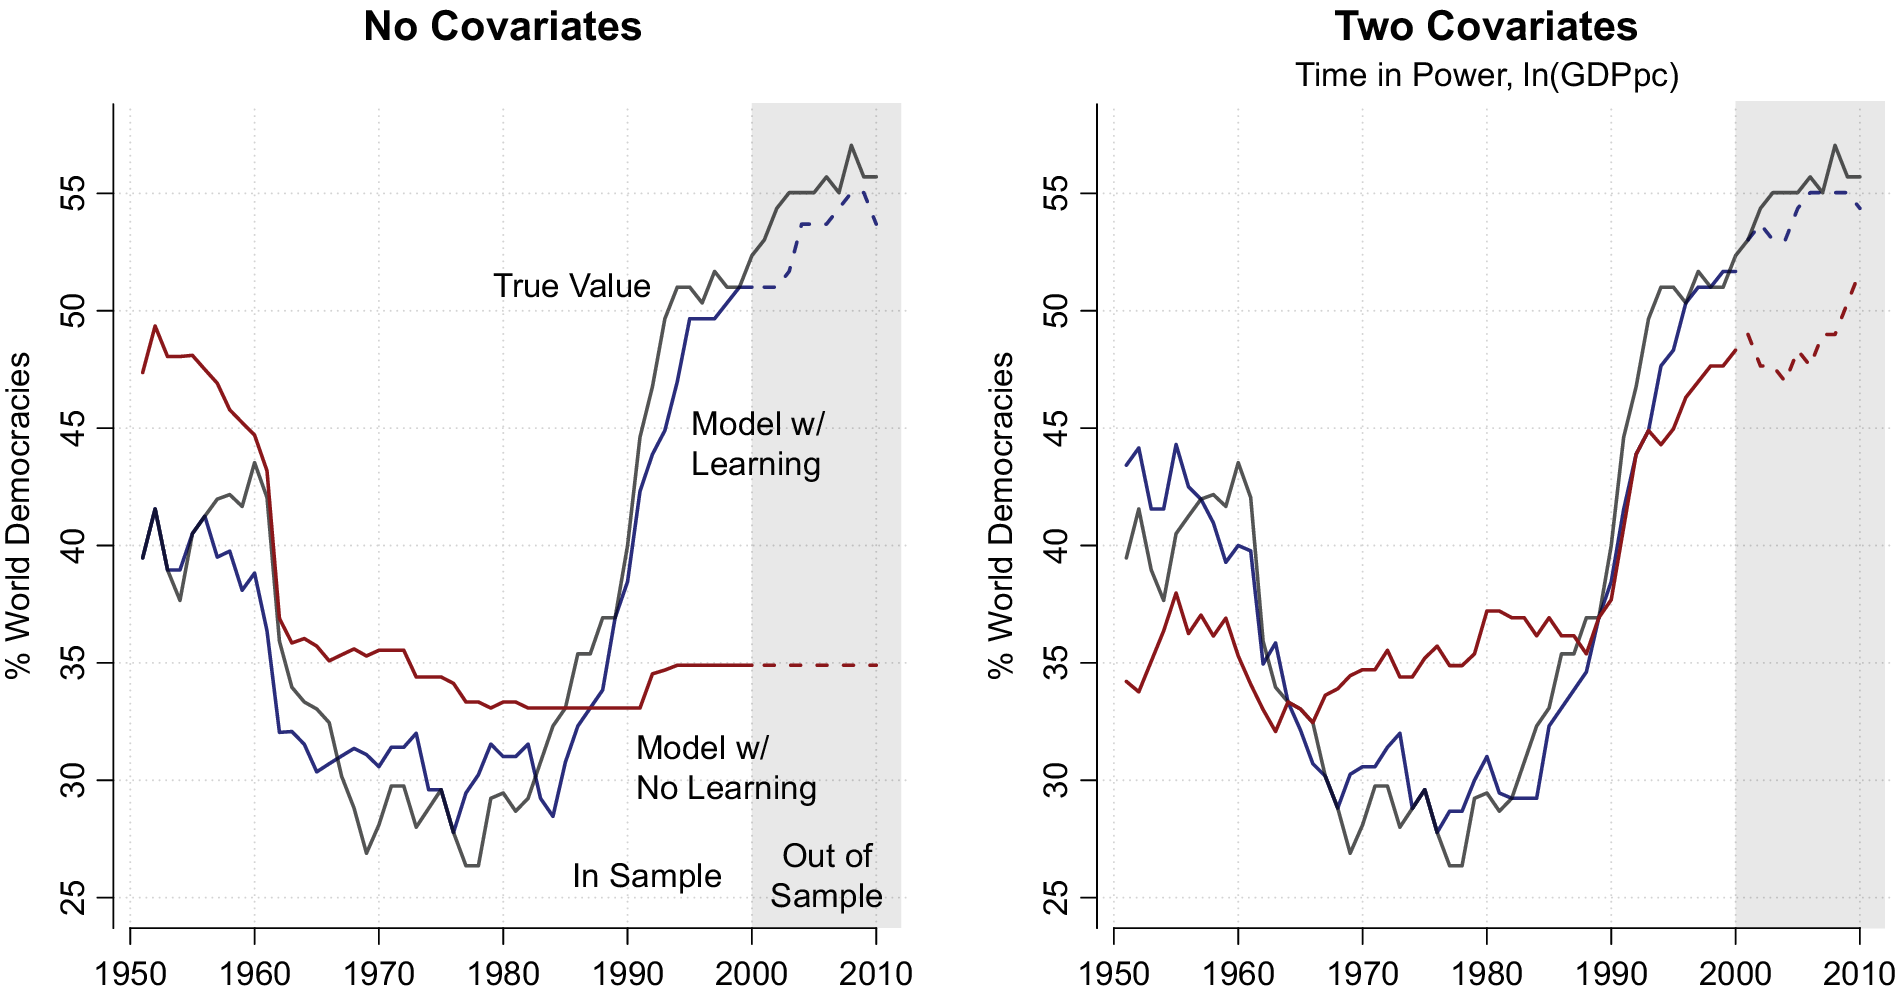
In Figure 1, we plot the actual (gray) and predicted percentage of world democracies. In the top panel, predictions are generated using our baseline specification with no covariates. We plot predictions with (blue) and without (red) learning for both the in-sample (solid) and out-of-sample (dashed) periods. In the lower panel, we present the same set of estimates using our model with two covariates (lagged log-GDP per capita and time in power).
Observed versus Predicted Worldwide Prevalence of Democracy

Note the vast improvement in predictive success, both in and out of sample, when we account for learning. Unsurprisingly, the no-learning specification of our model with no covariates performs worst as it produces a constant prediction for each country.Footnote 20 However, while the inclusion of covariates does markedly improve the accuracy of the no-learning model, these gains pale in comparison with the role of learning. Indeed, our baseline learning model with no covariates vastly outperforms any specification that does not account for learning. As many of the covariates we condition upon are themselves outcomes of the selection process we model (e.g., per capita GDP or elite turnover), their inclusion should not yield much improvement in predictive success. Our results confirm this intuition.Footnote 21
Table 2 provides a numerical summary of our goodness-of-fit tests. Each set of columns corresponds to a different model specification, with (odd columns) and without (even columns) learning. The first row gives the percentage of country-year observations each model correctly predicts. Unsurprisingly, all models perform remarkably well on this dimension. The reason is that, as transitions into or out of democracy are quite rare (130 total in-sample events), country fixed effects go a long way in fitting the data. Indeed, our no-learning model with no covariates (second column), which produces a constant prediction for each country, has a success rate of almost 90%.
Model Fit

Note: This table reports various goodness-of-fit measures. Each set of columns corresponds to a different specification of our model, with (odd columns) and without (even columns) learning. Models in the first two columns use only country fixed effects to characterize the political cost of democracy. Models in the third and fourth columns control for lagged log-GDP per capita. Models in the fifth and sixth columns additionally control for incumbents’ time in power. Models in the seventh and eighth columns also control for trade volume as a percentage of lagged GDP. Models in the last two columns add years as democratic (negative when autocratic) as a control. For each model, we report the percentage of correctly predicted in-sample system of government choices (first row). We similarly report the percentage of correctly predicted transitions to or from democracy within a zero-year window (second row) and a five-year window (third row) of the event.
A much harder test—one that is considerably more revealing of the underlying causes of democracy—is whether a model can correctly predict transitions to and from democracy. In Table 2, we present two scenarios, assessing each model’s accuracy in predicting transitions within  $$ \pm 0 $$ years (second row) and
 $$ \pm 2 $$ years (third row) of the event. Here, the importance of learning is striking. Models that do not account for learning perform quite poorly, even within a five-year window.Footnote 22 And, while including additional covariates does increase accuracy, the marginal improvement is negligible. In contrast, turning on the learning mechanism in our model raises predictive success by over 100% in virtually all scenarios and all specifications. In fact, our baseline learning model with no covariates outperforms most no-learning specifications by a similar rate.Footnote 23
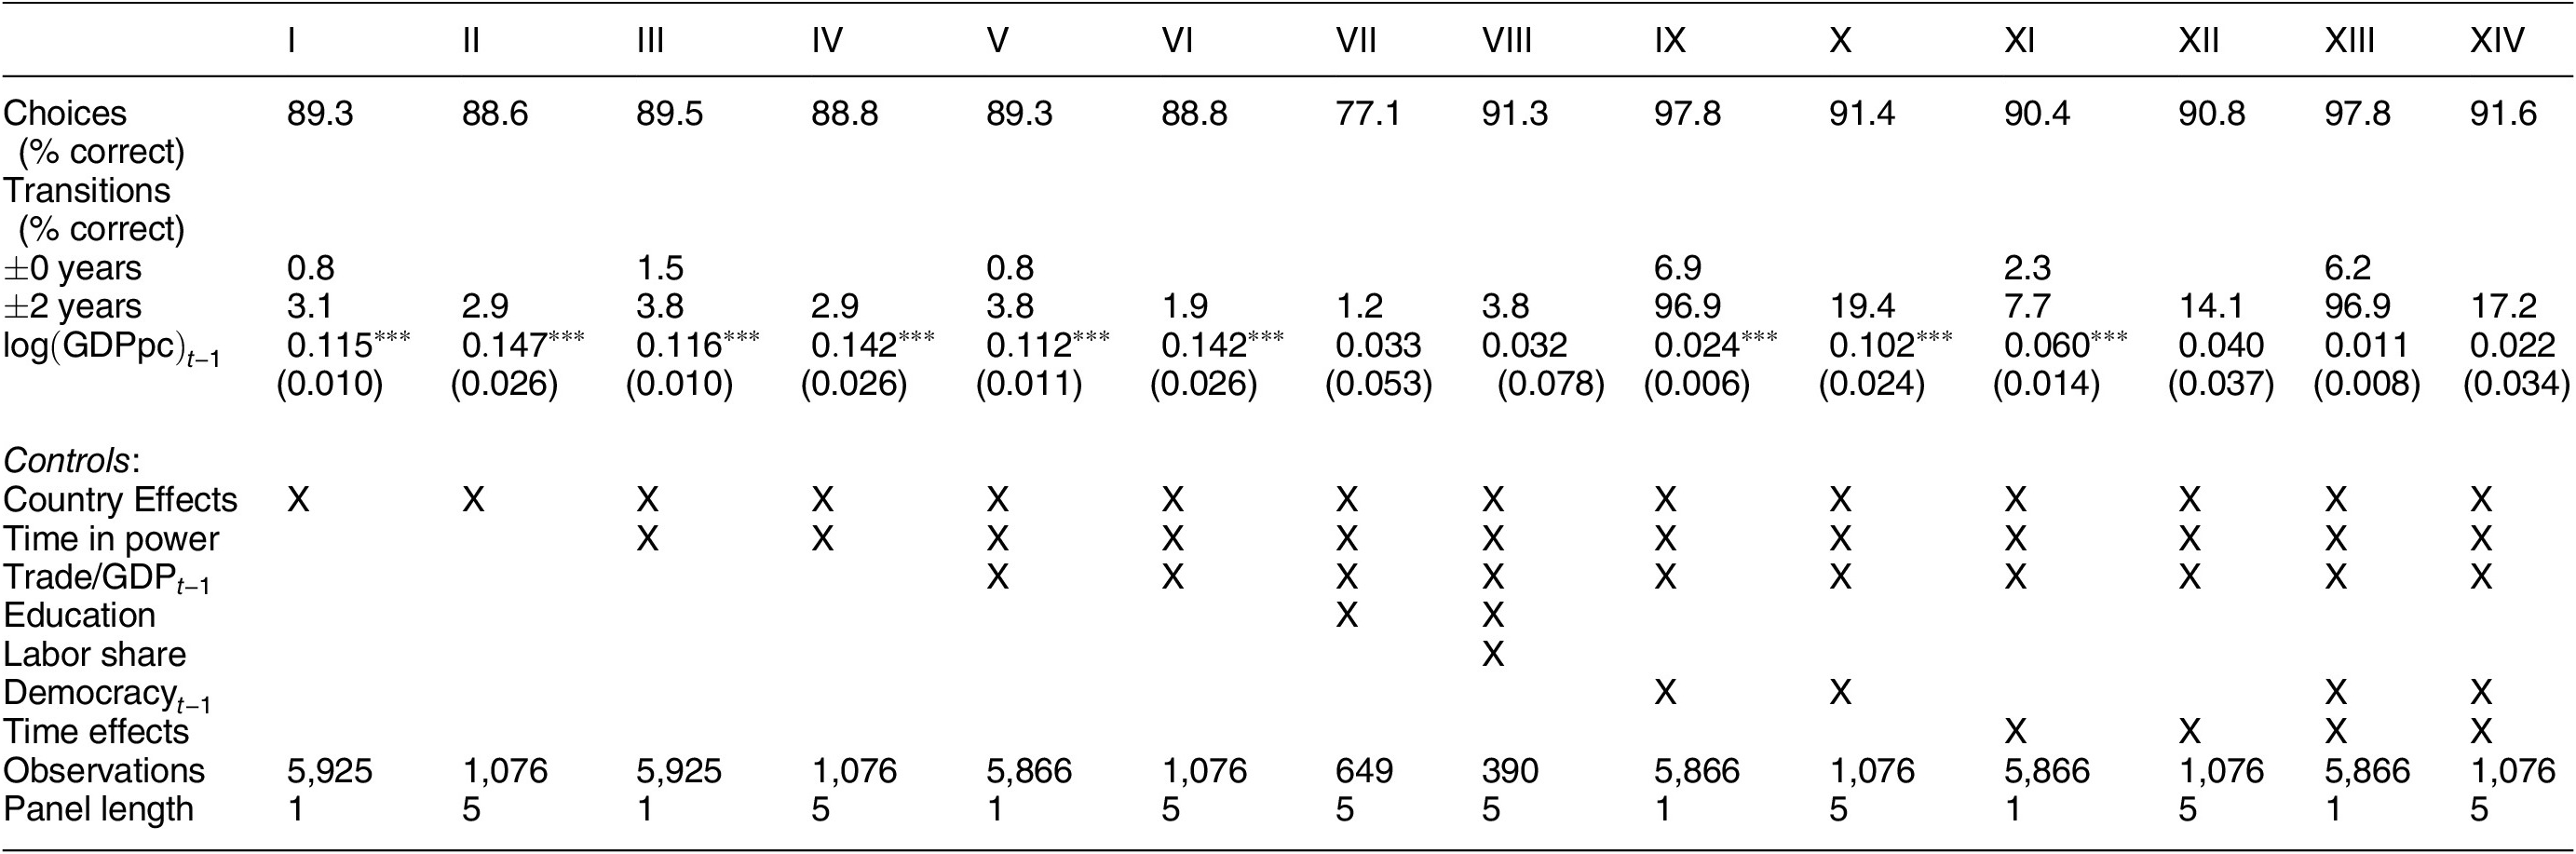
To further benchmark our model, we present in Table 3 results from a series of panel regressions typical of the approach taken in the existing empirical literature on democratization. Using linear probability models, we regress our democracy measure against a full set of country fixed effects, a one-period lag of log-GDP per capita, and various controls. We exploit both annual data and, as in Acemoglu et al. (Reference Acemoglu, Johnson, Robinson and Yared2008, Reference Acemoglu, Johnson, Robinson and Yared2009) and Boix (Reference Boix2011), five-year panels, which allow for the inclusion of covariates not available annually.Footnote 24 As before, with each specification we produce predictions for every country-period.
Goodness of Fit of Reduced-Form Models

Note: This table gives linear probability estimates of the effect of (lagged) log-GDP per capita on democracy. All models include country fixed effects. We successively add in controls for the incumbent’s time in power, trade as a percentage of (lagged) GDP, average years of schooling from Barro (Reference Barro1999), and labor share of value added from Rodrik (Reference Rodrik1999). In columns XI–XIV, we include year fixed effects. In columns IX, X, XIII, and XIV, we include a one-period lag of democracy. We present estimates with annual and five-year panels. The first row gives the percentage of country-period observations correctly predicted by each model. For models with annual data, we also report their success rate at predicting transitions within ± 0 (second row) and ± 2 (third row) years of the event. For the five-year panels, we produce success rates at predicting transtions just within the five-year window (third row). *p < 0.1, **p < 0.05, ***p < 0.01.
Again, as with our model, it is trivial to correctly predict close to 90% of country-period observations using country fixed effects. The important departure arises when we compare predictions of transitions derived from these reduced-form regressions with those generated by our learning model. Once more, we evaluate these predictions in exact ( $$ \pm 0 $$ years) and five-year windows (
 $$ \pm 2 $$).
In terms of exact predictions, no reduced-form specification surpasses the predictive success of our baseline no-covariates learning model. In the five-year window, our model performs similarly well, save annual panel specifications with a lagged dependent variable, which correctly predict over 90% of transitions. However, aggregated over five years, the inclusion of the one-year lagged outcome leads any transition not picked up exactly by the model to be mechanically transformed into a correct prediction in subsequent years, thus yielding an extremely high success rate in the five-year window despite a low success rate within a single year. To further see this, note that, when we introduce a one-period lag in the five-year panel specifications, they successfully predict less than 20% of transitions, a rate which our model beats by more than 100%. More importantly, our model provides a structural interpretation for the observed persistence of systems of government that underpins the predictive success of these autoregressive specifications.Footnote 25
Of course, it may be the case that, rather than reflecting the learning process we describe, our model’s success is simply an artifact of some alternative process of democratic diffusion that is indirectly picked up by our model’s spatial and temporal flexibility. Examples of potential mechanisms proposed in the literature include direct emulation of neighbors (Gleditsch and Ward Reference Gleditsch and Ward2006), cultural linkages (Wejnert Reference Wejnert2005), and diffusion through trade (Mansfield, Milner, and Rosendorff Reference Mansfield, Milner and Rosendorff2000). Due to data limitations, direct tests of each of these mechanisms would be impractical. Nonetheless, in the context of our model, the channel by which these alternative explanations could influence democratic transitions is through their impact on the political cost of democracy. To evaluate this possibility, we construct a distance-weighted measure of how democratic each country’s neighborhood is over time, and we reestimate our baseline model using this measure as a control for direct diffusion effects. In Online Appendix A7, we find minimal increase in predictive success relative to our baseline model, which indicates that it is our proposed mechanism of learning about the economic effects of democracy—and not some alternative process of diffusion—what drives our results.
In sum, our goodness-of-fit tests quantify and highlight the crucial role of learning in explaining the dynamics of worldwide democracy adoption, overshadowing the usefulness of other explanatory variables typically employed in the literature. As discussed, this is not surprising given that many of these controls are themselves outcomes of the learning process we model. In light of these results, we hereafter focus our attention on the baseline no-covariates specification of our learning model.
Structural Parameter Estimates
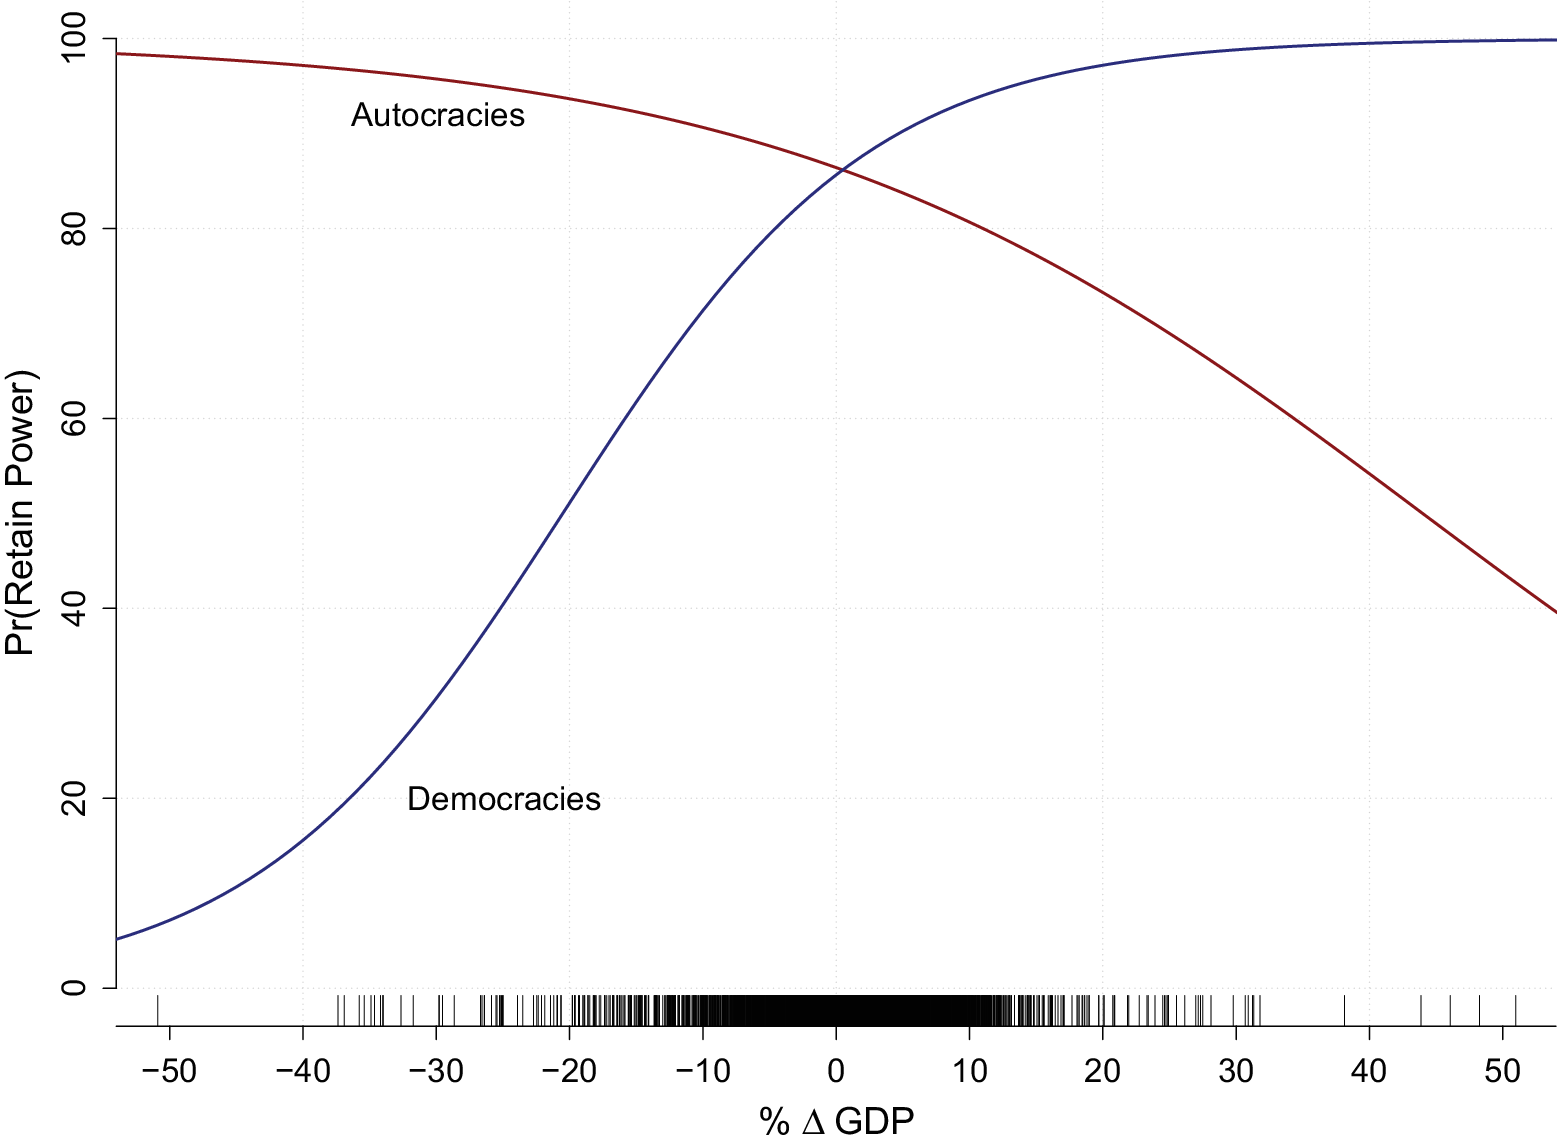
To understand how our model is fitting the data, we summarize our main parameter estimates and discuss their substantive implications.Footnote 26 We begin with our estimates of the (de)stabilizing effect of GDP growth on elite turnover under autocracy and democracy. This question, itself, has been a separate subject of academic inquiry for decades.Footnote 27 We find that the impact of growth on the likelihood that the incumbent group retains power indeed differs across autocracies and democracies.Footnote 28 The quantitative implications of our estimates are summarized in Figure 2, which plots the estimated probability (averaged across countries) that the incumbent remains in power at different rates of GDP growth. In blue, we plot our estimates under democracy and, in red, our estimates under autocracy.
(De)Stabilizing Effect of GDP Growth on Elite Turnover

In line with a substantial empirical literature in political economy, we find that, in democracies, economic growth is stabilizing for elites.Footnote 29 In other words, the party in government is more likely to win reelection when growth is high. In contrast, we find that growth is destabilizing in autocracies. This result comports with the view that rapid economic expansion in non-democracies creates inequalities of expectation or inequalities of outcomes that, in turn, engender attempts to subvert the political system (Huntington Reference Huntington1968; Hirschman and Rothschild Reference Hirschman and Rothschild1973; Olson Reference Olson1963). That is, autocrats are less likely to remain in power when economic growth produces actors—a middle class, for example—able to place demands upon and challenge the authority of the group in power.
Coupling these results with learning helps explain the observed cross-sectional correlation between democracy and per capita GDP. Democracy becomes more appealing to incumbents as they come to believe that it is conducive to high rates of GDP growth. Conversely, autocracy entails an incentive to suppress economic growth.
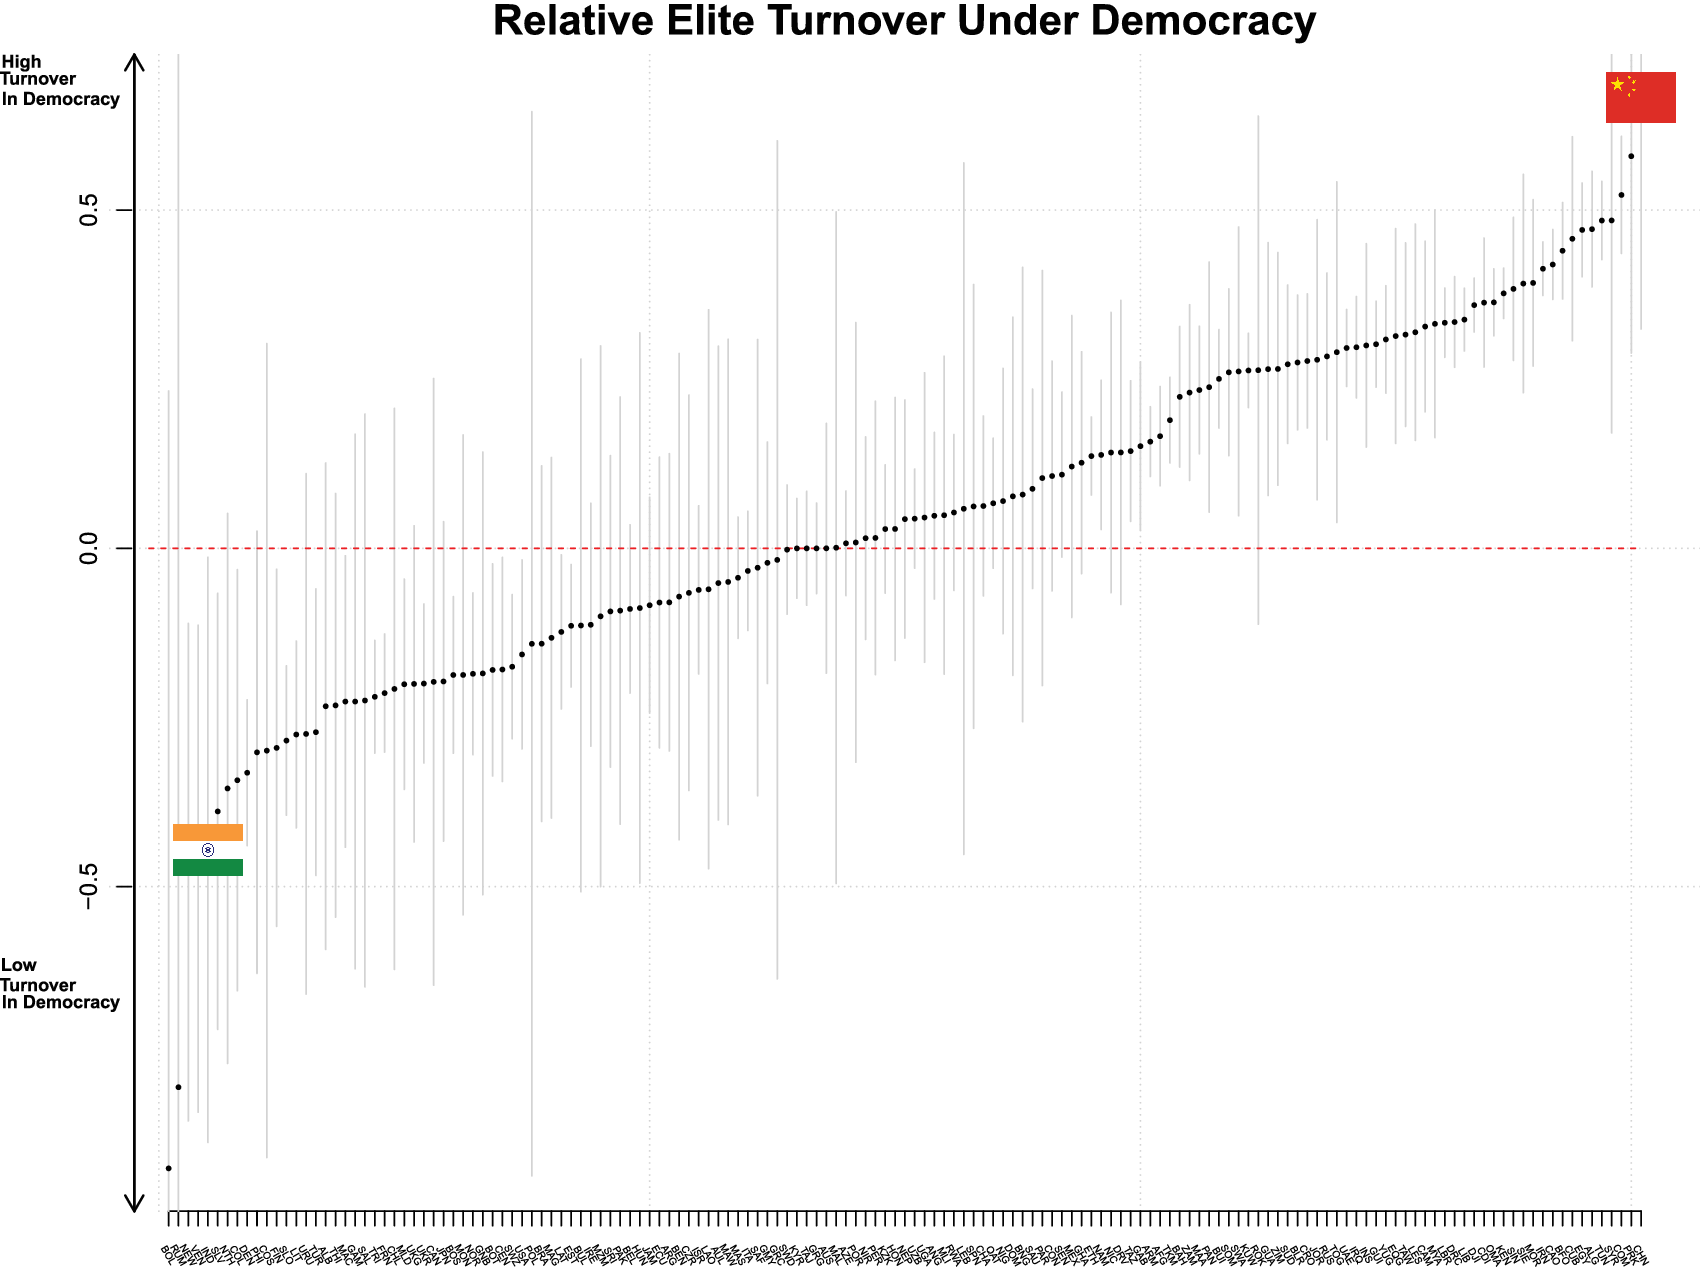
Of course, there are notable exceptions. For example, over the past two decades China has experienced high rates of growth and nevertheless remained autocratic. Similarly, India for the first four decades of its independence experienced low rates of growth and yet remained democratic. Underlying these prominent cases is the country-specific political cost of democracy. We recover estimates of the structural parameters describing the baseline political cost of democracy for each country,  $$ {f}_i $$, and plot them in Figure 3. Notably, the Chinese Communist party faces, all else equal, the lowest probability of remaining in power under democracy. In contrast, Congress at India’s independence had the fourth-highest ex-ante probability of retaining power under democracy.
Political Cost of Democracy

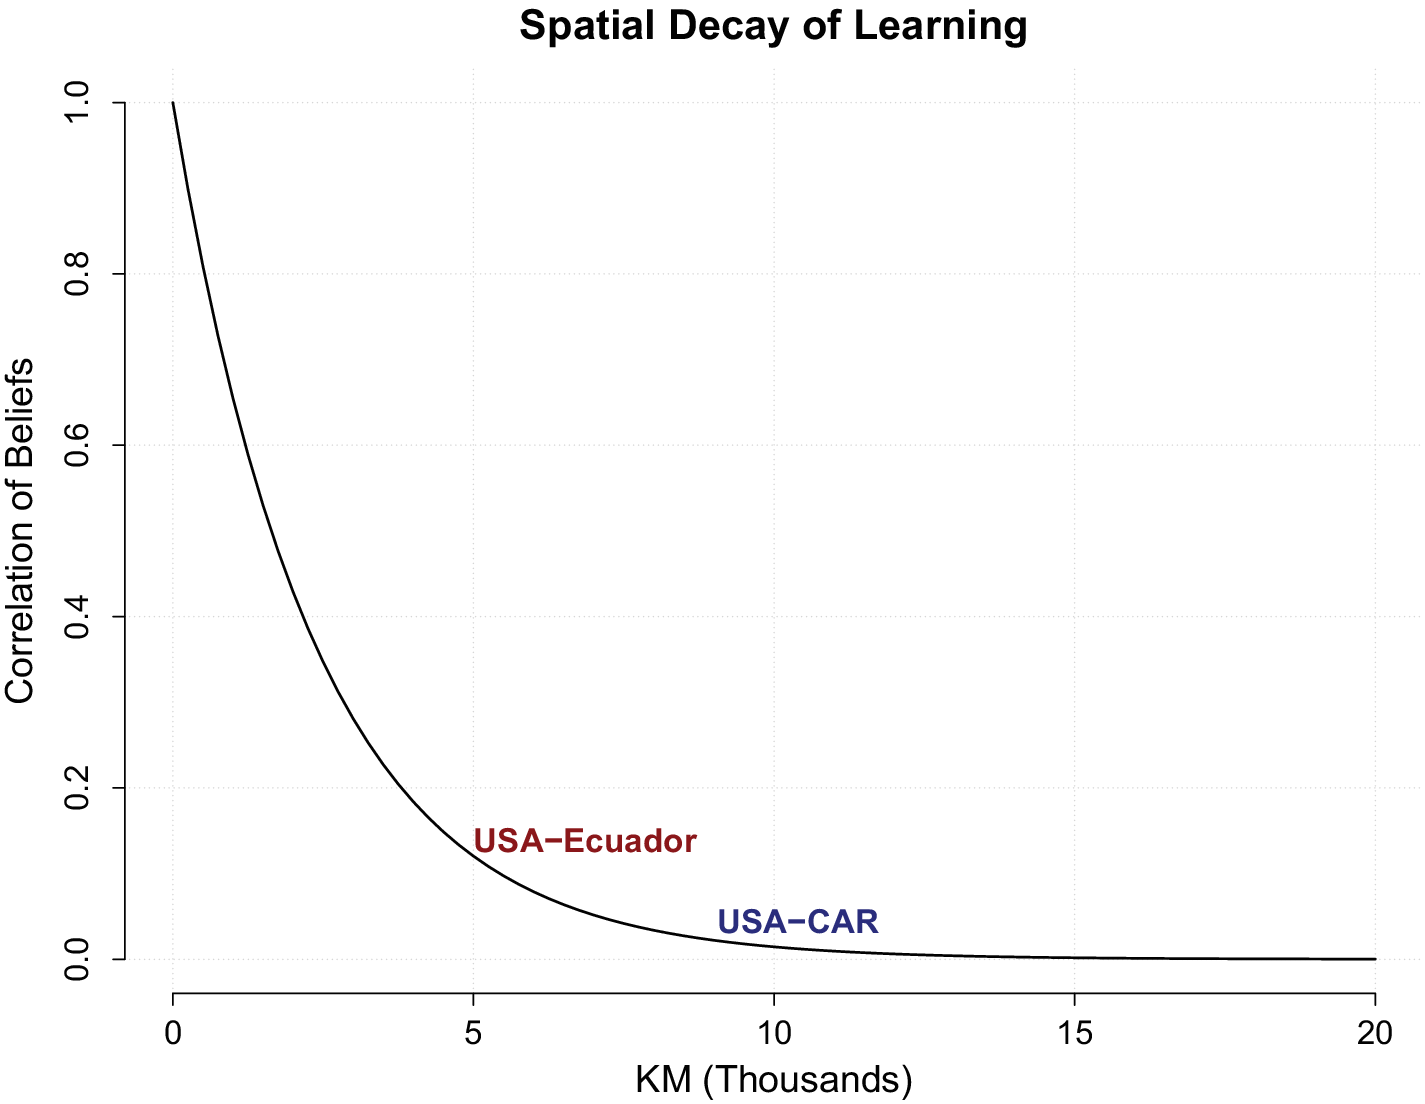
Next, in Figure 4, we present estimates of the spatial decay of learning—that is, the extent to which the cross-country correlation in prior beliefs depends on the geographic distance between capitals.Footnote 30 Consistent with the observed spatial clustering of democratization events noted in the literature, we find that learning is highly circumscribed geographically. As shown in Figure 4, at 5,000 km (the approximate distance between the United States and Ecuador), the prior correlation of beliefs is only 0.12. At 10,000 km (the distance between the United States and the Central African Republic), the potential for learning between countries is virtually absent. This estimated feature of our model reveals that elites learn from the experiences of relatively proximate countries, and it underpins the ability of our model to capture the spatial clustering of transitions to and from democracy.
Cross-Country Correlation in Prior Beliefs

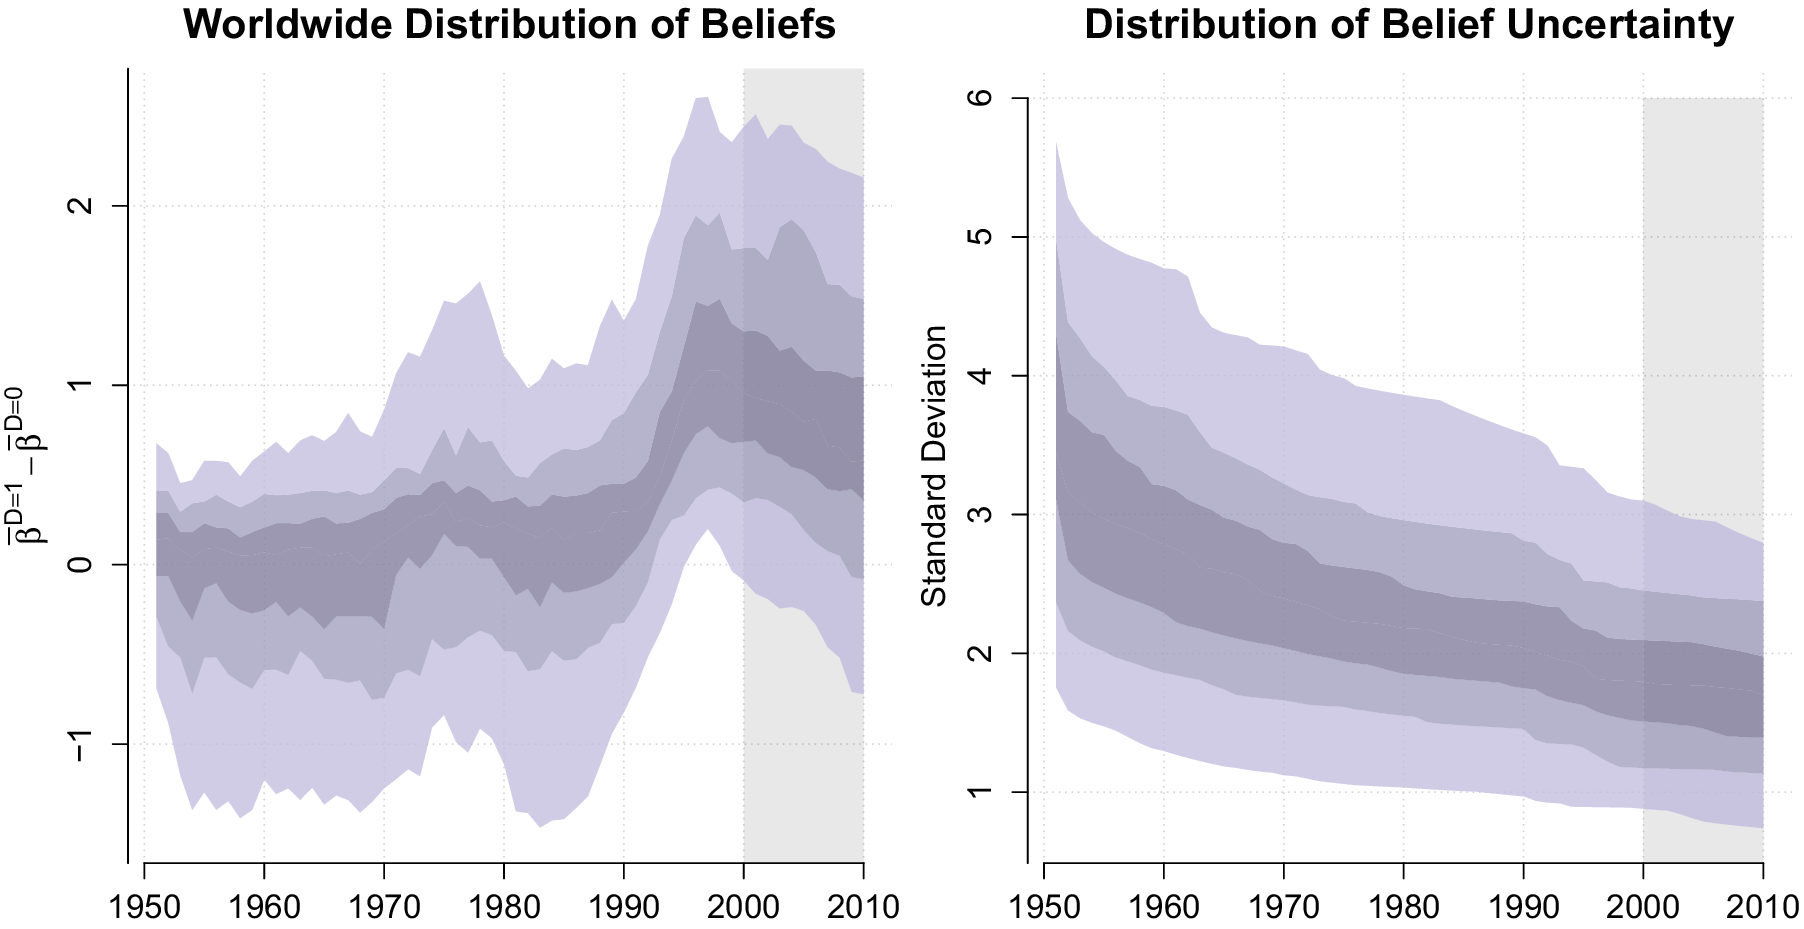
Finally, to understand the dynamics of democracy adoption, Figure 5 presents our estimates of the evolution of beliefs about the economic effects of democracy. The top panel plots the evolution of the worldwide distribution of the mean of beliefs about  $$ {\beta}_i^{D=1}-{\beta}_i^{D=0} $$, the difference in long-run GDP growth rates under democracy versus autocracy. The bottom panel shows the evolution of worldwide uncertainty (standard deviation) about these beliefs. The initial state of beliefs in 1951 simply reflects our prior-calibration exercise. In the presample period (1875–1950), democracies grew, on average, about 0.4 percentage points faster than autocracies. The median of mean initial beliefs in the top panel of the figure is consistent with this statistic.
Worldwide Beliefs about Economic Effects of Democracy

While estimated beliefs remain relatively flat for the first three decades of the in-sample period, in the 1980s and, even more dramatically, in the 1990s there is a sharp expansion of beliefs in favor of democracy’s superior potential to foster economic growth. This divergence in beliefs reflects an increasingly large gap between autocracies and democracies in observed economic performance. Between 1951 and 1979, little new information was revealed about the relative ability of democracy to generate growth: on average over this period, autocracies grew just 0.37 percentage points slower than democracies, roughly identical to the observed difference in the presample period. By contrast, between 1980 and 2000, democracies produced, on average, 1.54 percentage points higher annual growth than autocracies.
This widening gap in economic performance—accelerating through the 1980s—reached a peak in 1987, when democracies outgrew autocracies by 3.3 percentage points. The resulting discrepancy in observed growth rates from countries’ prior expectations led them to progressively update their beliefs. Together with our estimates of the (de)stabilizing effects of GDP growth on elite turnover, this change in worldwide beliefs helps explain our model’s ability to correctly predict the striking rise in the percentage of world democracies observed in the same period (Figure 1).Footnote 31
This process operated through changes in both the mean and precision of beliefs. After the oil crisis, as democracies came to outperform autocracies, this induced countries to revise their estimates of democracy’s superior economic potential, which encouraged transitions to democracy. As the first set of countries transitioned, democracy became less rare worldwide, reducing belief uncertainty about its relative economic merits. This helped solidify the growing consensus, leading to further democratization. The result was the cascade in beliefs between the 1980s and mid-1990s shown in Figure 5 and, ultimately, the wave of democratization that followed over the same period.
Counterfactuals
Our model allows us to explore counterfactual experiments of three types. First, it enables us to understand how systemic shocks to prosperity affect the worldwide prospects for democracy. Second, it allows us to ask retrospective questions about historical democratization events. Third, our model allows us to prospectively explore conditions that would lead current elites to transition to or from democracy. We present results of each type in turn.
To conduct these experiments, it is necessary to specify and estimate the “true” data generating process. A considerable advantage of using our baseline no-covariates model to generate these counterfactuals is that only an estimate of the true relationship between GDP growth and democracy is required. Following Buera, Monge-Naranjo, and Primiceri (Reference Buera, Monge-Naranjo and Primiceri2011), we assume that this relationship is described by a hierarchical linear model similar to (2), which we estimate using all available data between 1875 and 2000 (excluding the two world wars).Footnote 32 This specification is appealing for its flexibility and because it is consistent with our model of learning in that elites with beliefs (2) and prior (3) would eventually learn the truth over time.
A Second Great Depression
In the year before the market crash of 1929, 51% of the world’s independent states were democracies. A year later this proportion dropped to just over 43%. By 1935, the fraction of countries that remained democratic decreased by another 5%, reaching a low of 36% by 1938. In Europe, democratic backsliding was even starker. At its theretofore high in 1920, twenty-six out of twenty-eight European states were democratic, but by 1938 thirteen of these countries had transitioned away from democracy.
A substantial body of both historical and quantitative research has linked the global decline of democracy in the inter-war period directly to the economic downturn of the Great Depression (de Bromhead, Eichengreen, and O’Rourke Reference de Bromhead, Eichengreen and O’Rourke2013; Frey and Weck Reference Frey and Weck1983). Likewise, both in academic and popular discourse, the global economic recession of 2008 has been put forward as a contributing factor in the observed wave of recent democratic breakdowns (Armingeon and Guthmann Reference Armingeon and Guthmann2014; Bartels Reference Bartels2013). Next, we provide evidence that systemic economic crises indeed engender reversals to autocracy and, moreover, highlight how this is driven by changes in beliefs about the economic effects of democracy.
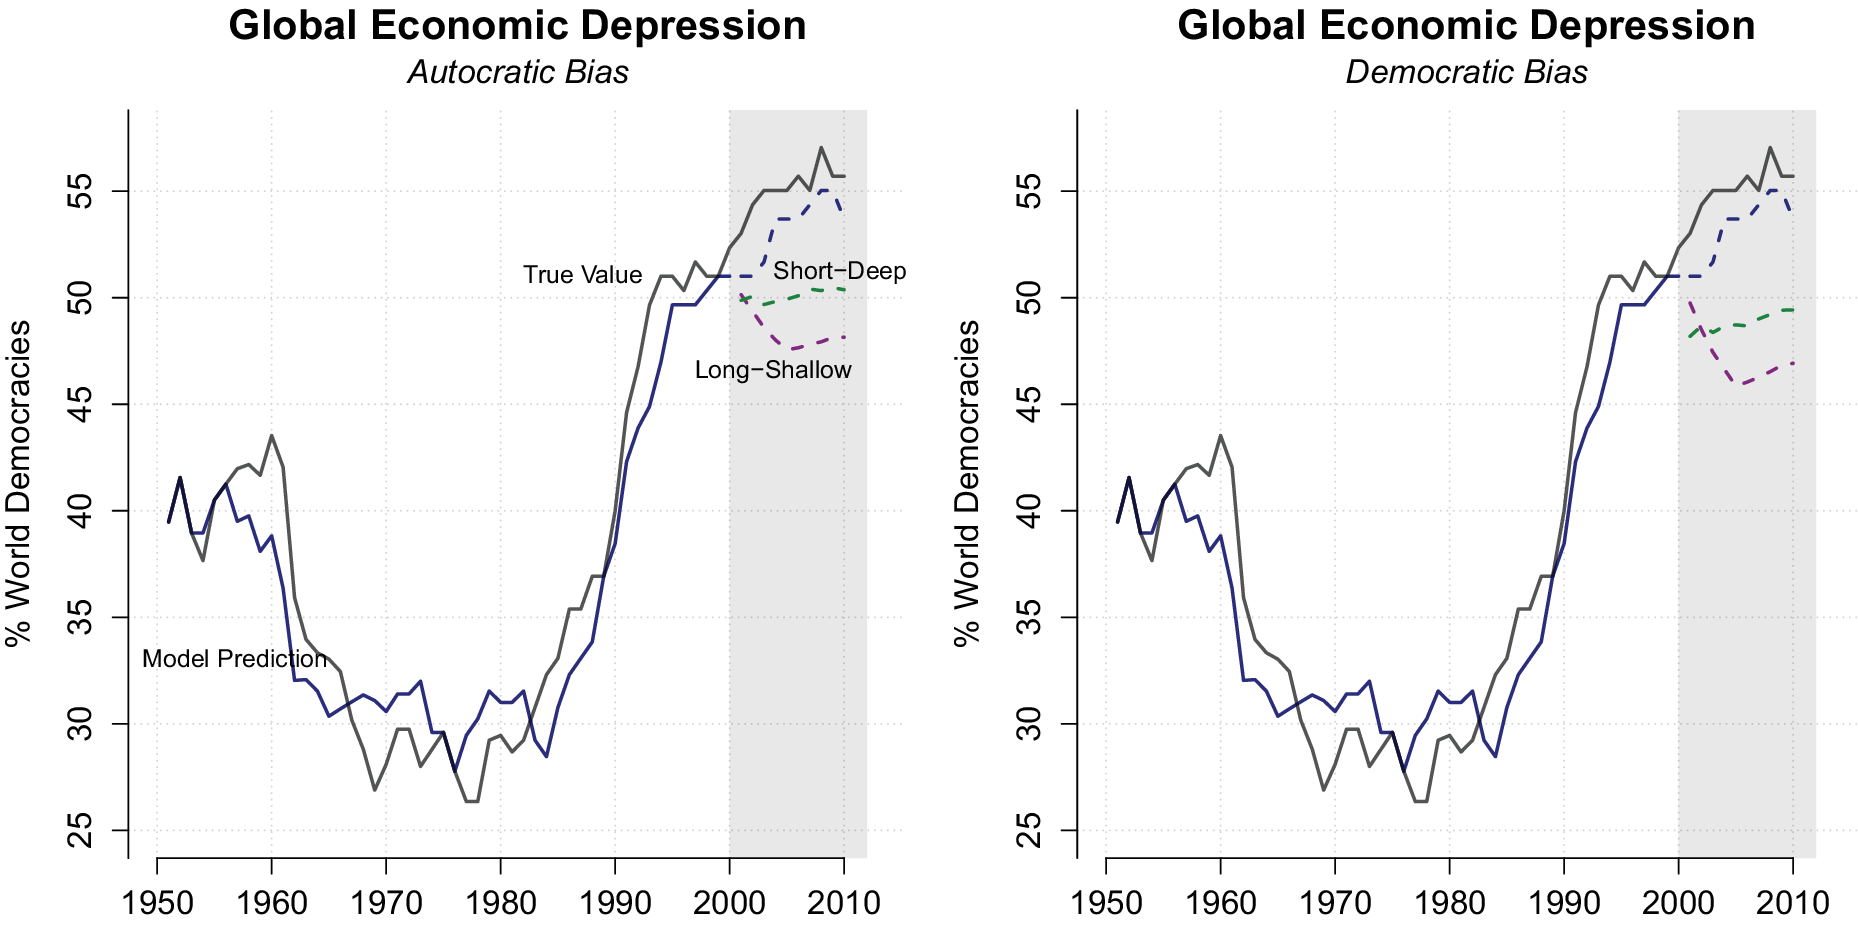
To that end, we simulate two sorts of crises. First, we generate a “short-deep” counterfactual crisis where, for our last in-sample year (2000), we simulate a 5.9% average worldwide contraction of per capita GDP, comparable to the worst year of the Great Depression (1931). In our second crisis, we construct a “long-shallow” counterfactual condition where we perturb growth by a smaller amount—1.7% annually (the average contraction between 1929 and 1933)—but extend this contraction over a five-year period (2000–2004). We present results where we concentrate these counterfactual conditions in autocratic and democratic countries, respectively. Under the “autocratic-bias” condition, recessions are twice as deep in autocracies as in democracies, while keeping the worldwide average contraction consistent with our intervention. Conversely, under the “democratic-bias” condition, recessions are twice as deep in democracies.
Model estimates of the worldwide percentage of democracies are shown in Figure 6. In the left-hand panel, we present estimates from the autocratic-bias condition and, in the right-hand panel, estimates from the democratic-bias condition. In both plots, the short-deep counterfactual is shown in green, and the long-shallow counterfactual is shown in purple. Note that both the short-deep and long-shallow counterfactual crises negatively affect the worldwide prevalence of democracy. While the large single-period decline in growth has a larger effect in the first year, thereafter the proportion of democracies begins to recover. In comparison, the smaller but longer crisis has a larger overall impact, with the proportion of democracies continuing to decline through the duration of the economic contraction and then recovering more slowly.
Second Great Depression Counterfactuals

Both patterns are consistent with our actors learning about the economic merits of democracy. In both counterfactuals, the initial shock forces agents to revise their beliefs. However, in the long-shallow counterfactual, as would be expected from a continued process of learning, our agents update their beliefs following each additional negative perturbation of worldwide growth and continue to select out of democracy accordingly. In contrast, in the short-deep scenario, we observe a single large drop in the percentage of democracies. Since after the initial shock to growth there is no “new” information revealed to our agents, the worldwide percentage of democracies starts to recover. Importantly, comparing effects across the two bias conditions, it is clear that the reduction in world democracies is larger when the economic contraction is concentrated among democracies. This is consistent with the evolution of beliefs prior to our intervention, as discussed above. When democracies perform poorly, counter to the prevailing consensus, elites sharply revise their beliefs and select out of democracy.
The Third Wave
A number of studies highlight the influence of external actors on the prospects for democracy (Pevehouse Reference Pevehouse2005). Especially for the early “third-wave” democratization events in Greece, Portugal, and Spain, the potential for accession to the European Community (EC) has been put forward as a crucial determinant of their respective transitions (Whitehead Reference Whitehead1996). Brussels’ requirement that community members maintain a form of government consistent with liberal democracy, coupled with the economic benefits of access to the common market, generated an incentive to democratize. In this section, we show that, rather than serving as an institutional target, much of the impact the EC had upon third-wave democratization operated through its constituent states’ economic performance, which affected beliefs about the economic benefits of democracy in potential member states.
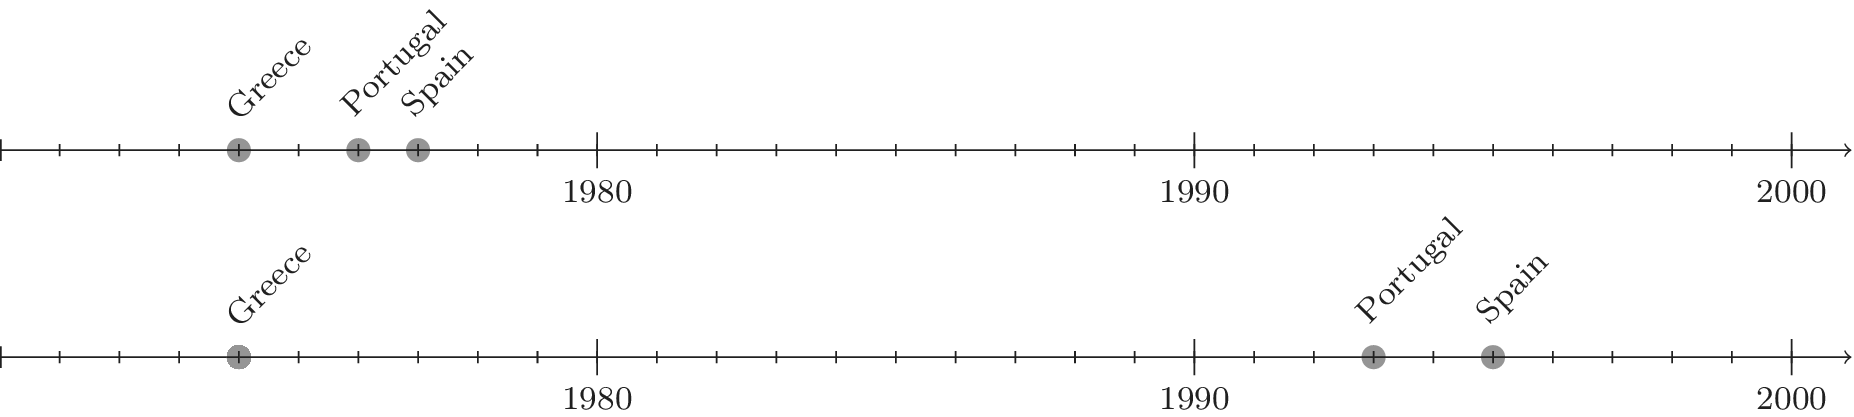
To show this, we construct a counterfactual wherein we generate a recession in the EC’s three largest economies, Britain, France, and Germany, of 2% average annual contraction for the two years preceding the first transition of Greece in 1974.Footnote 33 Then, to obtain an estimate of this counterfactual recession’s impact on the transitions of Greece, Portugal, and Spain, we compare our predicted transitions in this counterfactual world with the truth. Our results are given in Figure 7.
Counterfactual Third Wave

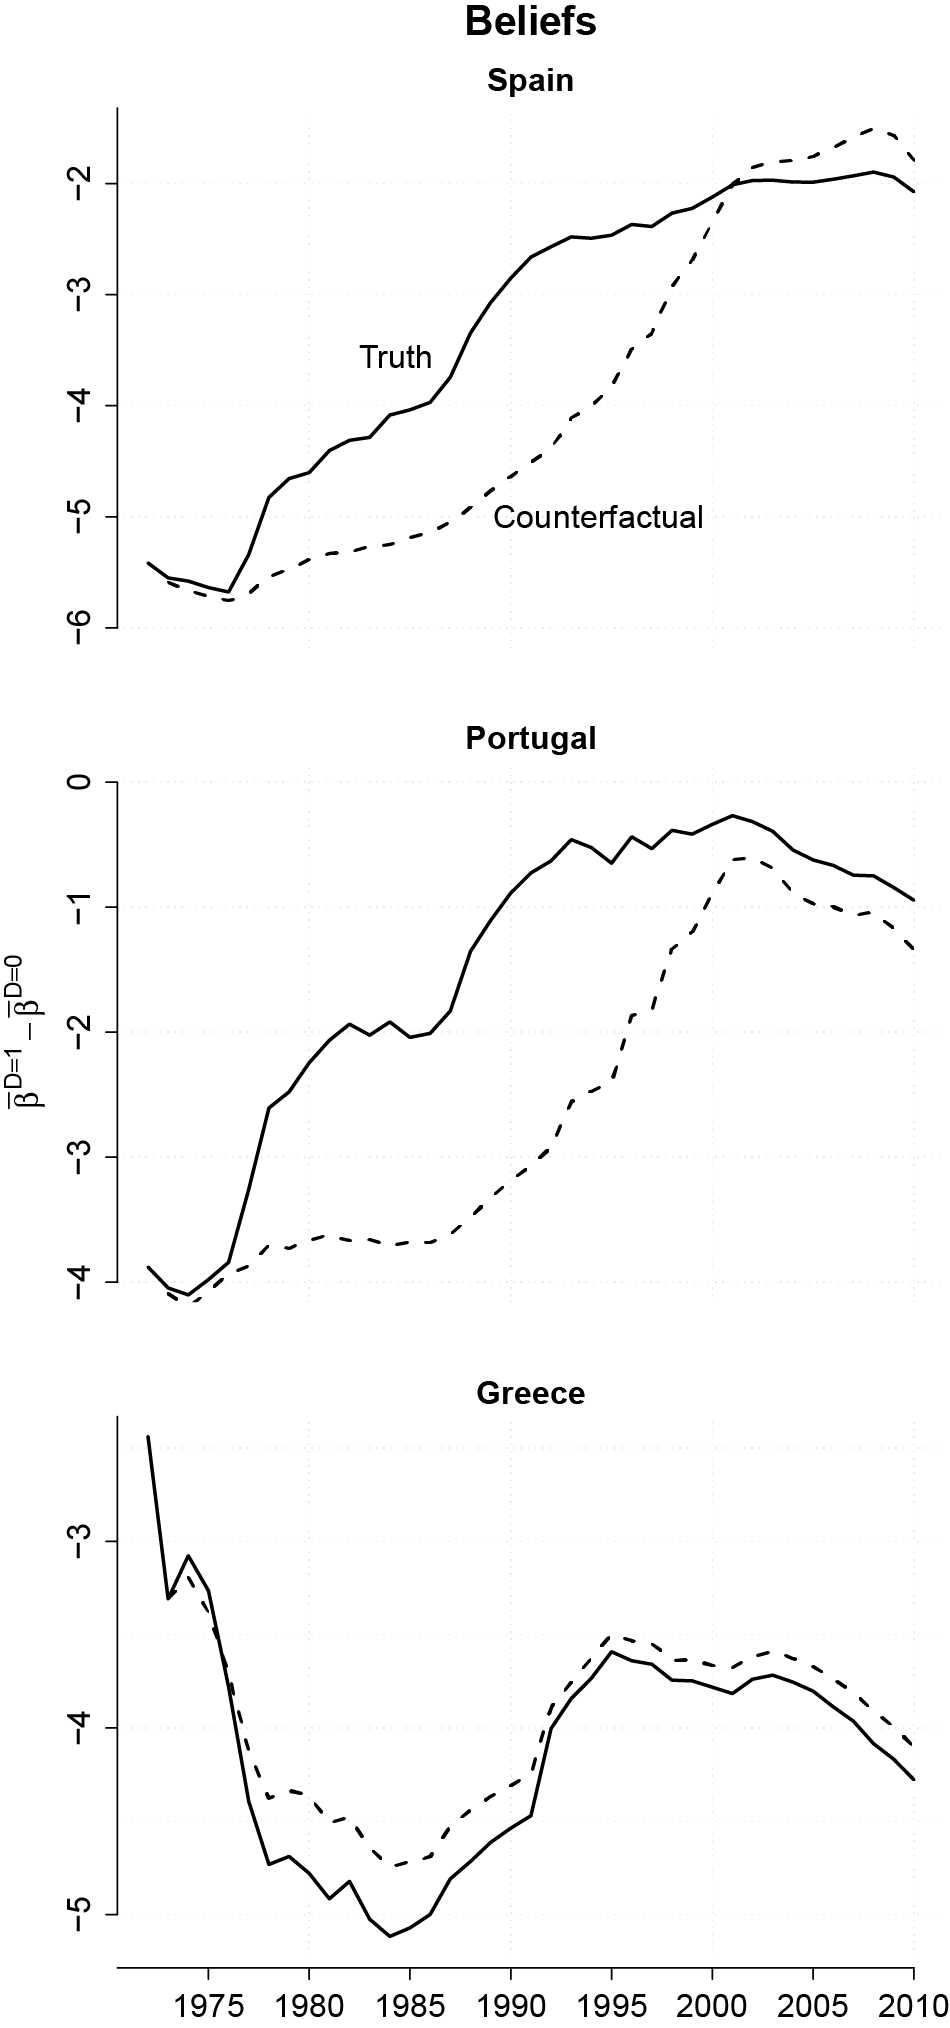
For Portugal and Spain, the effect of lower growth in Britain, France, and Germany is considerable, delaying their transitions to democracy by almost 20 years. In contrast, we find no effect of this recession on Greece’s transition. The reason for this becomes apparent once we compare the evolution of beliefs in the three countries. We plot in Figure 8, for each of these cases, our estimates of beliefs under the observed economic conditions (solid) and under our counterfactual timeline (dashed). Note that for Portugal and Spain there is a substantial divergence in beliefs between the observed and counterfactual timelines. Following our counterfactual recession, Portuguese and Spanish beliefs become markedly less favorable towards the potential for growth under democracy. In contrast, for Greece this is not the case: there is no substantial difference in beliefs. The reason, according to our model, is that Greek elites pay little attention to the large, relatively distant Western economies used to construct our counterfactual scenario. Britain, France, and Germany are simply too different from Greece to be used as a reference for learning.
Counterfactual Third-Wave Beliefs

Ultimately, our counterfactual experiment suggests that the distinguishing characteristic of Portugal and Spain, in contrast to, for example, Brazil or Mexico, is not their underlying propensity for democracy. In terms of their estimated baseline political cost of democracy, Portugal and Brazil and Spain and Mexico are fairly close.Footnote 34 Rather, Portugal and Spain democratized early because they learned from Western Europe, benefiting from proximity to successful liberal democracies.
Chinese (and North Korean) Democracy
With an eye to contemporary politics, we evaluate the stability of a pair of geopolitically important autocracies. We explore conditions under which our model predicts China and North Korea would democratize. We focus first on the Chinese case. Here, we look for the minimal average growth rate among China’s democratic neighbors, in a five-year economic expansion, that would result in transitions of two types.Footnote 35 First, we find the rate of growth that would result in at least a single year of democracy. Second, we establish the growth rate that would deliver a permanent transition to democracy.
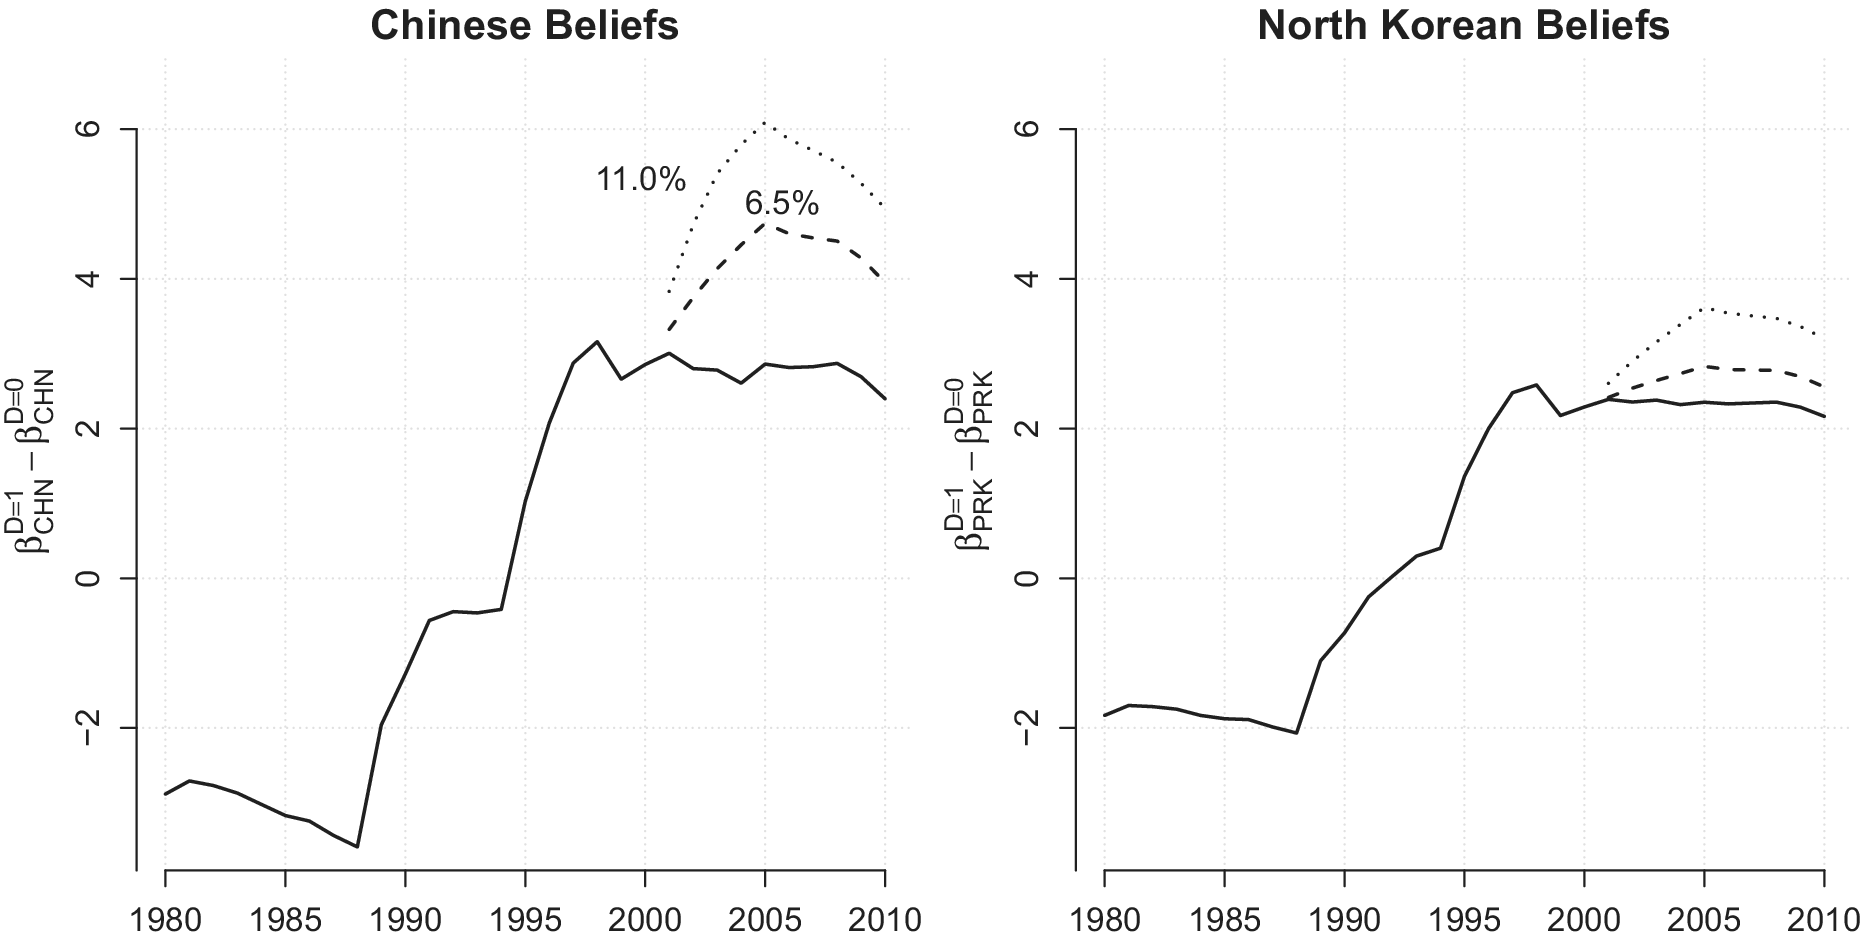
To obtain a predicted single-year Chinese transition to democracy, we estimate that it would take five years (2000–2004) of 6.5% average annual growth in China’s democratic neighbors. After this single year of democracy (2005), our model predicts an immediate reversal to autocracy. To obtain a “permanent” transition—that is, a prediction of democracy until the end of our sample—we estimate that China’s democratic neighbors would have to grow at an average annual rate of 11% between 2000 and 2004. In contrast, under the same set of counterfactual conditions, North Korea would not democratize for any period. North Korea would democratize for a single year following five years of 16.5% average growth in its democratic neighbors and permanently following five years of 20.5% average growth.
To highlight the differences in learning, Figure 9 plots Chinese and North Korean beliefs under the “Chinese democracy” scenarios of 6.5% and 11% average growth in their democratic neighbors. While our intervention increases the perception that democracy outperforms autocracy in both countries, the change in beliefs in North Korea is too small to induce a transition.Footnote 36 These results suggest that the prospects for Chinese and North Korean democracy are limited. It would take a remarkably large economic boom in Asian democracies for China to democratize and an even larger, implausible expansion to generate the same outcome in North Korea.Footnote 37
Chinese and North Korean Beliefs

Conclusion
We propose and estimate a learning model of democratization in which incumbent elites rely on worldwide economic history to update their beliefs about the impact of democracy on economic growth, which affects their likelihood of retaining power. Our estimates indicate that growth is stabilizing for incumbents in democracies but destabilizing in autocracies. Furthermore, we show that learning is highly circumscribed geographically. In combination, these features allow us to successfully predict, both in (1951–2000) and out of sample (2001–2010), much of the observed variation in democracy adoption. In particular, our model jointly rationalizes the cross-sectional correlation between income and democracy and the clustering of transitions to and from democracy.
Rather than an “end of history,” we show that democracy is only as resilient as the economic performance it engenders. Even in the 1990s, when the success of democratic systems made such proclamations seem reasonable, we find both substantial variation in the worldwide distribution of beliefs about the economic consequences of democracy and substantial uncertainty in these beliefs. As recent history suggests, and as our counterfactual experiments demonstrate, systemic economic crises, particularly those concentrated in democracies, have the potential to generate waves of autocratic reversals.
Our paper contributes to a sizable literature on democracy and development. Notably, our results indicate that focusing on the within-country impact of economic development on democratization is insufficient. Rather, modernization should be understood as a systemic phenomenon. Because countries learn from each other, a country’s economic performance affects not only its own likelihood of transitioning to or from democracy but also the prospects for democracy outside of its borders through its influence on neighbors’ beliefs.
Supplementary Materials
To view supplementary material for this article, please visit http://dx.doi.org/10.1017/S0003055420000325.
Replication materials can be found on Dataverse at: https://doi.org/10.7910/DVN/EPDD6F.







Comments
No Comments have been published for this article.