


American Indian tribes have fought for decades against the use of Native imagery as sports mascots (Fryberg et al. Reference Fryberg, Markus, Oysterman and Stone2008; Kaur Reference Kaur2019; Laveay et al. Reference Laveay, Callison and Rodriguez2009; Li and Brewer Reference Li and Brewer2021; NCAI 2021; Williams Reference Williams2025). In recent years, national sports franchises have changed their team names and iconography in response to these demands. States like New York, Colorado, Washington, and recently Minnesota have also passed legislation ending or moderating the use of Native-themed mascots by K-12 schools in consultation with Native Nations in those states (Hoppough Reference Hoppough2023; Neuman Reference Neuman2023). This study explores how the racialized and partisan identity of the policy messenger (Native, White, Democrat, Republican) influences support for changes to team branding, including team names, logos, and the controversial “Tomahawk Chop” gesture associated with the Atlanta Braves. Using two separate survey experiments—a nationally representative sample from the 2022 Cooperative Election Study (Survey 1) and another local survey conducted in Georgia (Survey 2)—I estimate average and conditional treatment effects of messenger identity on public support for change. In both surveys, participants were randomly assigned to control or treatment groups featuring the same message, but different messengers advocating for the end of Native-themed sports practices. The second survey leverages a local context to explore the effects of respondent and messenger identity on support for change regarding the Atlanta Braves franchise.
At the time of this study, there were still three major sports franchises that employ Native team names or imagery in their branding: the Atlanta Braves (MLB), the Kansas City Chiefs (NFL), and the Chicago Blackhawks (NHL). The Washington Commanders (NFL) changed their name from the “Redskins” in 2020 (Keim Reference Keim2025) while the Cleveland Guardians (MLB) changed their name from the “Indians” in 2021 (Waldstein and Schmidt Reference Waldstein and Schmidt2020). States are also considering legislation to mitigate the use of Native mascots, names, and imagery for K-12 sports teams. The New York State Assembly passed such a bill in 2022, which led to several school districts challenging the law in court. In early 2025, a federal judge dismissed the case. However, the U.S. Department of Education ruled that the policy violates federal civil rights law, creating a new challenge for states and school districts that seek to impose such policies (Rickert Reference Rickert2025). Executive rhetoric, particularly comments from the Trump administration, has also continued to politicize the issue of mascot practice making this a salient issue at the national level. In a political landscape where policies focusing on ethnic minorities such as Native Americans are seen as highly racialized, it remains unclear how much support Native advocates may expect to engender on the mascot policy debate.
This project examines how the American public responds to policy issues of Native Concern, specifically the removal of Native imagery and mascots in sports. Such policies are documented priorities of Tribal Nations within the United States and have a real impact on feelings of self-efficacy and self-worth for Native people. Moreover, control over how Native people and Tribal Nations are portrayed in popular media is an issue tied strongly to tribal sovereignty. The findings illuminate how advocates might choose messengers to communicate the policy priorities of tribes and Native interests when engaging with the general electorate, of which only 2% identify as Native American nationally (Koch Reference Koch2017). Notably, the findings suggest that Native messengers can meaningfully shift attitudes across a broad cross-section of the electorate. In both the national and local surveys, Native attribution is the most robust and consistent predictor of increased support for change, often exceeding the influence of White allies or co-partisan messengers. This cross-group responsiveness underscores the importance of centering Native speakers in public-facing advocacy, particularly when the policy issue is directly tied to Native identity, harm, and sovereignty.
Public Opinion and Native Mascot Practices
We may conceptualize the use of Indigenous logos, mascots, and names as a form of cultural appropriation by predominantly non-Native groups—a policy decision made by professional sports teams, colleges and universities, and state legislatures approving district-level school mascots (Keene, Small-Rodriguez, and Davis-Delano Reference Keene, Small-Rodriguez and Davis-Delano2024). These decisions govern how Native people are represented in public space and popular culture, with or without the consent or participation of the communities being depicted. Scholars across disciplines have chronicled the process of appropriation via these practices as a form of settler colonialism; that such appropriation is “part of a long history of White Americans taking and controlling AI resources” involving “White-generated imagery and myths in the absence of AI voices” (Davis-Delano, Galliher and Gone Reference Davis-Delano, Galliher and Gone2022, 397). Recent work further situates these representational practices within a broader colonial project of dehumanization embedded in American political institutions, whereby Indigenous peoples are rendered objects of governance rather than recognized as full political actors (Jardina and Piston Reference Jardina and Piston2023). The power to decide how Native people are represented in the public sphere was wrested from Native communities starting at first contact and throughout the self-determination era and even now is largely controlled by hegemonic institutions—including professional sports leagues, corporate franchise owners, and educational administrators, as well as state and local governments. These decisions tend to reflect dominant cultural norms rather than the preferences of Native peoples themselves. As a result, disputes over Native-themed mascots are not merely cultural disagreements but contests over who holds legitimate authority to define Indigenous identity in public life. Public opinion plays a critical role in this process: it both constrains and enables institutional decision-making, while also shaping the political space in which Native advocates seek redress. Understanding how different messengers influence public attitudes toward these policies is therefore essential to assessing the prospects for change in a domain where representation, sovereignty, and democratic inclusion intersect.
Prior research has clearly outlined the negative effects of discrimination, specifically the use of mascots, on Native American feelings of self-worth. A 2017 survey found that almost one-third of Native Americans felt discriminated against in hiring practices and in interactions with law enforcement and the judicial system, with 75% of all Native respondents indicating that discrimination against Native Americans exists today (Findling et al. Reference Findling2017). Fryberg et al. (Reference Fryberg, Markus, Oysterman and Stone2008) found that exposure to Native-themed mascots at the college level resulted in more negative self-views for Native students, as well as a depressive effect on the idea of self-achievement. While focusing on the stress effects of Native mascots on students, LaRocque et al. (Reference LaRocque, McDonald, Weatherly and Ferraro2011) found that even more “neutral” mascots may have negative psychological effects on Native people. This is an important consideration when evaluating claims that Native mascots may “honor” tribes or traditions. Findings from a 2009 survey of tribal leaders confirm that Native Americans find the use of Indigenous mascots, logos, and names more offensive than the general public (Leveay, Callison, and Rodriguez Reference Laveay, Callison and Rodriguez2009). A large-scale study echoed these results, claiming that Native Americans generally disapprove of the use of Native mascots, particularly more egregious representations like the Washington Redskins (Fryberg et al. Reference Fryberg, Eason, Brady, Jessop and Lopez2021).
Given these findings, we may assume that many individual Native Americans likely find the use of mascots and imagery in this regard at best distasteful, and at worst, discriminatory, and harmful (Davis-Delano et al. Reference Davis-Delano, Gone and Fryberg2020). Fawn Sharp (Quinault Nation), former President of the National Congress of American Indians (NCAI), had the following response to the Braves use of Native imagery, “In our discussions with the Atlanta Braves, we have repeatedly and unequivocally made our position clear—Native people are not mascots, and degrading rituals like the ‘tomahawk chop’ that dehumanize and harm us have no place in American society (NCAI 2021).” NCAI remains the largest coalition of tribes in the United States, whereby member tribes put forth resolutions for ratification. Their position on mascot policy has been ratified multiple times over the years, beginning in the late 1960s. Efforts have also taken place at the state level to prevent public schools from using Native imagery and names for school sports teams (Hoppough Reference Hoppough2023; Neuman Reference Neuman2023). However, no studies have yet examined how messenger cues may shift public opinion toward Native mascots in the general population, especially among White respondents who make up the majority (60%) of the Major League Baseball (MLB) fanbase (Silverman Reference Silverman2020).
By the time the 2021 World Series win occurred and in the wake of both the Commanders and Guardians name changes, MLB Commissioner Bob Manfred had been asked many times about the future of the Braves. “The Native American community in that region is wholly supportive of the Braves program, including ‘The Chop.’ For me, that’s kind of the end of the story. In that market, we’re taking into account the Native American community,” said Manfred (Coleman Reference Coleman2021). In response, leaders from the Muscogee (Creek) Nation, the federally recognized tribe with ancestral lands that include all of metro-Atlanta, pushed back. “You need to speak to the whole of Indian Country and make sure that you get a grand consensus. I wouldn’t say that they have that.” said Jason Salsman, representative for Chief David Hill. “I think for us, with the tomahawk chop, you’re not getting anything really authentic. You’re getting something that’s more of a caricature” (Li and Brewer Reference Li and Brewer2021). Following the 2021 World Series win, discussion of changing the Braves branding and tomahawk chop practice waned.Footnote 1
In 2020, Morning Consult conducted a series of polls examining heterogeneous responses to athlete protests during the Black Lives Matter movement, revealing how race, partisanship, and sports fandom intersect in shaping political attitudes (Silverman Reference Silverman2020). These findings illustrate how professional sports function as identity-rich environments where political symbolism is filtered through racial and partisan attachments. The data show that certain fanbases, including those of the Atlanta Braves, Kansas City Chiefs, and Washington Commanders, skew more Republican and more White than professional sports audiences in the aggregate. Importantly, Morning Consult also found that White fans were significantly less supportive of players kneeling during the national anthem than non-White fans, suggesting that racialized political controversies may activate identity threat among dominant in-group members. These dynamics indicate that sports arenas are not politically neutral spaces. Rather, these are sites where symbolic challenges to tradition, authority, and national identity are contested.
This context is particularly relevant for understanding public responses to Native mascot change. If Native leaders and organized tribal interests have articulated the removal of Native imagery as a policy priority, opposition among certain fanbases may reflect not only views about Native people but also strong attachments to team identity, tradition, and partisan norms. This raises a broader theoretical question central to this study: under what conditions can messages supporting Native policy preferences overcome identity-based resistance among politically and racially homogeneous fanbases? Moreover, who will be seen as a credible voice to deliver those messages in ways that increase receptivity among predominantly White audiences, like Braves fans?
Theory and Expectations
The extant literature on political persuasion provides insight into how source cues, particularly the identity of policy position messengers, may influence the likelihood of respondents approving policy positions. Viskupič and Wiltse (Reference Viskupič, Wiltse and Meyer2022) sampled 709 unvaccinated voters in South Dakota providing the same pro-vaccination statement for COVID-19, but from three distinct messengers: a political, religious, or medical leader. They found that only the message from a non-partisan religious leader significantly effected respondents’ self-reported interest in vaccination. In another study on the effect of majority opinion writer identity on public approval of SCOTUS decisions, the authors found that when the opinion writer’s ideology matched the respondent’s ideology, they were more likely to express agreement with the outcome (Boddery and Yates Reference Boddery and Yates2014). Interestingly, when the outcome was not in line with the political ideology of the respondent, but was written by a co-partisan, agreement was still significantly higher, though at a smaller effect size than if the outcome was also politically aligned.
Similarly, Callaghan and Schnell (Reference Callaghan and Schnell2009) found that there are significant differences in support for gun control based on policy messengers that engender partisan responses (e.g., New York Times, National Rifle Association, etc.). In their discussion of these effects, the authors specifically ask if such results might translate to less salient issues: “We believe that less salient issues will be even more vulnerable to messenger effects because citizens have less crystallized opinions about these issues, as well as fewer preconceived ideas about the trustworthiness and expertise of the spokespersons associated with the issue.” (24) These studies illustrate that the persuasiveness of a message is deeply shaped by who delivers it. Messengers who are ideologically or culturally aligned with their audience are more likely to shift attitudes—even when the message itself might be met with skepticism if delivered by someone outside the respondent’s in-group.
Given this understanding of political source cues, what mechanisms might facilitate increased support for policies of Native preference? The Reclaiming Native Truth Project surveyed 2,000 Americans to explore new frameworks for narrativesFootnote 2 that might challenge preconceived notions about Native people and communities (First Nations Development Institute and Echohawk Consulting 2018). In one part of this study, the authors found an increase in support for removing Native mascots for those who received a new narrative, as compared to the control. Foxworth and Boulding (Reference Foxworth and Boulding2021) used data from the project to examine how political ideology and racial stereotypes factor into attitudes about Native Americans. Native Americans are not only one of the smallest ethnic minority groups in the USA but also have a unique identity within the American political context as members of sovereign nations that reside within the American geography. Many Americans are unfamiliar with Native culture and may have never met a Native person in their lifetime, making them more open to new ideas about Native people and their priorities (First Nations Development Institute and EchoHawk Consulting 2018).
Despite extensive evidence that Native-themed mascots impose psychological and social harms on Native people, public opposition to these symbols remains limited and highly polarized. Given this context, under what conditions do members of a racially advantaged group come to support policy changes that challenge longstanding symbolic practices tied to their own group identity? Native mascots are not merely cultural artifacts or expressive symbols; they operate as institutionalized representations that reproduce racial hierarchies by normalizing caricatured portrayals of Indigenous peoples while stripping them of political authority (Deloria Reference Deloria1998). In this sense, mascot debates are not solely about cultural sensitivity, but about who holds the power to define Native identity in public space. Because Native Nations occupy a unique political position as sovereign entities within the United States, their policy claims often challenge dominant understandings of authority, jurisdiction, and identity. As a result, support for Native priorities may depend less on the substance of the policy itself and more on whether the claim is perceived as legitimate by non-Native audiences. Messenger identity becomes central in this context, as it shapes whether policy demands are interpreted as credible governance claims or as symbolic grievances.
Though new narratives by credible messengers may have an impact on support for Native policies, I still expect to see distinct differences by race and partisanship in the survey experiments. Using an adaptation of the Short Indigenous Resentment Scale (Beauvais Reference Beauvais2021), Foxworth and Boulding found that discrimination and feelings of resentment toward Native Americans are impacted by political ideology. Specifically, conservative ideology positively and significantly predicts resentment toward Native Americans. In a later study, these authors also find that conservative respondents are less likely to support the idea of Native mascot bans (Foxworth and Boulding Reference Foxworth and Boulding2023). Moreover, White respondents in their study were more likely to rely on political ideology as a “shortcut“ to forming opinions about pro-Native sovereignty policies (as compared to non-White respondents). Scholarship examining the formation of discriminatory attitudes toward racial minorities in the United States hinges on the idea that these groups may be seen to violate norms traditionally associated with “White America” such as hard work and individual achievement (Kinder and Sears Reference Kinder and Sears1981; Jardina Reference Jardina2019). In addition to holding negative views of outgroups, social identity theory tells us that many display favoritism to members of groups in which they are a part (e.g., gender, race, partisanship, religion) (Tajfel Reference Tajfel1970; Tajfel and Turner Reference Tajfel, Turner, Austin and Worchel1979). Racial resentment on the part of White Americans, it can be argued, is a result of the combination of this in-group favoritism and the perception that out-group members (racial and ethnic minorities) challenge settler colonial projects such as Native appropriation. Empirical studies have illustrated that ideology is associated with these manifestations of animosity toward out-groups, with conservatives often rating higher on measures of racial resentment (Carmines et al. Reference Carmines, Sniderman and Easter2011; Feldman and Huddy Reference Feldman and Huddy2004; Foxworth and Boulding Reference Foxworth and Boulding2021; Foxworth and Boulding Reference Foxworth and Boulding2023; Tuch and Hughes Reference Tuch and Hughes2011), ceteris paribus. It follows that the use of Indigenous mascots may be seen as “a ‘possessive investment’ in whiteness, creating artificial unity, while Indigeneity is simply a means to that end…” (Williams Reference Williams2025, 4; Staurowsky Reference Staurowsky2000; Tarver Reference Tarver2016). In other words, pressures to end the use of fan-based practices and symbols, tied to Indigeneity, may be seen as direct threats to those groups who created them.
Considering that resentment can be triggered by policies that prioritize a specific minority group, policies that advance the interests of tribal members may also generate backlash from respondents. Though Native American concerns and policy priorities may be unique given their enduring fight to retain sovereignty in a complex national legal and political system, racialized policies, such as sports mascots, may trigger similar responses to the policy priorities of other racial and ethnic minorities.Footnote 3 Imagery and team names that echo caricatures of Native people as having “red skin” in particular racialize this policy debate in a way that leads to partisan polarization. We can see this evidenced in President Trump’s remarks as he re-ignited the debate around the Washington Redskins name in July of 2025 by threatening to “put a restriction on them” if they did not change their name back from the Commanders (Stein Reference Stein2025). This remark was in response to plans for a new Commanders stadium in the greater D.C. area
We may also see out-group resentment based on fan identity. Sports fandom constitutes a salient social identity that operates through similar in-group and out-group dynamics as race and partisanship. Fans often derive affective attachment, group pride, and a sense of belonging from team affiliation, making challenges to team symbols potentially experienced as challenges to the self. Opinion pieces like Joe Concha’s (Reference Concha2021), “Cleveland Indians name change to Guardians profoundly stupid, unnecessary,” in The Hill, popped up in mass around each franchise’s proposed change. To quote, Concha, “Wouldn’t it be an honor to have a team named the Cleveland Indians, and wouldn’t it be disrespectful to rip that name and logo off of those jerseys?” The narrative of “honor” is a throughline for in-group advocates to keep using Native imagery in sports. However, the argument around honoring Native people seems to be a response to outside pressure, rather than an internal fan-based desire to understand or elevate Native communities. Studies of non-Native attitudes around mascot practice have found that supporters of Native appropriation exhibit greater prejudice toward Native people and are generally less supportive of tribal rights (Davis-Delano et al. Reference Davis-Delano, Galliher and Gone2023). In response to the idea of mascots “honoring” tribes, Chuck Hoskin Jr., Principal Chief of the Cherokee Nation, expressed the following: “We appreciate that the Atlanta Braves are trying to honor the Native community, but the best way to honor us, is to stop the use of Native American depictions across sports” (Rosenthal Reference Rosenthal2020).
In contrast, out-group fans or non-fans are less likely to experience identity threat and may evaluate mascot change through broader normative considerations, such as fairness, respect, or harm reduction. As a result, these respondents may be more receptive to messages emphasizing Native sovereignty and dignity, especially when delivered by in-group messengers who provide novel or corrective information. Taken together, these literatures suggest that attitudes toward Native mascots are shaped by a combination of racial identity, partisan affiliation, fandom, and elite cue-taking. When policy demands challenge symbolic practices tied to White or partisan in-groups, respondents may experience identity threat, triggering resistance rooted in racial resentment. However, messages delivered by in-group elites may reduce this resistance by reframing the policy as normatively acceptable within the respondent’s own identity group.
HypothesesFootnote 4
I expect that cues expressing positive valuations, regardless of source, will increase support for Native policy priorities across all respondent groups. However, I expect that the level of support will be moderated by the noted racial identity of the source, with the greatest increase in support demonstrated by White respondents who receive the cue from a member of their racial in-group. I also expect that high levels of fandom, when measured (Survey 2), will moderate the increased level of support in the treatment groups.
H1: White respondents who receive the White treatment cue will indicate greater support for change (as compared to White respondents who receive the unattributed statement).
H2: Likewise, Partisan cues will have a positive effect on support for change for in-group partisans (as compared to those who receive the unattributed statement). However, as stated above, Republicans will still be less likely to support change as compared to Democrats.
Evaluating Responses to Changing Mascots in Professional Sports
In the first experiment, I examined the effects of identical policy messages using survey data collected from the nationally representative Cooperative Election Study. In this study, respondents are asked about general support for removing mascots and Native imagery from professional sports teams, writ large. Using the same information, but different source cues, I seek to illuminate how messengers from an in-group might impact public support for changing the practice of using Native mascots and imagery in professional sports.
In the second survey, I leverage a localized context to examine responses to messages of support from four different sources aimed at increasing support for changing the Atlanta Braves mascot, logo, and “tomahawk chop,” as well as general support for removing Native imagery from professional sports. To date, no studies have examined how sources of information about changing Native mascots may impact how respondents feel about the Braves, specifically. This is an important oversight, as changing opinion among the fan base may drive changes in the franchise. See Appendix A for a brief history of the Braves franchise and its use of Native imagery.
The focus of my inquiry in Survey 2 is on the Atlanta Braves franchise, utilizes respondents from within the state where the team is based, and takes place less than one year after their World Series Victory (2021). The Atlanta Braves are also of interest as they, like the Kansas City Chiefs, are thought to be more “neutral” or even “positive” representations of Native Americans, as compared to the more clearly derogatory imagery and names surrounding teams like the former Washington Redskins, or the Cleveland Indians. I argue that those who are most loyal to the team will be at their most intractable position during the timing of the survey. Finally, these experiments go beyond examining White opinion on Native mascots by focusing on our understanding of which messengers might best move these opinions toward stronger support or action for changing team policy.
Survey 1: Support for Changing Mascots and Native Imagery in Professional Sports (CES National Sample)
To observe national responses to changing Native mascot practices in professional sports franchises, I tested the effects of Native and White messengers using an identical statement in the Fall 2022 Cooperative Election Survey (September to November 2022). This sample includes 822 respondents from across the United States, who were interviewed before and after the midterm election. The prime was generalized for a national audience:
“Please read the following excerpt from a statement made by (name/affiliation) regarding the use of Native American imagery in professional sports:
‘Tribes have made it clear for over five decades that removing Native-themed mascots is the right thing to do. Cleveland changed; Washington changed. It’s time for all professional sports teams to end the use of Native imagery and names in their marketing’.”
The prime is an amalgamation of statements made by tribal leaders regarding Native-themed mascots in sports. The statement was intentionally general. The goal was to create a statement that was both strong enough to engender support for changing Native mascots without ambiguity and general enough that most anyone could have authored it. Importantly, the statement contains several key concepts: (1) that Native American tribes have been requesting this change for more than 50 years and regard the practice as “harmful”; and (2) that two other major league sports franchises, the former Washington Redskins (now Commanders) and former Cleveland Indians (now Guardians), recently changed their names and branding. These are the core elements of arguments made by advocates for changing these practices and should provide a strong cue to encourage respondents toward a more supportive stance, in general. Because these informational elements are held constant across all experimental conditions, observed differences in support can be attributed to variation in messenger identity rather than differences in message content.
In the first treatment, the statement is attributed to Fawn Sharp, then President of the NCAI. While few respondents may have been familiar with her name, the name of the organization and the mention of her tribal affiliation (i.e., Quinault Indian Nation) should serve as a strong cue that she is a representative for Native people. This voice should not cause any partisan effects because the general population is largely unaware of how Native people tend to vote or align themselves politically (Koch Reference Koch2017). The second treatment attributes the statement to Betty White, a well-known celebrity and actor. Betty White is someone who should, for most respondents, be quickly identified as a White person, is well-liked, and should not cue partisan effects—she was known to be purposefully apolitical in public. All sources were also self-identified women to avoid any gender-based differences in evaluation. An unattributed cue was also included as a measurement of message effect sans messenger identity. To estimate a baseline of support for changing Native mascots, I included an unrelated informational cue as a control (see Appendix C for full text).
The dependent variable is support for changing the use of Native imagery in sports. The questions are an adaptation of Knoester and Rockhill (Reference Knoester and Rockhill2021) whereby respondents are asked if they strongly agree, somewhat agree, neither agree nor disagree, somewhat disagree, or strongly disagree with the following statements: “Native American team names should be eliminated from sports.”, “Native American mascots should be eliminated from sports.”, and “Native American images and logos should be eliminated from sports.” These dependent variables have high internal validity (.92 Cronbach’s Alpha or higher), which were then averaged into a single indexed measurement.
Results
Respondent Characteristics
Survey 1 was a national sample with 822 eligible respondents. 75% identified as White, 10% Black or African-American, 7% Hispanic, 3% Asian, 2% Multiracial, 2% other or unknown, and >1% Native American or Middle Eastern, respectively. The sample included 25% self-identified Republicans, 40% Democrats, and 27% Independents (with 8% party other or unknown)Footnote 5 . 21% of respondents live in states where there is a prominent sports team with a Native name, mascot, or imagery. 75% of respondents live in a state with a federally recognized tribe. 65% of respondents self-identified as women, 56% as men, and less than 1% as non-binary or other gender.Footnote 6 Republicans, Democrats, and Independents were assigned to each treatment, unattributed statement, and the control using block randomization on partisan identity. Figure 1 below shows the breakdown of responses to the dependent variable by Partisan identity. Democrat respondents tend to issue higher support for changing practices than do Republican respondents.
Survey 1 mean responses by partisan identity (n = 822). Points indicate model-predicted mean support (1–5 scale) estimated from OLS; vertical lines denote 95% confidence intervals.

A power analysis indicates that to reach the acceptable threshold of 80% power (Cohen Reference Cohen1988), each treatment group and control would need approximately 175 respondents (p < .05, effect size of .30). The unattributed group (n = 195), control group (n = 184), and the treatment groups for Native Cue (n = 187) and White Cue (n = 188) are all well powered.
Average Treatment Effects
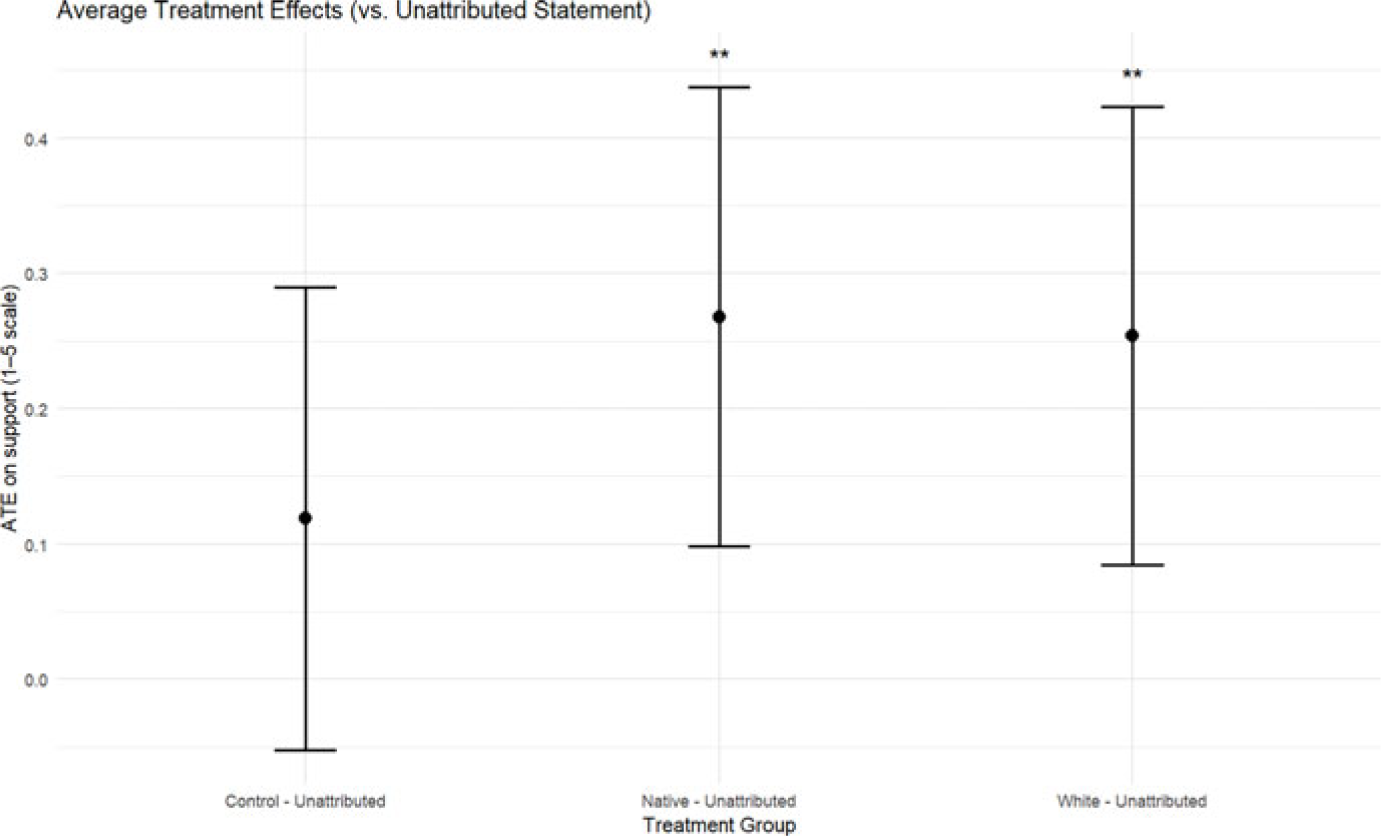
To estimate the effect of treatment cues on participant support for change, I fit an OLS regression model predicting responses to an index of the dependent variables D1 (names), D2 (mascots), and D3 (logos), which measured agreement on a five-point Likert scale (strongly disagree, somewhat disagree, no opinion, somewhat agree, strongly agree). The model includes covariates for gender (woman), tribal presence in the respondent’s state (0,1), and partisan identification (Democrat, Independent, or Republican).Footnote 7 The average treatment effects (ATEs) are presented in Figure 2 below by treatment group.
Average treatment effects for Survey 1 (n = 822). Points indicate conditional average treatment effects estimated from OLS models with a standardized outcome; horizontal bars denote 95% confidence intervals.

The estimated effect of the Native and White treatment on respondent levels of support are both positive and statistically significant, as compared to those in the unattributed statement condition. The results indicate that exposure to the Native cue increases predicted support by approximately one-quarter of a response category on the underlying scale (β = .27, SE = .09, p < .01), corresponding to roughly a .3 standard deviation shift. Respondents in the White treatment saw a statistically significant increase in support (β = .25, SE = .09, p < .01), corresponding to roughly one-quarter of a response category on the underlying five-point scale. These effects reflect a modest but notable shift in respondent attitudes. Interestingly, there were no significant differences found when comparing ATEs for the unattributed statement group as compared to the control. In other words, it seems that the unattributed statement on its own was not persuasive enough to garner any significant change in levels of support.
Conditional Average Treatment Effects
I calculated conditional average treatment effects (CATE) by race/ethnicity and partisanship for the n = 754 respondents in the sample who identified with a political party using OLS regression models with interaction terms for the binary, “white“/“nonwhite” variable, and categorical partisan identity. Note that CATE estimates are underpowered and are therefore exploratory. Because the theoretical expectations concern how white respondents respond to racial cues relative to the message alone (unattributed), results are presented using marginal effects that estimate within-group treatment contrasts. Among white respondents, both racial cues increase support relative to the unattributed statement. Exposure to the Native cue increases white respondent support by roughly one-third of a response category on the underlying five-point scale, relative to unattributed (AME = .31, SE = .10, p < .01), while exposure to the White cue produces a smaller but still positive increase (AME = .24, SE = .10, p < .05). The estimated effect of the unattributed statement, as compared to the true control, is positive but not statistically distinguishable from zero (AME = .16, SE = .10). The results indicate small but detectable shifts in support, rather than large-scale attitude change. See Figure 3 below.
Conditional average treatment effects by respondent race (binary) in Survey 1 (n = 754). Points indicate conditional average treatment effects estimated from OLS models with a standardized outcome; horizontal bars denote 95% confidence intervals.

Among Republican respondents, only exposure to the Native cue produces a positive and statistically distinguishable increase in support relative to the unattributed statement (AME = .40, SE = .17, p < .05), corresponding to roughly two-fifths of a response category on the five-point scale. Among Democratic respondents, both racial cues produce statistically distinguishable increases in support relative to the unattributed statement. Exposure to the Native cue increases support by approximately .31 points on the five-point scale (AME = .31, SE = .13, p < .05), while exposure to the White cue produces a larger increase of approximately half a response category (AME = .51, SE = .13, p < .001). Again, the estimated effect of the unattributed statement alone is smaller and not statistically significant (AME = .11, SE = .13). Among Independent respondents, none of the attribution conditions produce statistically distinguishable changes in support relative to the unattributed statement. Figure 4 below shows the CATEs grouped by partisan identity of the respondent and treatment group. Regression tables are available in Appendix E .Footnote 8
Conditional average treatment effects for respondents by partisan ID in Survey 1 (n = 754). Points indicate conditional average treatment effects estimated from OLS models with a standardized outcome; horizontal bars denote 95% confidence intervals.

Survey 2: Support for Changing the Braves (Georgia Sample)
While the national survey explored responses to messengers on support for broad mascot policy change, the second survey leverages a localized context to explore how interactions between fandom, racial, and partisan identity and racialized resentment might alter support for change based on messenger identity. In the second survey, the prime was designed with the aim to increase support for changing the Atlanta Braves mascot, logo, and “tomahawk chop,” as well as general support for removing Native imagery from professional sports. I first examined the effects of a 1 × 5 experiment, in which an identical policy message was attributed to four different sources or, in the control condition, without source. The sample includes n = 964Footnote 9 undergraduate student respondents enrolled at the University of Georgia and was conducted in March and April of 2022. Due to their geographic location and the Braves’ 2021 World Series victory, respondents were especially likely to have been exposed to Braves imagery. Moreover, approximately 75% of UGA undergraduate students are originally from Georgia (Slaton and Sharma Reference Slaton and Sharma2023). Respondents were asked to self-identify their political ideology and partisanship status.
Once these questions were completed, block randomization on partisan identity was used to assign partisans to one of the following: Native cue treatment, White cue treatment, Republican cue treatment, Democratic cue treatment, or control. In this experiment, the control was an unattributed version of the same statement. Each group received an informational statement which describes the “tomahawk chop,” in case they were unfamiliar with the practice, along with an image depicting the practice. The information presented a neutral description of the practice, to avoid inadvertently influencing responses to the dependent variable on support for change. On the next page, respondents received a general statement opposing the use of Native mascots that was attributed to one of four sources. Specifically,
“Please read the following excerpt from a statement made by [name, affiliation] around the time of the World Series (2021) in response to the Braves ownership electing not to change the name, logo or practices around the team:
Tribes have made it clear for over five decades that removing Native-themed mascots is the right thing to do. Cleveland changed; Washington changed. The Braves are one of the last professional sports teams left who have not made serious efforts to fix this harmful error. I think it’s time to stop the disrespectful tomahawk chop, and it’s time for these world champs to change their name.”
The prime is very similar to Survey 1 but adds an additional component regarding the practices employed by the Braves. The racialized messengers are the same as in Survey 1. As the respondents from this survey are all college students, I was able to leverage an additional test on in-group partisan identity on support for change by including two partisan messengers. The last two treatments include partisan cues represented by Courtney Britt, then Chair of the College Republican National Committee, and Gabrielle Harris, then National President of the College Democrats of America, respectively. I selected national groups representing the two major parties at the college level so that the partisan voices represented respondents’ peers. I also selected real, but lesser-known political leaders to ensure that partisan effects were not confounded by existing attitudes towards well-known politicians. Responses to certain partisan messengers may reflect respondents’ pre-existing attitudes toward those actors, rather than the informational content of the message itself. All sources were also self-identified women to avoid any gender-based differences in evaluation from respondents.
The dependent variable is support for changing the use of Native imagery in sports and specifically, for the Braves franchise. Treatment group participants were asked to answer a four-part question series assessing their support for changing Native mascots in general, as well as changing the logo, name, and use of Tomahawk Chop for the Braves. DV1 captures general support for change, “Native American team names and mascots should be eliminated from sports”. I included three additional statements to measure support for changing aspects of the Braves logo, name and practices regarding Native imagery: “The Atlanta Braves should change their name to a non-Native team name.” (DV2); “The Atlanta Braves should change their logo to a logo without Native imagery” (DV3); and, “The Atlanta Braves should stop using the tomahawk chop during games” (DV4). All items used the same five-point response scale and have high internal consistency (.82–.87 Cronbach’s Alpha). Because there have been debates about each of these components, I analyzed each DV separately instead of creating an index. Although the responses in the first survey were consistent across DVs and treatment groups, there were more nuanced differences between respondent evaluations of the Braves’ logo, name, and Tomahawk Chop.
The final section of the survey included questions regarding demographics, specifically respondent gender and race/ethnicity. A screen outlining the deception used in the experiment (i.e., the statement authors) was displayed before respondents exited the survey. I also controlled for the strength of respondents’ affinity for the braves (fandom), using a five-category variable that included the following options: “I am a strong Braves fan”; “I am somewhat of a Braves fan”; “I have no opinion about the Braves”; “I somewhat dislike the Braves”; and, “I strongly dislike the Braves”.
Results
Respondent Characteristics
Respondents (N = 964) in this non-probability sample were 73% White, and 23% non-White (13% Asian, 5% Black, 5% Hispanic, 4% MultiracialFootnote 10 ). The sample included 52% self-identified Republicans, 45% Democrats, and 3% Independents. The sample is well-suited to the survey design, as I am mostly concerned with attitudes of White respondents residing in Georgia, where the Atlanta Braves team is based. Indeed, 59% identified as Braves fans (42% indicated being somewhat of a fan; 17% identified as strong fans). The majority (65%) of respondents identified as female, 33% as male, and 2% as non-binary or other gender. Using block randomization, a roughly equivalent number of self-identified Republicans, Democrats, and Independents were assigned to each treatment and the control group.
There were very few true Independents after assigning those who leaned toward one party or the other. Independents are therefore included in the ATE analysis but removed from analysis on heterogenous effects by partisanship. See Appendix F, for a breakdown of respondents by treatment group, partisanship, and race. See Appendix H for a breakdown of responses to DV4 (Tomahawk Chop) by Partisan identity, which is consistent across all four DVs. As with Survey 1 respondents, self-identified Democrats indicated a higher level of support for changing practices associated with the Braves than do Republican respondents.
A power analysis indicates that to reach the acceptable threshold of 80% power, each treatment group and control would need approximately 175 respondents (p < .05, effect size of .3). The control group (n = 241) and the treatment groups for Native Cue (n = 199), White Cue (n = 197), and Democrat Cue (n = 184) are all well powered, but the Republican Cue (n = 143) is slightly underpowered. In short, null findings for the Republican cue treatment may be due to lack of power rather than the absence of a true effect.
Average Treatment Effects
To examine the effect of treatment conditions on support for change, I estimated ordinary least squares (OLS) regression models with responses to the four dependent variables (measured on the five-point Likert scale from Strongly Disagree to Strongly Agree) as the dependent variable. The model includes a categorical variable for treatment conditions with the control group specified as the reference category. Additional covariates include gender (woman), as well as partisan identity. Predicted levels of support are similar across treatment conditions, clustering near the midpoint of the five-point scale.
Model outputs (see Appendix I ) indicate that there are only significant differences in levels of support based on treatment assignment for changing the Braves name (DV2) and the Tomahawk Chop (DV4). On the outcome measuring support for changing the Braves’ name (DV2), the Native cue produced the largest shift (.31 points, p < .001), followed by the White cue (.23 points, p < .01) and the Democratic cue (.19 points, p < .05). For the Braves’ “chop” ritual (DV4), only the Native cue produces a statistically distinguishable effect. Exposure to the Native-attributed message increases agreement by approximately .28 points on the five-point scale relative to the unattributed statement (p < .01). No other attribution condition produces a statistically detectable shift in support for the chop, suggesting that responses to this practice are sensitive to Native attribution but largely unresponsive to alternative identity cues. See Figure 5 below.
Average treatment effects in Survey 2 (n = 964). Points show average treatment effects estimated via OLS. All models adjust for gender and partisanship. Error bars represent 95% confidence intervals.

However, in an alternative specification that includes the Fandom Scale variable measuring Braves fandom, the estimated effects are greatly diminished. The model indicates that the stronger the Braves fan (using a 5-point Likert scale), the less likely the respondent is to agree with change across all four dependent variables (−.25 to −.38, all p < .001). Only for DV2 (name change) do we continue to see significant effects by treatment after controlling for fandom, a .91-point increase in agreement under the White cue (p < .05), as compared to the unattributed statement. This suggests that differences in support for changing the chop were primarily driven by pre-existing attitudes toward the team, rather than by the treatment messages themselves. While fandom is a strong predictor of overall attitudes, the lack of significant interaction terms indicates that treatment effects were consistent across levels of fandom.
Conditional Average Treatment Effects
I calculated CATE by race/ethnicity and partisanship for respondents in the sample with complete observations for these variables (n = 929; n = 935) using OLS regression models with interaction terms for the binary, “White”/“non-White” variable, and categorical partisan identity. Because the quantity of interest is the effect of each cue within particular respondent groups, I report CATEs rather than pooled coefficients. Note that CATE estimates are underpowered and have wide confidence intervals and are therefore exploratory.
Among White respondents, the Native cue is the only treatment that produces consistently positive effects across outcomes. The estimated effect of the Native cue is positive for all four outcomes and reaches statistical significance for support for changing the team name (DV2: β = .36, 95% CI [.05, .66], p < .05) and for ending the chop (DV4: β = .36, 95% CI [.04, .68], p < .05). These coefficients correspond to approximately one-third of a point increase on the five-point outcome scale. Effects for the General (DV1: β = .24, p = .13) and Logo outcomes (DV3: β = .26, p = .10) are positive but not statistically distinguishable from zero. No other treatment condition yields statistically significant effects relative to the control group across outcomes. See Figure 6 for the CATEs among White respondents.
Conditional average treatment effects among White respondents in Survey 2 (n = 929). Estimates are obtained from OLS models with treatment–race interactions. Points denote estimated effects and bars indicate 95% confidence intervals.

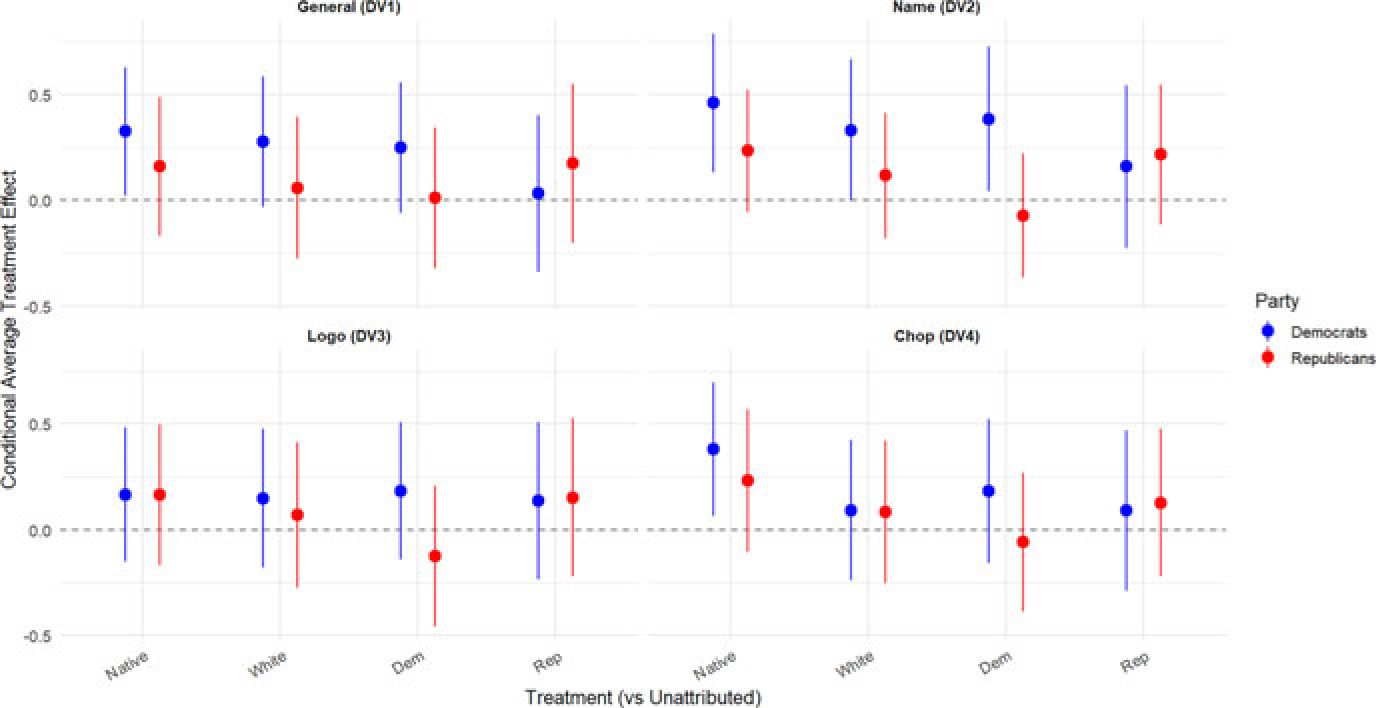
CATEs by party of respondent reveal that the Native cue is the only treatment that consistently increases support as compared to the unattributed statement, with effects concentrated among Democratic respondents. For Democrats, exposure to the Native cue significantly increases general support (DV1: β = .33, p < .05), support for changing the team name (DV2: β = .46, p < .01), and support for ending the chop (DV4: β = .38, p < .05). Effects among Republican respondents are uniformly positive but smaller in magnitude and not statistically distinguishable from zero across outcomes. No other treatment condition produces consistent or statistically significant effects for members of either party. See Figure 7 for CATEs by partisan ID.
Conditional average treatment effects by partisan ID, Survey 2 (n = 935). Estimates are obtained from OLS models with treatment-partisan. Points denote estimated effects and bars indicate 95% confidence intervals.

Discussion
The results indicate that there is room for shifts in attitude around the use of Native imagery in professional sports based on the identity of the messenger. In particular, the Native Cue seems to consistently move support in the positive direction for White respondents across both surveys, which is somewhat surprising given theoretical assumptions about out-group threat.
Do White Respondents Respond with Stronger Support When the Policy Messenger is White (H1)?
Among White respondents, the results reveal a complex picture of how messenger identity influences support for Native-themed sports changes. In Study 1 (National) Native and White messengers consistently produced statistically significant and stronger attitudinal shifts among White respondents across outcomes as operationalized by the indexed dependent variable. White respondents in this sample, for the most part, did not exhibit high levels of racial resentment, nor did they have a significantly lower level of support (compared to non-White respondents).
In Study 2 (Braves), White participants showed an increase in their level of support in the Native cues across all dependent variables, with a significant increase in support for both DV2 (Name) and DV4 (Chop), as compared to the unattributed statement group. In this survey, racial resentment was also significantly higher for White respondents than non-White respondents. This was particularly interesting as the Georgia context may be seen as a harder test for persuasion. Not only did White respondents in this sample indicate higher levels of resentment, but most respondents also indicated Braves fandom at some level, making any treatment-based effect on the heels of a championship win notable. The name and the chop also tend to be the focal points for political discourse, which may also be why the effect sizes were larger and significant for these dependent variable measures, as compared to the logo and general support for change. In the Braves context, White respondents are not unpersuadable, but their responsiveness is highly constrained: only Native attribution reliably shifts attitudes, and only on the most symbolically charged outcomes.
These findings suggest that White respondents are more receptive to Native messengers when the issue is framed abstractly or symbolically, but that emotional attachments to specific teams may override messaging effects in contexts where group identity is deeply tied to fan culture. Notably, these effects persisted even in the wake of national championship victories by two high-profile teams—the Atlanta Braves and the Kansas City Chiefs—events that typically bolster fan pride and heighten resistance to change. The underperformance of the White cue in the Braves context likely reflects a shift in the mechanisms governing persuasion rather than diminished responsiveness among White respondents. In the national survey, where racial resentment was lower and attitudes were evaluated at a more abstract level, White attribution plausibly served as an in-group validator, legitimizing support for change. In the Braves survey, however, higher levels of racial resentment and strong fan identification appear to constrain in-group persuasion. When proposed changes threaten locally embedded symbols and practices, White attribution offers little new informational value and may even heighten defensive reasoning. By contrast, Native attribution retains persuasive force by grounding claims in moral authority and lived experience, allowing it to shift attitudes on the most symbolically salient outcomes even in a high-attachment, high-resistance environment.
Do We See Greater Support for Change from Co-Partisans? (H2)
Hypothesis 2 receives limited support in the Braves survey. Contrary to expectations, co-partisan cues do not reliably increase support for change among either Republicans or Democrats. Instead, responses appear to be driven less by partisan alignment than by the perceived legitimacy of the messenger, with the non-partisan, Native attribution producing the most consistent effects across partisan groups. In Survey 2 (Braves), the Democrat Cue was able to shift support in ATEs under DV2—Name, only. In terms of partisan response across cues, Republicans demonstrated an increase in support for change under the Native, White, and Republican cues, with a depressive effect under the Democrat cue, but no shift was statistically significant. Democrat respondents increased their level of support under the Native cue only for DV1 (General), DV2 (Name) and DV4 (Chop).
Importantly, the limited effectiveness of partisan cues in the Braves context may also reflect characteristics of the messengers themselves rather than a rejection of partisan signals per se. The partisan messengers used in this study (i.e., leaders of college Democratic and Republican organizations) may not have carried sufficient salience or perceived authority to activate partisan heuristics, particularly in a less overtly political domain such as professional sports. To the extent that partisan cue-taking depends on messenger recognizability and relevance, these results likely provide a conservative estimate of the potential influence of stronger partisan elites.
A further consideration is statistical power. Republicans constitute a smaller share of the sample, and treatment effects in the Braves context are already constrained by strong fan identification. The Republican treatment condition is modestly underpowered, particularly for detecting small-to-moderate effects. The uniformly positive effects for White, Native, and Republican cues and depressive effect under the Democrat cue, but statistically insignificant coefficients observed among Republican respondents, are consistent with this possibility. Importantly, this does not alter the core conclusion that partisan cues are less effective than Native attribution in this context, but it suggests caution in interpreting null effects among Republicans as definitive evidence of non-responsiveness.
Prior scholarship argues that inter-group negotiation over Native mascots is unlikely to succeed because defenders benefit from White racial hegemony and “challengers must either align themselves with pro-sports values or reconfigure the status quo” (Williams Reference Williams2025, 7; Callais Reference Callais2010). The findings here both affirm and complicate this account. While strong fan identification and symbolic attachment clearly constrain the scope of persuasion, Native attribution nonetheless produces consistent attitudinal shifts across respondent groups. Rather than requiring alignment with dominant pro-sports frames, Native messengers appear able to mobilize moral authority and claims of standing to shift opinion even among non-Native audiences.
Particularly in the Braves survey, we see that the legitimacy of the messenger and local context matter a great deal. The results in the Native treatment group may be partially explained by the strength of the speaker herself. In choosing Fawn Sharp of NCAI, the speaker represents more than one tribe on the issue and is seen as an elected voice of those multiple tribes. This may contradict any pre-existing information fans have about the teams’ practices, specifically narratives received from the franchise. In terms of the context, the forced removal of tribes from the southeast in the 1800s has created a low-proximity, low-information environment for Braves fans. In other words, these fans are far less likely to encounter Native people, tribal communities, or counter-narratives to Native appropriation than those in other markets with larger tribal populations. Therefore, these respondents may be more open to persuasive arguments from a messenger they believe to represent broad tribal interests in absence of strong pre-existing attitudes about Native policy preferences. While hegemonic fan identities limit the magnitude of change, they do not fully insulate attitudes from challenge.
Limitations
First, while the study highlights interesting findings regarding messenger identity and support for mascot change, it is unclear if these results might hold for other key policy fights for Native advocates. While this issue is salient for residents in certain states and school districts, there are other issues that are more pressing for Tribal Nations that impact sovereignty—such as legal jurisdiction, access to water and treaty-granted resources, and economic development. The survey results are specific to a policy preference that is more symbolic and racialized in nature. However, the underlying questions examine similar mechanisms of power. We may consider, for example, the aftermath of the McGirt decision (2020) on public opinion regarding tribal court jurisdiction. The decision allowed tribal courts to regain jurisdiction over certain criminal matters. In the aftermath of McGirt, tribal courts in Oklahoma saw an influx of new cases, leading these courts to make additional requests to the federal government for capacity grants. A national survey may indicate broad support for funding as Tribal Nations regain sovereignty over matters on reservation land. However, localized surveys in Oklahoma, where tensions between settling populations and Tribal Nations have been a structural feature of the state, might show higher racialized resentment from non-Native residents, and less support for funding based on proximity to the tribal courts in question. When tribes seek to take back control of intellectual property, jurisdiction, and expand resources, there are parallel dynamics of authority, legitimacy, and racialized backlash that shape public and political responses.
The second is that the national survey did not include a question regarding fandom. As such, I was unable to evaluate for Survey 1 whether the treatment effects may have been diminished by high levels of fandom for the Chiefs, Braves, Blackhawks, college teams like the Florida Seminoles, or even teams with recent name changes like the Cleveland Indians or Washington Redskins. However, results from Survey 2, where fandom was explicitly measured, suggest that fandom operates as a moderating factor rather than an alternative explanation. This pattern is consistent with the interpretation that fandom conditions receptivity to change without fully driving opposition or support.
Conclusion
Native advocates have spent decades pushing for the end of cultural mascots as a policy priority, a public opinion campaign that has been waged with corporate franchises and state and local governments. Changing the franchise branding of a professional sports team has clear ties to shifts in public opinion about race, ethnicity, and the ever-changing roles of these franchises in responding to their fanbase (constituency). While recent research has set the stage for assessing the impact of new narratives of Indigenous justice on support for Native policy priorities, advocates must still make decisions on who to bring into their coalition and who may speak on their behalf. These results may be helpful to tribal advocates in considering how to deliver messages on tribal policy priorities to different constituency groups, at least on mascot policy.
The timing of these surveys is important for interpreting the results, as they were fielded during distinct phases in the evolving public discourse on racial equity. The Georgia survey took place in 2021 pro-Diversity, Equity, and Inclusion (DEI) efforts during the early Biden administration. While Native sovereignty is a distinct legal and governance issue unlike most DEI policy, the racialized nature of mascot policy and executive rhetoric have nevertheless tied these debates to DEI. This period followed the nationwide protests associated with the Black Lives Matter movement and was marked by widespread institutional commitments to racial justice by government and corporations. The thought of a major professional sports franchise changing its name and imagery was not so far-fetched as the Guardians and Commanders had just finalized their changes; “End Racism” still graced the end zones of all NFL games—a symbolic gesture to fans who were concerned about racial equity. The national survey, however, took place in 2022 after many states had started to file legislation in a more formal push against DEI efforts (Conyers and Fields Reference Conyers and Wright Fields2025). In 2026, the current political climate is one of extreme hostility toward racial equity initiatives, as evidenced by President Trump’s condemnation of New York State’s policy. “Forcing them to change the name, after all of these years, is ridiculous and, in actuality, an affront to our great Indian population,” said Mr. Trump via social media. “What could be wrong with using the name, ‘Chief’? I don’t see the Kansas City Chiefs changing their name anytime soon!” (Closson Reference Closson2025). This rhetorical environment further raises the bar for persuasion, particularly among respondents for whom partisan or fan identity is deeply entrenched. As Philip Deloria (Reference Deloria and Hoxie1996) explains, “The virulent response to Indian protests against Indian mascots demonstrates the deep emotional investment many Americans have made both in their imagining of Indian people as ahistorical symbols and in their sports affiliations.” That Native attribution continues to produce measurable shifts in support even under these conditions underscores the durability of Indigenous messengers, albeit conditionally, in shaping public attitudes.
These results also suggest that messenger identity can meaningfully shape public attitudes, particularly on charged issues like team names. While messengers clearly matter, strong fanbases still pose significant challenges for policy change. Native advocates achieved notable victories with teams like the Washington Redskins and Cleveland Indians, but as remaining franchises feature more “neutral” names and imagery, shifting public opinion may prove more difficult. Nonetheless, the results here indicate that progress is possible, particularly when Native voices lead that messaging. Moving forward, the challenge for Native advocates lies not only in changing public sentiment but in doing so strategically and sustainably. This study underscores the importance of tailoring messages to specific audiences, especially where emotional or cultural attachments may generate resistance.
The findings in this study bolster the work of the First Nations Development Institute and EchoHawk Consulting (2018), demonstrating that when non-Native respondents are exposed to the new narratives about Native people from Native people, they have the capacity to increase positive associations with policies of Native concern. Importantly, the findings also indicate that the message itself is not enough to shift support and that assigning a non-partisan Native (or in some cases White) speaker is likely to make a larger impact on changing minds. This is an important consideration as tribal leaders weigh whether to spend precious political capital on such policy campaigns versus other priorities for their nations.
Supplementary material
The supplementary material for this article can be found at https://doi.org/10.1017/rep.2026.10098.
Acknowledgements
The author would like to thank Alexa Bankert, Geoffrey Sheagely, Joseph Ornstein, and Roberto Carlos for their invaluable support and direction on this project. She would also like to thank Ray Foxworth for his early guidance. Finally, she thanks the three reviewers who greatly strengthened this manuscript for publication through their thoughtful feedback.
Funding statement
The CCES is partially funded by the National Science Foundation. Local survey funding provided by the Alston Fund at the School of Public and International Affairs, University of Georgia.
Competing interests
The author declares none.





 Open access

