INTRODUCTION
The International Sanctuary for the Protection of Mediterranean Marine Mammals, also called Pelagos, was established in 2002. Reasons for its creation were research promotion, protection of cetaceans from multiple threats, and enforcement of the international legal measures to maintain the heritage (Notarbartolo di Sciara et al., Reference Notarbartolo di Sciara, Agardy, Hyrenbach, Scovazzi and Van Klaveren2007). Pelagos is a widespread area of over 87,500 km2 extending into the north-western Mediterranean Sea and characterized by a multitude of patchy zones with favourable conditions for biological productivity. This area is a semi-basin with a widely extended bathyal plain at around 2500 m deep associated with a narrow continental shelf in the western part (on about 5 km) and a more extended shelf in the east (more than 10 km). The two large islands of Corsica and Sardinia divide the horizontal circulation into two strong currents, joining and forming the Liguro-Provenco-Catalan Current, which flows south-westward along the coast. The spatio-temporal variability of this current depends on atmospheric patterns that induce heat and water losses (Béthoux et al., Reference Béthoux, Prieur and Bong1988; Astraldi & Gasparini, Reference Astraldi and Gasparini1992) and also on multi-scale interactions developed on the horizontal and vertical axes by a frontal zone, deep water formation, meso-scale meanders and freshwater inputs (Boucher et al., Reference Boucher, Ibanez and Prieur1987; Béthoux et al., Reference Béthoux, Prieur and Bong1988; Millot, Reference Millot1999; Manca et al., Reference Manca, Burca, Giorgetti, Coatanoan, Garcia and Iona2004). Moreover, topographic structures such as submarine seamounts and canyons have strong influences on hydrological processes. Due to the combination of these complex features, the north-western Mediterranean Sea is one of the most productive areas of the Mediterranean Sea, and is therefore characterized by a high biodiversity (Franqueville, Reference Franqueville1971; Viale, Reference Viale and Barnes1985; Caddy et al., Reference Caddy, Refk and Do-Chi1995; Estrada, Reference Estrada1996; Andersen et al., Reference Andersen, Vilan, Caparroy and Gubanova2001). This diversity of species includes fewer subtropical species than other sub-basins due to colder conditions during the winter (Astraldi et al., Reference Astraldi, Bianchi, Gasparini and Morri1995). However, the Mediterranean Sea is not in a steady state because of global warming (Béthoux et al., Reference Béthoux, Gentili, Raunet and Tailliez1990), which has lead to biological modifications, especially in the Ligurian Sea (Astraldi et al., Reference Astraldi, Bianchi, Gasparini and Morri1995; Bianchi, Reference Bianchi2007). The environmental changes associated with modifications of the coastal landscape due to human density (Meinesz, Reference Meinesz, Lefevre and Astier1991), chemical releases by agriculture and industry (ARPAL & Regione Liguria, 2002), increases in tourism, and intensity of marine traffic (European Environment Agency, 1999) are becoming a threat to Pelagos.
The establishment of Pelagos was an instrument aiming at mitigating anthropological pressures and protecting species richness (Jones, Reference Jones1994). However, considering its vast area, its efficiency depends on our knowledge of the species distribution contained within. Since the north-western Mediterranean Sea mainly acts as a feeding ground for cetaceans (Viale, Reference Viale and Barnes1985; Notarbartolo di Sciara et al., Reference Notarbartolo di Sciara, Agardy, Hyrenbach, Scovazzi and Van Klaveren2007), availability of food is assumed to be the driving force of their distribution (Littaye et al., Reference Littaye, Gannier, Laran and Wilson2004; Gannier & Praca, Reference Gannier and Praca2007). But, considering that prey abundance is not easily assessable, most statistical models are based on oceanographic descriptors (Redfern et al., Reference Redfern2006). Some of the surface data are assessed by remote-sensing while vertical profiles of water structures depend on in situ observations or models; both of these types of oceanographic information have been exploited for studying cetacean habitat preferences (Davis et al., Reference Davis2002; Littaye et al., Reference Littaye, Gannier, Laran and Wilson2004). Within the Pelagos area, previous studies reported partial information on depth and offshore distance preferred by cetaceans (Gannier, Reference Gannier2002; Panigada et al., Reference Panigada, Notarbartolo di Sciara, Zanardelli Panigada, Airoldi, Borsani and Jahoda2005; Moulins et al., Reference Moulins, Rosso, Nani and Würtz2007). Some remote-sensing data correlations have been proposed for a few species (Littaye et al., Reference Littaye, Gannier, Laran and Wilson2004; Gannier & Praca, Reference Gannier and Praca2007). However, some heterogeneity is still observed over the predicted suitable habitats due to unknown factors. The geographical distribution inside Pelagos is poorly reported (see fin whale Balaenoptera physalus modelling by Monestiez et al., Reference Monestiez, Dubroca, Bonnin, Durbec and Guinet2006). Because of the concentration of anthropogenic pressures, it is fundamental to assess if local hotspots for recurrent sightings exist and to describe them for specific species according to their relative constraints.
For the first time, this study proposes a method to delineate small-scale key areas inside Pelagos, according to spatial sighting distribution, referred to here as hotspots and coldspots. The analysis was conducted in the northern part of Pelagos, where most of the anthropogenic impacts are concentrated (see the review of the European Environment Agency, 1999). All surveys covering this area have been analysed, allowing for the production of preliminary maps of distribution of the most frequently observed species. The key areas are delimited for fin whales, sperm whales (Physeter catodon), Cuvier's beaked whales (Ziphius cavirostris), Risso's dolphins (Grampus griseus), and striped dolphins (Stenella coeruleoalba), and results are discussed according to the diet of each species.
MATERIALS AND METHODS
Collection of sightings data
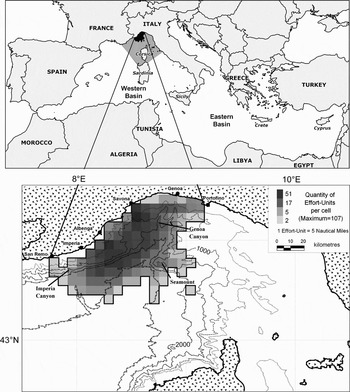
The fleet conducting the Pelagos monitoring was composed of four whale-watching boats larger than 15-m in length (from the operators ‘bluWest’ and ‘Liguria Viamare-WWF Liguria’) and one 11-m semi-rigid hull boat (from the Biology Department, University of Genoa). Surveys were carried out on a total of 318 d from May to September of 2004–2006, with more than 100 surveys each year. Surveys without good meteorological conditions (with a wind speed of up to 28 km h−1 and a sea state less than or equal to 4 on the Douglas scale) were excluded from analyses. The monitoring area extended from the coast to the 43°21′N latitude and between the 7°45′ and 9°11′E longitudes inside the northern part of Pelagos, accounting for more than 7300 km2 (Figure 1). Both offshore and coastal waters were covered in the study area in order to monitor all Pelagos species.
The large geographical context map delineates the Pelagos Sanctuary (in grey) inside the Mediterranean Sea and the monitored area with the distribution of the 3285 effort-units covered during the three years, totaling about 30,049 km. The 500, 1000, 1500, 2000 and 2500 m isobaths are symbolized.

The same sighting protocol was adopted by all vessels. When the meteorological conditions allowed an effective survey, the on-effort monitoring activity was conducted at a speed of approximately 13 km h−1. At least three trained observers were placed on the upper-deck to scan 360° around the boat with and without binoculars. The elevation of the upper-deck was variable according to dimensions of the vessels, and ranged from 4 to 7.5 m above sea level. On each vessel, observers rotated quadrants every 30 minutes to avoid fatigue. The real-time position was recorded for all surveys and when cetaceans were spotted, and distance sampling data were also reported on a special sheet (estimated detection distance, detection angle between animal direction and boat heading). Then, animals were approached, adapting the vessel speed and heading to the animals according to the ACCOBAMS' guidelines (http://www.accobams.org), to identify species, estimate specimen numbers and mark their global positioning system position.
Data elaboration
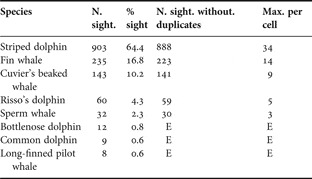
The aim of this work was to identify all locations where the cetaceans occurred at significantly greater frequencies than expected, called hotspots, and those with significantly lower frequencies than expected, called coldspots. Therefore, on-effort tracks and sightings were distributed on the grid of the studied area with a cell size of 5′ × 5′. The base unit of effort for this study was defined as 5 nautical miles (n.m.) carried out within one cell. This definition has been set according to cell size. ‘Monitored cells’ are cells where a minimum of one effort-unit has been covered by one or more vessels during one day. All sightings occurring on cells covered by less than 5 n.m. were excluded from the analysis. To avoid repetition of the same sightings made by different vessels on the same day, only the first chronological record was maintained per cell for that day. Thus, 12 fin whale sightings, two sperm whale sightings and two Cuvier's beaked whale sightings were removed with their associated linetrack in the sighting cell (Table 1). On the final grid (overlaying the three years of work), cells with only one effort-unit were also excluded due to the absence of repetition of sightings across days. The final effort-unit distribution, referred to hereafter as the effort distribution, presents the effective monitoring inside the studied area without the duplicated records and their associated linetracks (Figure 1). Finally, the total of effort-units surveyed is N = 3285 (representing 30,049 km) distributed on 111 cells.
The number of sightings collected during the three years (N. sight.), their importance as a percentage of the total (% sight.), the number of sightings without duplicates (N. sight. without duplicates), and the maximum of sightings without duplicates obtained per cell (Max. per cell).

E, excluded in the analysis.
Monte Carlo analysis
The Monte Carlo method was used to generate simulations that take into account our effort distribution, in order to provide theoretical distributions of the sightings. Then, the simulated output distributions are compared to the observed distribution. This mathematical tool enables us to organize locations of sightings inside the northern Pelagos Sanctuary (north-western Mediterranean Sea) into hotspots and coldspots. Compared to the usual statistical methods, the test is based on stochastic analysis independent from the descriptive variables. The null hypothesis assumes that cetaceans are randomly distributed over the overall studied area. In such cases, the sighting probability should be proportional to the effort-unit distribution. Thus, sighting repetitions should be more probable where a high quantity of effort-units have been covered. To test the null hypothesis in regard to the distribution of one particular cetacean (of n sightings), we use the Monte Carlo method. Each simulation consists of randomly extracting one subset of n effort-units from the total set of effort-units N (=3285). For example, assuming that we have monitored 10 cells, covering 5 effort-units in each cell, and assuming that during the survey, 20 sightings all occurred in the same x cells, we extract from the available 50 effort-units one subset of 20 effort-units in order to test our null hypothesis. If the extraction has 20 hits in the x cell, the null hypothesis is accepted; if not, it is rejected. Computing multiple simulations, we repeatedly extract 10,000 different subsets, and the ‘P-value’ probability represents the number of times that we obtain 20 hits on the x cell divided by the total number of simulations (=10,000). Thus, this method provides the possibility to determine cells where the species was encountered at a significantly greater frequency than expected (hotspots) and those with a significantly lower frequency than expected (coldspots). For instance, in our study, we have 141 sightings of Cuvier's beaked whales distributed over 49 cells. Therefore, 141 effort-units are randomly extracted 10,000 times from N. After the 10,000 extractions, we calculate the ‘P-value’ for the 111 cells (the total number of surveyed cells in the study area). For each of the 49 cells where whales were sighted, we test if the cells are significantly positive (hotspots). A cell is significant (in a hotspot) when less than 500 simulations give at least the same quantity of hits as the quantity of the actual sightings (where the P-value is lower than 500/10,000). For each of the remaining 62 cells where the whales were absent, we test which cells are significant coldspots. A cell is significant (in a coldspot) when less than 500 simulations give no hits inside the cell (P ≤ 0.05).
RESULTS
During three years of monitoring in the northern part of Pelagos, 1402 on-effort sightings occurred on the 30,049 km covered. The most regularly encountered species were the striped dolphin, representing 64.7% of all sightings, fin whale (16.8%) and Cuvier's beaked whale (10.2%, Table 1). The bottlenose dolphin (Tursiops truncatus), the common dolphin (Delphinus delphis) and long-finned pilot whale (Globicephala melas) represented a low percentage of the total of sightings (respectively 0.8%, 0.6% and 0.6%).
According to the data elaboration presented before, we analysed all effort-units of the 111 cells from May to September over the three years. The number of cells with sightings was proportional to the number of sightings for each species (see Table 2). Thus, the most encountered species, the striped dolphin, is the most widely distributed (in 89 cells). Fin whales and Cuvier's beaked whales are both present in about half of the monitored cells (56 and 49 cells, respectively). The two less frequent species described in this analysis are Risso's dolphins, occurring in 40 cells, and sperm whales in 23 cells.
The number of cells where sightings occurred without duplicates (Cells with sight.) or without sightings (Cells without sight.), their relative quantity with significant higher frequency of occurrence than expected (Significant hotspot) or with significant lower frequency of occurrence than expected (Significant coldspot), and their relative percentage of the cells with or without sightings.

From the total of cells where cetaceans occurred, the Monte Carlo method allows us to discriminate significant hotspots (Table 2). Hotspots are cells where the species occurred at a significantly greater frequency than expected. For instance, 41.6% of cells where the striped dolphins occurred are significant hotspots (37 positive cells on 89). This value indicates a high fidelity of the species to many areas while the distributions of the other species were more confined. The quantity of significant hotspots decreases with the quantity of cells with sightings. A third of cells where fin whales were sighted were significant hotspots; a quarter of the cells with Cuvier's beaked whale sightings were hotspots, and less than one-fifth of cells with sightings of sperm whales and Risso's dolphins were hotspots.
In the total number of cells where cetaceans were absent, the Monte Carlo simulation indicates significant coldspots. In the results of Table 2, the number of significant coldspots is independent from the quantity of cells without sightings. Thus, the percentage of significant coldspots of the cells with striped dolphins or with fin whales were equivalent (18.2%). Results indicate that fin whales are significantly absent in ten cells and striped dolphins are significantly absent in four. No coldspot has been identified for either Risso's dolphins or sperm whales.
Distribution of striped dolphins
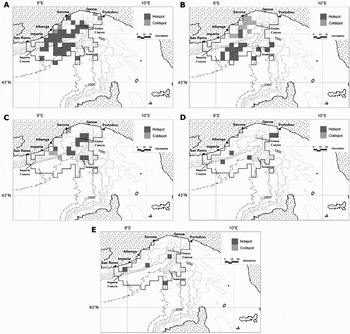
The striped dolphin is the most widely distributed species in the zone, with sightings ranging from the shore to the offshore extremity of the monitored area, at variable depths (Figure 2A). Some specific places seem more attractive, such as the Genoa Canyon. There, striped dolphins are frequently seen beyond the 1000 m isobath, along the north-western canyon wall, following the coastal direction almost up to the south-western limit of our study area. No cell was significantly positive in the core of the canyon, where waters are 2000 m deep, but some hotspots are present at the opening of the Genoa Canyon and on its opposite extremity. The species mainly avoid areas along the coast, especially the area of around Porto Fino, in the extreme east.
Distribution of coldspots (cells where species occurred at significantly lower frequencies than expected, in light grey) and hotspots (cells where species occurred at a significantly greater frequency than expected, in dark grey) for: (A) striped dolphins; (B) fin whales; (C) Cuvier's beaked whales; (D) Risso's dolphins; and (E) sperm whales. For the two last species, no coldspot has been established.

Distribution of fin whales
Fin whale distribution showed a clear southward gradient, with 14 hotspots in the southern part of the study area and nine coldspots along the coast, particularly where the monitoring was intensive (Figure 2B). No significant results were obtained over the Genoa Canyon or along the north-eastern coast. Most of the hotspots were aggregated over waters deeper than 2000 m, especially in the mid-southern part of the study area. Furthermore, no significant results were obtained in the extreme west. However, the bathyal plain was not the only area where fin whales were frequently sighted; five hotspots were located between the 1000 m and 1500 m isobaths. Two of these were off Savona and three were in the south-eastern part, with one specifically on the wall of the seamount.
Distribution of Cuvier's beaked whales
Cuvier's beaked whales were significantly more abundant in the Genoa Canyon, especially in waters ranging from 1000 to 2000 m depth, and in the south-western opening of the canyon (Figure 2C). Another hotspot aggregation was atop the seamount summit located in the south-eastern part of the study area. Coldspots were obtained mainly along the coast, even though the surveys were intensive in these areas (due to port position). No significant cell was found in the south or over water deeper than 2500 m, nor along the northern coast before the 1000 m depth contour.
Distribution of sperm whales and Risso's dolphins
Due to the low number of aggregations of Risso's dolphins and sperm whales, only a few cells were found to be significant hotspots, and no cell was demonstrated to be a significant coldspot by the Monte Carlo method (Table 2). The distribution of Risso's dolphin indicates three hotspots at water depths of approximately 1000 m. One cell was at the opening of the Genoa Canyon and one was along the base of the continental slope off Imperia Canyon in the western part of the study area (Figure 2D). The sperm whale distribution highlights four hotspots: two hotspots were in canyons (on the 2000 m isobath of the Genoa Canyon and in shallow waters around Imperia Canyon) (Figure 2E); one hotspot was found along the continental slope off Imperia Canyon; and the last one was found at a depth exceeding 2500 m.
Interspecific comparisons of habitat
Cetacean species observed in the Pelagos Sanctuary have clearly different habitats with very few overlays. Striped dolphins and fin whales both used the bathyal plain in the south of the study area, as opposed to the beginning of the continental slope, where mainly striped dolphins were frequently observed. Four species frequently inhabited the Genoa Canyon area: striped dolphins, Cuvier's beaked whales, sperm whales and Risso's dolphins. The first was mainly present on the north-western border, the second species shares the upper part of the canyon with dolphins, which are also frequent in the deep part of the canyon, and the third species was observed in the middle of the canyon where both striped dolphins and Cuvier's beaked whales were absent. Finally, the fourth species was frequently observed at the opening of the canyon where the Cuvier's beaked whale was absent, but shared the area with striped dolphins. With respect to the seamount present in the south-eastern part of the study area, Cuvier's beaked whales were observed atop the seamount summit (on 2 cells) rather than at the base of the seamount, as preferred by the fin whale (1 cell is around the seamount). The western area and most of the coastal waters were less frequented by cetaceans as shown by the absence of significant results.
DISCUSSION
This work presents the initial results obtained through three years of monitoring the five most encountered species in the northern part of the Pelagos Sanctuary, including the poorly known Cuvier's beaked whale. Results indicate locations where the study species are significantly absent and those where the species are often sighted, describing habitat preferences for each species. Results also establish locations with ecological overlays for different species and other locations with ecological preferences (hotspots) for only one species. Considering that the Pelagos Sanctuary is mainly a feeding ground for the cetacean population, these ecological preferences should be mostly related to their diet (Aïssi et al., Reference Aïssi, Celona, Comparetto, Mangano, Würtz and Moulins2008). Indeed, the Pelagos area seems to only serve as a transitorily breeding ground (see, for instance, sperm whale movements in Drouot-Dulau & Gannier, Reference Drouot-Dulau and Gannier2007). Feeding behaviours are regularly observed in Pelagos: fin whale activities are typically dedicated to foraging according to their particular diving profiles (monitored by tags by Panigada et al., Reference Panigada, Zanardelli, Canese and Jahoda1999) and according to their typical surface pattern (determined by blow count, swimming velocity and swimming directivity, as in Gannier, Reference Gannier2005). Likewise, the diving behaviour of sperm whales (Drouot & Gannier, Reference Drouot and Gannier2004; Watwood et al., Reference Watwood, Miller, Johnson, Madsen and Tyack2006) and Cuvier's beaked whales (Johnson et al., Reference Johnson, Madsen, Zimmer, Aguilar de Soto and Tyack2004) demonstrated that both of these species forage. Their feeding activity depends on their relative prey abundance. Based on our observations, fin whales appear to be more frequent in waters with depths between 2000 and 2500 m, and seem to be rare along the coastline. This result is consistent with previous studies undertaken in the north-western Mediterranean Sea indicating that the species is predominantly observed in the pelagic waters. Gannier (Reference Gannier2002) observed 274 sightings at a mean shoreline distance of 45.3 km and in waters with an approximate depth of 2295 m. Panigada et al. (Reference Panigada, Notarbartolo di Sciara, Zanardelli Panigada, Airoldi, Borsani and Jahoda2005) have 540 sightings at a mean distance of 45.6 km from the coast with an average depth of 2317 m. Indeed, during the summer, fin whales feed on Meganyctyphanes norvaegica, a species of Euphausiid especially concentrated in the north-western Mediterranean Sea (Viale, Reference Viale and Barnes1985; Astruc & Beaubrun, Reference Astruc, Beaubrun, Evans and O'Boyle2001). According to McGehee et al. (Reference McGehee, Demer and Warren2004) the summer night-time krill distribution is extremely patchy and seems to be associated with a peak in the chlorophyll distribution. Considering that the Liguro-Provencal Current brings colder nutrient-rich waters to the surface, in oligotrophic waters chlorophyll concentrations can be used as a predictor for fin whale aggregations (Littaye et al., Reference Littaye, Gannier, Laran and Wilson2004). Our analysis also identified another location that seems to be prevalent for the species as whales frequently visit the base of the seamount located in the southern part of the Pelagos. Whale presence may be due to seamount topography interacting with currents, leading to vertical motions of Euphausiids and enhancing zooplankton patchiness in the seamount neighbourhood (Haury et al., Reference Haury, Frey, Newland and Genin2000; Valle-Levinson et al., Reference Valle-Levinson, Castro, Gutiérrez de Velasco and Gonalez Armas2004).
The bathymetric distribution of the striped dolphin is similar to that of the fin whale, but instead of being concentrated beyond 2000 m, striped dolphin concentrations can also be found on the continental slope. This partition in zones of the dolphin distribution has been previously noted by Gannier (Reference Gannier1999) and may be due to their diet. The striped dolphin is an opportunist; it feeds on a large spectrum of prey, composed of epi- and meso-pelagic fish and meso-pelagic squids (Würtz & Marrale, Reference Würtz and Marrale1993; Blanco et al., Reference Blanco, Azanar and Raga1995). Moreover, their relative absence beyond 2500 m is confirmed by the results of Gordon et al. (Reference Gordon, Matthews, Panigada, Gannier, Borsani and Notarbartolo di Sciara2000) indicating that with both acoustic and visual surveys, the encounter rate (number of sightings by surveyed kilometre) is maximal at 2250 m and decreases beyond 2500 m. Striped dolphins also appear frequently in the Genoa Canyon, mainly on its western border. Similarly to the seamount, canyons are topographic structures interacting with hydrographical processes which results in a relatively persistent habitat for upper-trophic level marine predators (Yen et al., Reference Yen, Sydeman and Hyrenbach2004).
Cuvier's beaked whale is sighted frequently in waters between 1000 and 2000 m in depth. The depth affinity is similar to the results of Moulins et al. (Reference Moulins, Rosso, Nani and Würtz2007) who obtained a majority of their encounters between the 1389 and 2021 m depths in the north-western Mediterranean Sea. However, Cuvier's beaked whales are mainly concentrated in the Genoa Canyon and atop the seamount summit (with 2 significant hotspots). The species is mainly teuthophageous in the Mediterranean Sea (Blanco & Raga, Reference Blanco and Raga2000; Santos et al., Reference Santos, Pierce, Herman, López, Guerra, Mente and Clarke2001); its presence in canyons or around the seamount may result from the cephalopod abundance there (Nesis, Reference Nesis and Okutani1993; Moulins & Würtz, Reference Moulins and Würtz2005). Cuvier's beaked whales prey on cephalopods known to be oceanic and meso- or bathypelagic; in particular, the Histioteuthidae family is prominent in its diet (Blanco & Raga, Reference Blanco and Raga2000).
This analysis provides preliminary indications of the ecological importance of some locations inside the Pelagos Sanctuary, using a simple, but realistic new methodology. The advantage of this method mainly resides in the absence of initial assumptions, especially with regard to the normality of the distribution. It is therefore possible to determine the significant influence of a descriptor even if the correlation does not follow a normal law. In this study, the method is particularly powerful considering that the effort distribution is not homogeneous. However, the degree of accuracy of Monte Carlo methods depends on the sample size. With a lower quantity of effort, the quantity of simulations should be increased.
The cetacean affinities can be used by the stakeholder of the Pelagos Sanctuary in order to dedicate more mitigation efforts to protecting hotspots. It is obvious that locating cetacean hotspots is the first step for conservation measures, especially when the area might have an increasing anthropogenic pressure. Focusing on the Genoa Canyon, the industrial harbour of Genoa is projecting to extend the container area over the water domain. This project, in the core of the Pelagos Sanctuary, might deeply alter some of the identified critical habitat of the Cuvier's beaked whale (MacLeod & Mitchell, Reference MacLeod and Mitchell2006). Moreover, the increase of commercial sea traffic will generally affect the whole Pelagos area, leading to more chemical and acoustic pollution affecting all the cetacean community members and may also increase collision probability for sperm whales and fin whales (see the review of threats in Notarbartolo di Sciara et al., Reference Notarbartolo di Sciara, Agardy, Hyrenbach, Scovazzi and Van Klaveren2007). Absence of anthropogenic effect limitation may endanger cetacean habitats, especially if this area is one of the feeding grounds in the Mediterranean Sea. This may provoke biodiversity loss, especially considering that these cetacean species may be genetically isolated from their neighbouring populations (striped dolphins: Archer, Reference Archer1996; Bourret et al., Reference Bourret, Macé and Crouau-Roy2007; fin whales: Bérubé et al., Reference Bérubé1998; Cuvier's beaked whales: Dalebout et al., Reference Dalebout, Robertson, Frantzis, Engelhaupt, Mignucci-Giannoni, Rosario-Delestre and Baker2005; sperm whales: Drouot et al., Reference Drouot, Bérubé, Gannier, Goold, Reid and Palsbøll2004; Engelhaupt, Reference Engelhaupt2004; Risso's dolphin: preliminary results of Gaspari et al., Reference Gaspari, Airoldi and Hoelzel2007).
ACKNOWLEDGEMENTS
This work was partially funded by the Italian ‘Ministero dell'Ambiente e della Tutela del Territorio’ and ACCOBAMS. Surveys conducted by the Biology Department of the University of Genoa were sponsored by Yanmar and SACS Boatyard. We are grateful to the many people involved in the Pelagos Monitoring Campaign: the bluWest whale watching company, in particular Albert Sturlese; the Consorzio Liguria Viamare and the WWF Liguria, in particular Roberta Trucchi; the Woods Hole Oceanographic Institution, particularly Peter Tyack, Mark Johnson and Alex Bocconcelli; and all our students who collected the data. Special thanks also go to Agostino Corsi, Marta Gozalbez, Gaël Hubert, Ana Parejo Fernández, and Paola Tepsich who contributed to data elaboration, and to GEASIT s.r.l. in particular Massimo D'Incà for the Geographical Information System support. Luca Ferraris, Jost von Hardenberg and Antonello Provenzale provided guidance on analysis. Tomah Phenix is also thanked for the English corrections. Three anonymous referees made helpful comments on the manuscript.