

Introduction
Following Parfit (Reference Parfit1984), there are three main accounts of wellbeing – objective lists, preference satisfaction and mental states (or subjective wellbeing) – and all three are important for public policy. There has been a focus on objective lists in much of social policy (Dean, Reference Dean2009) and economists have typically thought of wellbeing in terms of preferences (Harsanyi, Reference Harsanyi1997). There is now increasing interest in the measurement and use of subjective wellbeing (SWB) for policy purposes. The highly cited Stiglitz et al. (Reference Stiglitz, Sen and Fitoussi2009: 16), for example, states that:
Research has shown that it is possible to collect meaningful and reliable data on subjective as well as objective well-being. Subjective well-being encompasses different aspects (cognitive evaluations of one's life, happiness, satisfaction, positive emotions such as joy and pride, and negative emotions such as pain and worry): each of them should be measured separately to derive a more comprehensive appreciation of people's lives . . . [SWB] should be included in larger-scale surveys undertaken by official statistical offices.
In the UK, the Coalition Government's Budget 2010 Report (HM Treasury, Reference Treasury2010) stated that ‘the Government is committed to developing broader indicators of well-being and sustainability, with work currently underway to review how the Stiglitz [Commission] . . . should affect the sustainability and well-being indicators collected by Defra, and with the ONS [Office of National Statistics] and the Cabinet Office leading work on taking forward the report's agenda across the UK’. This paper and its motivation derives directly from the urgent need to consider how best to measure SWB in large samples.
There is increasing work on using SWB for economic and social policy (e.g. Donovan and Halpern, Reference Donovan and Halpern2002; Kahneman and Sugden, Reference Kahneman and Sugden2005; Layard, Reference Layard2005; Dolan and White, Reference Dolan and White2007; Edwards and Imrie, Reference Edwards and Imrie2008; Dolan and Peasgood, Reference Dolan and Peasgood2008; HM Treasury, Reference Treasury2008) but there is a need for a fuller consideration of, and conceptual clarity about, how SWB should be measured for policy purposes. Different approaches to measurement could have significant consequences for inferences drawn from SWB data. Importantly, some measures might be more or less amenable to change by individuals and policy-makers, thus impacting upon debates about agency in and over SWB (see Cooper and Lousada, Reference Cooper and Lousada2005; Ryan and Sapp, Reference Ryan, Sapp, Gough and McGregor2007; Taylor, Reference Taylor2011).
This paper aims to provide a methodological overview of the measurement of SWB and to make some recommendations about which measures should be used. In the next section, we outline the criteria for any account of wellbeing. This is followed by a discussion of the main accounts of wellbeing and in what contexts they are being employed, and we highlight some differences between them. In the fourth section, we outline the three main measures of SWB and discuss their usage to date. The penultimate section discusses some of the conceptual and methodological issues with the measures. We conclude by providing some specific recommendations about survey questions and present some general conclusions.
Accounts of wellbeing
In order for any account of wellbeing to be useful in informing policy-making, it must satisfy three general conditions. It must be: (i) theoretically rigorous; (ii) policy relevant; and (iii) empirically robust. By theoretically rigorous, we mean that the account of wellbeing is grounded in an accepted philosophical theory. This does not preclude it being subject to considerable controversy and criticism, of course. For more discussion on ‘what counts’ as theoretically rigorous, see Haybron (Reference Haybron, Eid and Larsen2008). By policy relevant, we mean that the account of wellbeing must be politically and socially acceptable, and also well understood in policy circles. Given different political, policy and stakeholder interests, no account is ever likely to receive wholesale endorsement but it must be generally acceptable to those using it and those affected by it, including the electorate. A fuller discussion of these issues is beyond the scope and focus of this paper, but the interested reader should consult Bok (Reference Bok2010).
By empirically rigorous, we mean that the account of wellbeing can be measured in a quantitative way that suggests that it is reliable and valid as an account of wellbeing. Ultimately, the measure should be sensitive to important changes in wellbeing and insensitive to spurious ones. In practice, distinguishing between the two is quite a challenge and often relies on judgement based on a priori expectations. The association between multiple measures can often provide useful guidance, where all measures moving generally in the same direction would be suggestive of important changes in wellbeing. These criteria are similar to those used by Griffin (Reference Griffin1986).
There are three accounts of wellbeing (Parfit, Reference Parfit1984; Sumner, Reference Sumner1996) that meet the three conditions (i) objective lists; (ii) preference satisfaction; and (iii) mental states (or SWB). We briefly describe the first two, which are well rehearsed, and focus more on SWB. Objective list accounts of wellbeing are based on assumptions about basic human needs and rights. In one of the best-known accounts of this approach, Sen (Reference Sen1999) argues that the fulfillment of these needs help provide people with the capabilities to ‘flourish’ as human beings. In simple terms, people can live well and flourish only if they first have enough food to eat, are free from persecution, have a security net to fall back on and so on. Thus, the aim of policy should be to provide the conditions whereby people are able to enhance their ‘capability sets’. The preference satisfaction account is closely associated with the economists’ account of wellbeing (Dolan and Peasgood, Reference Dolan and Peasgood2008). At the simplest level, ‘what is best for someone is what would best fulfil all of his desires’ (Parfit, Reference Parfit1984: 494).
SWB is a relative newcomer in terms of its relevance politically and its robustness empirically. Its theoretical rigour extends back to Bentham (Reference Bentham, Burns and Hart1996/1789) who provided an account of wellbeing that is based on pleasure and pain, and which provided the background for utilitarianism. Generally, SWB is measured by simply asking people about their happiness. In this sense, it shares the democratic aspect of preference satisfaction, in that it allows people to decide how good their life is going for them, without someone else deciding their wellbeing (Graham, Reference Graham2010).
There are some differences in the interpretation of agency in the SWB literature. Ryan and Sapp (Reference Ryan, Sapp, Gough and McGregor2007) believe that SWB concerns a person's capacity for optimal functioning, a confidence in being able to formulate and act to fulfil important goals and the motivation and energy to persist in the face of obstacles. Others believe that research in SWB reinforces particular social norms about what is desirable, which become a virtue that everyone can aspire to – but which are merely socially constructed (e.g., Edwards and Imrie, Reference Edwards and Imrie2008). It is important, however, for the different accounts of wellbeing not be conflated with one another, and that there is a clear separation between what is a determinant and what is an outcome of SWB. From the perspective of SWB, agency, social norms, virtues and individual behaviour are only important in so far as they have the ability to change the experiences of people's lives.
Of course, none of these issues would matter much in practical terms if the different accounts produced similar results – but they often do not. GDP, which is often used as a macro indicator of preference satisfaction since, all else equal, more (national) income allows us to satisfy more of our preferences, has been correlated with increases in life expectancy, an objective measure of wellbeing (Crafts, Reference Crafts2005). But there are some discrepancies. For example, GDP has also been correlated with objective measures suggestive of a lack of progress, such as increasing pollution and rising obesity (ONS, 2000, 2007). The evidence from the literature assessing the link between income and SWB is that this relationship is positive and modest (Stevenson and Wolfers, Reference Stevenson and Wolfers2008), although there are some differences depending on what measure of SWB is used (Kahneman and Deaton, Reference Kahneman and Deaton2010), and whether other people's income is included in the assessment (Luttmer, Reference Luttmer2005; Layard et al., Reference Layard, Mayraz, Nickell, Diener, Helliwell and Kahneman2010). We need to more carefully consider, even at a very general monitoring level, whether wellbeing has, in fact, gone up or down.
There are differences at the micro level too. For example, Peasgood (Reference Peasgood2008) used the British Household Panel Survey (BHPS) to examine objective wellbeing, preference satisfaction and SWB scores for the same individuals. She shows that there is a dramatic difference between the accounts for those with children, people who commute long distances, those with a degree and between men and women. Our choice of account of wellbeing could clearly have important implications for who we think of as doing well or badly in life.
Uses of the accounts
Ultimately, any account of wellbeing will be used for a specific policy purpose. We consider each of the three main policy purposes: (i) monitoring progress; (ii) informing policy design; and (iii) policy appraisal. Monitoring progress requires a frequent measure of wellbeing to determine fluctuations over time. Informing policy design requires us to measure wellbeing in different populations that may be affected by policy. Policy appraisal requires detailed measurement of wellbeing to show the costs and benefits of different allocation decisions.
Despite many unresolved questions about what should be on an objective list and how to weight the items on it, many governments and organisations have specific policies to target many of these needs (such as access to education and healthcare), suggesting that objective list accounts are an integral part of monitoring wellbeing. An example of this is the Human Development Index (HDI) (UNDP, 1990). By incorporating information on literacy rates and life expectancy (Hastings, Reference Hastings2009), the primary purpose of the HDI is to provide an alternative ranking of international development to that provided by GDP. It has been less useful in policy appraisal, where single measures of wellbeing, which weight the various components of wellbeing according to people's preferences or the impact they have on their life overall, are usually preferred (Srinivasan, Reference Srinivasan1994).
Perhaps the ‘exemplar’ monitoring account is preference satisfaction, through GDP, where rising incomes allow us to satisfy more of our preferences. According to standard theory, more choice allows us to satisfy more of our preferences and this idea has informed the design of policies in health and education. Preference satisfaction has also been used widely in policy appraisal. Cost–benefit analysis (CBA) values benefits according to people's willingness to pay (HM Treasury, Reference Treasury2003). Valuing benefits in monetary terms not only captures value in a single metric, it does so in a way that allows direct comparison to costs.
Most of the recent attempts at measuring SWB have focussed on providing information that can be used as inputs into monitoring progress. These attempts have been to generally move us away from focussing on the ‘ill-being’ reflected in rates of depression towards more positive notions of life satisfaction and positive affect (Lyubomirsky et al., Reference Lyubomirsky, King and Diener2005). Monitoring SWB could be important in ensuring that other changes that affect society do not reduce overall wellbeing. Similarities can be seen here between the current use of GDP, which is not used directly to inform policy but is monitored carefully, and sudden drops in SWB would have to be examined carefully and specific policies may then be developed to ensure it rises again.
Informing policy design requires the measurement of wellbeing in those populations affected by policy. For example, Friedli and Parsonage (Reference Friedli and Parsonage2007) cite SWB research as a primary reason for building a case for mental health promotion. More specifically, SWB could be used to make a strong case for unemployment programmes given the significant reduction in SWB associated with any periods of unemployment (Clark et al., Reference Clark, Diener, Georgellis and Lucas2004; Clark, Reference Clark, Diener, Helliwell and Kahneman2010). SWB can also be used for assessing the consequences of cigarette taxation (Gruber and Mullainatha, Reference Gruber and Mullainathan2005), air pollution (Luechinger, Reference Luechinger2009), flooding (Luechinger and Rasacky, Reference Luechinger and Raschky2009) and the risk of terrorism (Metcalfe et al., Reference Metcalfe, Powdthavee and Dolan2011). These are domains of policy that largely have a non-market consequence, and where SWB can potentially have a real impact on policy, especially as compared to preference satisfaction that focusses principally on changes in income.
Policy appraisal requires us to express the benefits of intervention in a single metric that can be compared to the costs of intervention. Using SWB data as a ‘yardstick’ could allow for the ranking of options across very different policy domains (Donovan and Halpern, Reference Donovan and Halpern2002; Dolan and White, Reference Dolan and White2007). Expected gains in SWB could be computed for different policy areas and this information could be used to decide which forms of spending will lead to the largest increases in SWB relative to their costs (Dolan and Metcalfe, Reference Dolan and Metcalfe2008). This is acknowledged in the current approaches to resource allocation from the UK government (HM Treasury, Reference Treasury2011).
It is possible to estimate monetary values for non-market goods from SWB data by estimating the amount of income that has exactly the same effect on SWB as the non-market good (Dolan et al., Reference Dolan, Fujiwara and Metcalfe2011). Alternatively, benefits can remain expressed in SWB units, as health benefits are often expressed in quality-adjusted life years (QALYs) (NICE, 2008). Indeed, the health economics literature is now showing that different quality of life weights would be derived from SWB data than from using more standard preference-based methods (Dolan and Kahneman, Reference Dolan and Kahneman2008; Dolan et al., forthcoming).
Measuring SWB
There have been many attempts to classify the different ways in which in SWB can be measured for policy purposes (Kahneman and Riis, Reference Kahneman, Riis, Huppert, Baylis and Kaverne2005; Dolan et al., Reference Dolan, Peasgood and White2006, Waldron, Reference Waldron2010). Here we distinguish between three broad categories of measure: (i) evaluation; (ii) experience; and (iii) ‘eudemonic’.
Evaluation measures
SWB is measured as an evaluation when people are asked to provide global assessments of their life or domains of life, such as satisfaction with life overall, health, job, etc. Economists have been interested in using life satisfaction for some time (see Frey and Stutzer, Reference Frey and Stutzer2002; van Praag and Ferrer-i-Carbonell, Reference van Praag and Ferrer-i-Carbonell2004). The main reason why this measure has been used most often is because of its prevalence in international and national surveys, including the BHPS (Waldron, Reference Waldron2010), and because of its comprehensibility and appeal to policymakers (Donovan and Halpern, Reference Donovan and Halpern2002).
Life satisfaction has been shown to be correlated with income (both absolute and relative), employment status, marital status, health, personal characteristics (age, gender, and personality) and major life events (see Dolan et al. (Reference Dolan, Peasgood and White2008) for a recent review). The findings have been found to be broadly similar across studies. Life satisfaction has also been shown to differ across countries in ways that can also be explained by differences in freedoms, social capital and trust (Halpern, Reference Halpern2010).
The use of various domain satisfaction questions has become prominent since the analysis of job satisfaction in labour economics (Freeman, Reference Freeman1978; Clark and Oswald, Reference Clark and Oswald1996). Life satisfaction can be seen as an aggregate of various domains (van Praag et al., Reference van Praag, Frijters and Ferrer-i-Carbonell2003, Bradford and Dolan, Reference Bradford and Dolan2010). The BHPS has a list of domain satisfactions (health, income, house/flat, partner, job, social life, amount of leisure time, use of leisure time), with partner satisfaction and social life satisfaction having the biggest correlation with life satisfaction (Peasgood, Reference Peasgood2008). There are some intuitively clear omissions in the BHPS, such as satisfaction with your own mental wellbeing and satisfaction with your children's wellbeing.
General happiness is sometimes used instead of life satisfaction in many international surveys (Waldron, Reference Waldron2010). Using happiness or life satisfaction yields very similar results, in terms of the impact of key variables. The Gallup World Poll has recently used Cantril's (Reference Cantril1965) ‘ladder of life’, which asks respondents to evaluate their current life on a scale from 0 (worst possible life) to 10 (best possible life). There are some differences between life satisfaction and the ladder of life, notably in relation to income (Helliwell, Reference Helliwell2008).
Evaluation can also refer to general affect. For instance, the Affect Balance Scale (Bradburn, Reference Bradburn1969), and the Positive and Negative Affect Scale (Watson et al., Reference Watson, Clark and Tellegen1988) elicit responses to general statements about affect. The General Health Questionnaire (GHQ) can also be classified as an evaluation of SWB. Huppert and Whittington (Reference Huppert and Whittington2003) show that the positive and negative scales are somewhat independent of one another and so we need to be cautious when considering the overall figures.
Experience measures
Experience is very closely associated with a ‘pure’ mental state account of wellbeing, which depends entirely upon feelings held by the individual. This is the Benthamite view of wellbeing, where pleasure and pain are the only things that are good or bad for anyone, and what makes these things good and bad respectively is their ‘pleasurableness’ and ‘painfulness’ (Crisp, Reference Crisp2006). This may be colloquially thought of as the feelings in any moment (e.g. happy, worried, sad, anxious, excited, etc.). Well-being is therefore conceived as the average balance of pleasure (or enjoyment) over pain, measured over the relevant period. There is some evidence, however, that positive and negative affect are somewhat independent of one another and should therefore be measured separately (Diener and Emmons, Reference Diener and Emmons1984).
Many existing measures tap into experienced wellbeing, such as the Ecological Momentary Assessment (EMA) (Stone et al., Reference Stone, Shiffman, DeVries, Kahneman, Diener and Schwarz1999) and the Day Reconstruction Method (DRM) (Kahneman et al., Reference Kahneman, Krueger, Schkade, Schwarz and Stone2004). EMA is based on reports of wellbeing at specific (often randomly chosen) points in time and also includes other approaches, such as the recording of events, and explicitly includes self-reports of one's own behaviours and physiological measures (Stone and Shiffman, Reference Stone and Shiffman2002).
The DRM has been used to approximate the more expensive EMA and to avoid potentially non-random missing observations, which arise due to the invasive nature of EMA (Csikszentmihalyi and Hunter, Reference Csikszentmihalyi and Hunter2003). The DRM asks people to write a diary of the main episodes of the previous day and recall the type and intensity of feelings experienced during each event (Kahneman et al., Reference Kahneman, Krueger, Schkade, Schwarz and Stone2004). Kahneman and Krueger (Reference Kahneman and Krueger2006) provide evidence that the results from the DRM provide a good approximation for those from EMA.
To generate a measure of ‘pleasurableness’ from the EMA or DRM, a summary of the moment is generated from the responses to different types of feelings and their intensity. There are a number of ways to calculate this summary measure and no clear theoretical guidance about which one is best. One possibility is to take the difference between the average positive feelings (or the most intense positive) and the average negative (or the most intense negative) (Kahneman et al., Reference Kahneman, Krueger, Schkade, Schwarz and Stone2004). The proportion of time in which the most intense negative affect outweighs the most intense positive may also be generated, referred to by Kahneman and Kruger (Reference Kahneman and Krueger2006) as a ‘U-index’. The U-index clearly combines positive and negative affect, but is calculated by measuring each separately.
The EMA and DRM have been widely studied in purposeful samples, but there has been less work in population samples (although see White and Dolan, Reference White and Dolan2009). For large population samples, respondents could be asked for their experiences at a random time yesterday. With a large enough sample, a picture could be constructed about yesterday from thousands of observations, without having to use the full EMA or DRM for each respondent. This is very similar to the Princeton Affect – Survey (PATS) (Krueger and Stone, 2008). Simpler still is to ask people about feelings relating to the whole day. The US Gallup World and Daily Polls have done this.
Experiences of wellbeing are also affected by ‘mind wanderings’, whereby our attention drifts between current activities and concerns about other things. Research suggests that these can be quite frequent, occurring in up to 30 per cent of randomly sampled moments during an average day (Smallwood and Schooler, Reference Smallwood and Schooler2006). When these mind-wanderings repeatedly return to the same issues, they are labelled ‘intrusive thoughts’ and they often have a negative effect on our experiences (Watkins, Reference Watkins2008). Intrusive thoughts should probably be thought of as explanatory variables in determining overall SWB, but in future research they could potentially be used to help to explain some of the differences between evaluations and experiences. Moreover, Dolan (Reference Dolan2011) reports how intrusive thoughts can potentially explain why some people are willing to give up more years of life to improve their health than would be explained by their health state alone: intuitively, those who think about their health more, are more willing to give up life years to improve it.
Evaluations and experience-based measures may sometimes produce similar results (Blanchflower, Reference Blanchflower and Krueger2009), but often they do not. For life satisfaction, it appears that unemployment is very bad, marriage is pretty good at least to start with, children have no effect, retirement is pretty good at least to start, but there is considerable heterogeneity (Calvo et al., Reference Calvo, Haverstick and Sass2007). DRM data on affect have generally found weak associations between SWB and these events (Kahneman et al., Reference Kahneman, Krueger, Schkade, Schwarz and Stone2004; Knabe et al., Reference Knabe, Ratzel, Schob and Weimann2010). Work on the Gallup Poll by Diener et al. (Reference Diener, Ng, Harter and Arora2010) and Kahneman and Deaton (Reference Kahneman and Deaton2010) shows that income is more highly correlated with ladder of life responses than with feelings, which are themselves more highly correlated with health than the ladder.
‘Eudemonic’ measures
‘Eudemonic’ theories conceive of us as having underlying psychological needs, such as meaning, autonomy, control and connectedness (Ryff, Reference Ryff1989), which contribute towards wellbeing independently of any pleasure they may bring (Hurka, Reference Hurka1993). These accounts of wellbeing draw from Aristotle's understanding of eudemonia as the state that all fully rational people would strive towards – i.e. actualising one's human potentials (Deci and Ryan, Reference Deci and Ryan2008). ‘Eudemonic’ wellbeing can be seen as part of an objective list in the sense that meaning etc. are externally defined, but it usually comes under SWB once measurement is made operational. We each report on how much meaning our own lives have, usually in an evaluative sense (Ryff and Keyes, Reference Ryff and Keyes1995; Huppert, Reference Huppert2009), and so we classify such responses under SWB but with inverted commas to highlight the blurred boundaries.
In a comparison of ‘eudemonic’ measures and evaluations of life satisfaction and happiness, Ryff and Keyes (Reference Ryff and Keyes1995) found that self-acceptance and environmental mastery were associated with evaluations but that positive relations with others, purpose in life, personal growth and autonomy were less well correlated. There has not been a thorough comparison of the three measures of SWB due to no large-scale longitudinal or repeated cross-sectional survey containing all the measures.
More recently, White and Dolan (Reference White and Dolan2009) have measured the ‘worthwhileness’ (reward) associated with activities using the DRM. They find some discrepancies between those activities that people find ‘pleasurable’ as compared to ‘rewarding’. For example, time spent with children is relatively more rewarding than pleasurable, and time spent watching televisions is relatively more pleasurable than rewarding.
Some challenges
Before recommending any specific measures, we need to consider some key conceptual and methodological issues that apply to all three ways of measuring SWB. These are not fundamental flaws but rather issues to address when advancing any measure of wellbeing. Two distinct yet related conceptual concerns are expectations and adaptation. These lead nicely into the first of three methodological concerns: scaling. The other two methodological issues are salience and selection.
Expectations may change over time as individuals experience different life events. For instance, if governments propose policies to improve social conditions, this then becomes the new standard and effectively could become a social norm that people's SWB is based around (Duncan, Reference Duncan2005). So an improvement in social and economic conditions may not be correlated with improvements in SWB. A classic example of this is the frustrated achievers identified by Graham and Pettinato (Reference Graham and Pettinato2002). They find that upwardly mobile individuals are most likely to look beyond their original cohort for reference groups, and raise their expectations accordingly to fit their new reference group. This suggests that expectations and reference points are not static, but dynamic (Diener et al., Reference Diener, Lucas and Scollon2006).
Issues of adaptation are distinct from expectations but closely related. For instance, if a person has been endowed with a life-changing event (e.g. disability and divorce), their psychological immune system will ‘kick in’ (Gilbert et al., Reference Gilbert, Pinel, Wilson, Blumberg and Wheatley1998), and, over time, will offset some or even all of the loss in SWB. According to Kahneman and Thaler (Reference Kahneman and Thaler2005), a main reason for adaptation is attention, whereby the novelty and attention-seeking nature of many circumstances and events wear off over time. Some conditions, like unemployment it seems, continue to draw attention to them and continue to affect SWB long after the event (Lucas et al., Reference Lucas, Clark, Georgellis and Diener2003; Lucas, Reference Lucas2005).
Expectations and adaptation are also important for preference satisfaction too. For instance, once individuals expect that they will be endowed with a certain good, their value of the good changes (Shogren et al. Reference Shogren, Shin, Hayes and Kliebenstein1994). It has also been previously recognised that projects or policies are capable of changing people's preferences (Elster, Reference Elster1983; Bowles, Reference Bowles1998), and this is largely due to adaptive processes.
Adaptive processes underpin Amartya Sen's famous ‘happy slave’ example – both in terms of mental states: ‘if a starving wreck, ravished by famine, buffeted by disease, is made happy through some mental conditioning . . . the person will be seen as doing well on this mental states perspective’ (Sen, Reference Sen1985: 188) and preferences: ‘The defeated and the downtrodden come to lack the courage to desire things that others more favourably treated by society desire with easy confidence’ (Sen, Reference Sen1985: 15).
In principle, objective list accounts can ‘statically’ determine the value of different components of wellbeing. In practice, what counts as a good life is going to be dynamic too. As argued by Clark (Reference Clark2009: 34), ‘adaptation may pose serious problems for the [objective list account of wellbeing] if the relevant capabilities are to be identified through democratic or participatory techniques’. The degree to which we should allow wellbeing to vary according to expectations and adaptation are vexing moral problems and cannot be resolved here. But information on all three accounts of wellbeing can illuminate what difference expectations and adaptation make in practice and such information can be fed into the normative debate.
Expectations and adaptation feed directly into scaling effects. In order to make meaningful comparisons over time and across people, we need to understand how interpretations of the scales may change over time. Frick et al. (Reference Frick, Goebel, Schechtman, Wagner and Yitzhaki2006) show that respondents in the German Socio-Economic Panel have a tendency to move away from the endpoints of response scales over time. The relationship between earlier and later responses can be seen as an issue of scaling and salience: if later responses are influenced by earlier ones, then the earlier ones are salient at the time of the later assessment (as shown in the study by Dolan and Metcalfe, Reference Dolan and Metcalfe2010). It is possible that the interpretation of endpoints on a scale change when circumstances change and when key life events happen and it is important that we conduct more focussed empirical research into this issue. It is not at all clear, though, whether this actually matters for policy purposes since a seven out of ten before and after having children, for example, is still, in fact, seven out of ten.
On salience, any question focusses attention on something and we must be clear about where we want respondents’ attention to be directed, and where it might in fact be directed. We should like to have attention focussed on those things that will matter to the respondent when they are experiencing their lives possibly including any thoughts they may have about their health, which might matter more than the state itself (Dolan, Reference Dolan2010). It must be recognised for example, that the mere act of asking a happiness question might affect experiences (Wilson et al., Reference Wilson, Lisle, Schooler, Hodges, Klaaren and LaFleur1993). Responses will be influenced by salient cues, such as the previous question (Schwarz et al., Reference Schwarz, Strack, Kommer and Wagner1987), and perhaps also by the organisation carrying out the survey. The general consensus, however, is that there are stable and reliable patterns in happiness, even over the course of many years (Fujita and Diener, Reference Fujita and Diener2005).
On selection, who chooses to be part of a survey that contains SWB measures is important to establishing whether the effects of any factor associated with happiness are generalisable or specific to the sample population. Attrition of certain types of people in different types of happiness surveys is also important in generalising treatment effects. Watson and Wooden (Reference Watson and Wooden2004) show that people with lower life satisfaction are less likely to be involved in longitudinal surveys. Moreover, people self-select into particular circumstances that make it difficult for us to say anything meaningful about how those circumstances would affect other people. Take the effects of volunteering as an example. There is generally a positive association between volunteering and SWB but it is possible that those choosing to volunteer are those most likely to benefit from it and those with greater SWB may be those most likely to volunteer in the first place. Part of any correlation will then be picking up the causality from SWB to volunteering. Telling the chicken from the egg in SWB, as it is elsewhere, is crucial for effective policymaking.
Recommendations and conclusion
There are three main accounts of wellbeing (objective lists, preference satisfaction and subjective wellbeing), and all three accounts are important for policy purposes. There are on-going discussions about how to measure objective lists (Dean, Reference Dean2009) and how to capture preferences more effectively (Taylor-Gooby, Reference Taylor-Gooby2008; Greener and Powell, Reference Greener and Powell2009). Our paper focusses on how to measure SWB but we recognise the importance of the other accounts. Indeed, there may be significant differences between the accounts (Burchardt, Reference Burchardt2005; Anand and van Hees, Reference Anand and Van Hees2006), but better data on SWB will allow us to better highlight the synergies and tensions between the accounts of wellbeing.
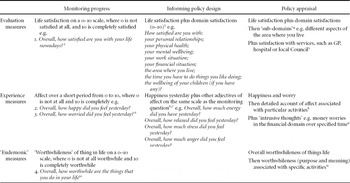
In the spirit of the Stiglitz et al. (Reference Stiglitz, Sen and Fitoussi2009), who suggest measuring the different components of SWB separately, we suggest measuring each of evaluative, experience and ‘eudemonia’ separately. Table 1 provides our specific recommendations for each policy purpose. We strongly recommend: (1) routine collection of column 1; (2) collection of column 2 where possible; and (3) policy appraisal should include more detailed (e.g. time use) measures. We recommend that governments and statistical agencies ask the following questions:
(i) Overall, how satisfied are you with your life nowadays?
(ii) Overall, how happy did you feel yesterday?
(iii) Overall, how anxious did you feel yesterday?
(iv) Overall, how worthwhile are the things that you do in your life?
Recommended measures of SWB1

Notes:
1. Reviews of the different measures can be found in Dolan et al. (Reference Dolan, Peasgood and White2006) and Waldron (Reference Waldron2010).
2. This is similar to the question used in the BHPS, GSOEP (German Socio-Economic Panel) and World Values Survey (WVS), the Latinobarometer and the recent Defra surveys. The GSOEP, WVS and Defra surveys use a 0–10 scale. Some of these surveys use a scale running from completely dissatisfied to completely satisfied, and they do not make clear where on the scale dissatisfied stops and satisfied starts. This makes it difficult to interpret the scores. Moreover, we seek consistency across the different measures of SWB, at least at the level of monitoring, and the experience measures generally calibrate the scales from ‘not at all’.
3. These are largely taken from the BHPS domains. The BHPS does not ask about satisfaction with mental wellbeing and with the wellbeing of your children, which are obvious omissions from the BHPS domains. Both of these domains are potentially important determinants of wellbeing (as distinct, in the case of children, from simply knowing whether someone has children or not). It is important to ask about general mental wellbeing and not mental health, since the latter is most likely to only pick up the negative side of the domain.
4. See Van Praag and Ferrer-i-Carbonell (Reference van Praag and Ferrer-i-Carbonell2004) for considering of the sub-domains that go into job satisfaction.
5. See for example the UK Local Authority Surveys, conducted by IpsosMORI (2004).
6. Happy and worried are the two main adjectives used in the original DRM by Kahneman et al. (Reference Kahneman, Krueger, Schkade, Schwarz and Stone2004). For the U-index developed by Kahneman et al. (Reference Kahneman, Krueger, Schkade, Schwarz and Stone2004) and Krueger et al. (Reference Krueger, Kahneman, Schkade, Schwarz and Stone2009), they measure the percent of moments spent in an unpleasant state during each activity, where an unpleasant state is defined as one where a negative emotion (sad, stress or pain) strictly dominates the positive emotions (happy). Using these two adjectives is consistent with the main headline indicators in the Gallup–Healthways data. Gallup measure the percentage of Americans who, reflecting on the day before they were surveyed, say they experienced a lot of happiness and enjoyment without a lot of stress and worry versus the percentage who say they experienced daily worry and stress far outweighing their happiness and enjoyment.
7. Some of these adjectives can be taken from the Gallup World Poll questions. We would also recommend that data using well-established measures of mental health (e.g. the PHQ9 and GAD7, which are being used to evaluate the impact of cognitive behavioural therapies) be collected periodically.
8. See Kahneman et al. (Reference Kahneman, Krueger, Schkade, Schwarz and Stone2004) and Krueger and Stone (2008).
9. See Smallword and Schooler (Reference Smallwood and Schooler2006) and Dolan (Reference Dolan2011).
10. The eudomonic measures are traditionally quite demanding in terms of the number of questions and time taken to complete (Dolan et al., Reference Dolan, Peasgood and White2006). There are no general questions about purpose and meaning in life and so we have based our recommendations on a suggestion by Felicia Huppert.
11. See White and Dolan (Reference White and Dolan2009).
Policymakers may wish to aggregate across the four questions above (and thus in the first column of Table 1) for the purposes of monitoring progress but important differences across the measures need to be made clear. For informing and appraising public policy, the questions need to be refined further, to include more domain level experiences and evaluations, and also more SWB data related to time-use (see Kahneman et al., Reference Kahneman, Krueger, Schkade, Schwarz and Stone2004).
By using the three SWB measures across countries, we will be able to provide more empirically robust data that will allow us to gain a better insight into the challenges raised in the previous section. The time has certainly come for regular measurement of SWB in the largest standard government surveys. Gathering such data will allow us to test a number of theories in economic and social sciences and policy. For example, Taylor (Reference Taylor2011) suggests that SWB is influenced by a range of choices that not all people in society are able to make. Having SWB on large surveys will allow us to test the opportunity of people to obtain higher SWB and the important objective circumstances that allow people to have higher SWB. Moreover, it will allow us to test the different measures of SWB with the different types of objective accounts of wellbeing that has not been previously conducted.
By aggregating over years, data should be available at local authority level and reliable quarterly data should be produced at the national level, especially if the survey involved overlapping panels. There are many potential surveys that could include the measures in Table 1, such as the Integrated Household Survey (IHS) in the UK (see Waldron, Reference Waldron2010, for details of the candidate surveys). Statistical agencies, academics, public policy officials, and the general public at large have a fantastic opportunity to measure SWB in ways that will enhance the monitoring of progress, and better inform the design and appraisal of social policy.
Acknowledgements
We would like to thank Paul Allin and Stephen Hicks at the Office of National Statistics, UK, for providing comments on an earlier draft and for supporting our research. We are indebted to Richard Layard for many discussions and, more generally, debates, for contributing towards the recommendations on measures, and for his role in pushing subjective wellbeing up the academic and policy agendas. We would also like to thank the referees and editors at the Journal of Social Policy for helpful comments and suggestions.