INTRODUCTION
Parasites are both important agents of natural selection and factors contributing to the dynamics of host populations (Ebert et al. Reference Ebert, Lipsitch and Mangin2000; Albon et al. Reference Albon, Stien, Irvine, Langvatn, Ropstad and Halvorsen2002; Marcogliese, Reference Marcogliese2004). Within a population, variation in the degree of parasitism incurred by individual hosts underpins the importance of parasitism as an evolutionary or ecological force. Identifying which processes influence parasite distribution among hosts, and make some hosts more susceptible to infection than others, is thus a central question in parasite ecology (Carney and Dick, Reference Carney and Dick1999; Poulin, Reference Poulin2000; Gonzalez and Poulin, Reference Gonzalez and Poulin2005). Factors influencing parasite richness (number of parasite species) and abundance (number of conspecific parasite individuals) at the individual host level ultimately form the basis of parasite infection patterns (Carney and Dick, Reference Carney and Dick2000).
Several ecological factors and host attributes can influence the number and diversity of parasites infecting hosts at the individual level. In fish, these factors may include age/size, the number of different prey consumed as well as prey selectivity, habitat, etc. (Poulin, Reference Poulin2000; Johnson et al. Reference Johnson, Nelson and Dick2004a ; Locke et al. Reference Locke, Marcogliese and Valtonen2014). Many helminth parasites have complex life cycles that are embedded within food webs, relying on trophic transmission (i.e. consumption of an infected prey by the predator host) to reach their next host (Simkova et al. Reference Simkova, Morand, Matejusova, Jurajda and Gelnar2001). For example, richness and abundance of trophically transmitted parasites in fish can thus be largely explained by the diversity of the prey/intermediate host community upon which different fish feed (Carney and Dick, Reference Carney and Dick2000; Bolnick et al. Reference Bolnick, Svanback, Fordyce, Yang, Davis, Hulsey and Forister2003; Klimpel et al. Reference Klimpel, Ruckert, Piatkowski, Palm and Hanel2006). Fish with a broad diet, feeding on more species of prey, may thus have more diverse trophically transmitted adult parasites (i.e. higher parasite richness) than those with more narrow, specialized diets (Kennedy et al. Reference Kennedy, Bush and Aho1986; Lo et al. Reference Lo, Morand and Galzin1998; Locke et al. Reference Locke, Marcogliese and Valtonen2014). At the same time, a selective diet may not preclude fish hosts from accumulating large numbers of parasites (i.e. high parasite abundance). Trophically transmitted parasites usually utilize limited numbers (often only 1 or 2) of intermediate host prey taxa, and parasite abundance in fish hosts therefore depends on the importance of these few species in the fish diet rather than the absolute number of prey groups consumed; i.e. a fish feeding mostly on the parasite's intermediate host is more likely to accumulate parasites than a fish feeding equally on all prey species forming its diet (Kennedy et al. Reference Kennedy, Bush and Aho1986; Marques et al. Reference Marques, Santos, Teixeira, Batista and Cabral2011). The degree of diet selectivity and the type/taxa of prey favoured by fish hosts may thus influence parasite infection levels, even in fish with qualitatively broad diets (Kennedy et al. Reference Kennedy, Bush and Aho1986; Marques et al. Reference Marques, Santos, Teixeira, Batista and Cabral2011). Shifts in dietary preference with age/size can also be important determinants of adult helminth richness and abundances in fish hosts (Johnson et al. Reference Johnson, Nelson and Dick2004a ; Poulin and Leung, Reference Poulin and Leung2011). Prey selection is largely gape-limited, both within and among fish species, and the diversity of prey consumed usually increase with gape size, itself strongly linked to fish body size (Wainwright and Richard, Reference Wainwright and Richard1995; Hyndes et al. Reference Hyndes, Platell and Potter1997; Marcogliese, Reference Marcogliese2002; Klimpel et al. Reference Klimpel, Ruckert, Piatkowski, Palm and Hanel2006). Overall, variability in feeding preferences may thus strongly affect parasite richness and abundance among sympatric, conspecific fish hosts (Knudsen et al. Reference Knudsen, Kristoffersen and Amundsen1997).
On the contrary, prey diversity should have little effect on parasites that infect fish directly (Simkova et al. Reference Simkova, Morand, Matejusova, Jurajda and Gelnar2001). Many larval trematodes infect fish through skin penetration and use fish as intermediate rather than definitive hosts (Locke et al. Reference Locke, McLaughlin and Marcogliese2013, Reference Locke, Marcogliese and Valtonen2014). Larval trematodes directly penetrating fish skin subsequently enter a dormant stage and wait for the fish to be consumed by the appropriate definitive host predator. Trematode larvae can accumulate in fish hosts over time, unlike adult helminths in the gastrointestinal tract which are shorter lived (Carney and Dick, Reference Carney and Dick2000; Locke et al. Reference Locke, Marcogliese and Valtonen2014). As a result, larger fish are expected to have higher richness and abundances of skin-penetrating trematode larvae (Zelmer and Arai, Reference Zelmer and Arai1998; Carney and Dick, Reference Carney and Dick2000; Poulin, Reference Poulin2000). Overall, among conspecific fish, larger individuals may harbour higher adult and larval helminth richness and abundances because they tend to consume a greater number of prey; they should be exposed to an increasing variety of potential intermediate hosts, being less gape-limited, and have been accumulating more larval parasites than their smaller conspecifics (Bell and Burt, Reference Bell and Burt1991; Poulin, Reference Poulin1995; Morand et al. Reference Morand, Cribb, Kulbicki, Rigby, Chauvet, Dufour, Faliex, Galzin, Lo, Lo-Yat, Pichelin and Sasal2000; Gonzalez and Poulin, Reference Gonzalez and Poulin2005; Dick et al. Reference Dick, Chamber and Gallagher2009; Zelmer, Reference Zelmer2014).
Phylogenetic effects relating to host specificity can also structure parasite communities among fish species that have similar diets but are phylogenetically distinct (Poulin, Reference Poulin1995). A broad diet may bring a fish into contact with a wide diversity of parasite species, though only a small subset of these may infect the host for evolutionary reasons (e.g. host–parasite compatibility; Kennedy et al. Reference Kennedy, Bush and Aho1986). Ingestion of larval helminths by fish is frequent in most fish species due to the abundance and diversity of these parasites in aquatic ecosystems (Marcogliese, Reference Marcogliese2002; Parker et al. Reference Parker, Chubb, Ball and Roberts2003). However, while different, co-occurring fish species can be exposed to the same helminths, host–parasite compatibility may subsequently modulate parasite infection patterns among fish host species (Lagrue et al. Reference Lagrue, Kelly, Hicks and Poulin2011). Overall, similarities or differences in parasite richness and abundance among sympatric fish species should be largely influenced by the combination of host diet and species-specific host–parasite compatibility (Lile, Reference Lile1998; Knudsen et al. Reference Knudsen, Amundsen, Nilsen, Kristofferson and Klementsen2008; Lagrue et al. Reference Lagrue, Kelly, Hicks and Poulin2011).
Despite the potential for effects on parasite infection patterns, fish diet is most often characterized at the species or population level, thus ignoring potential variation among individuals (Fodrie et al. Reference Fodrie, Yeager, Grabowski, Layman, Sherwood and Kenworthy2015). Diet variation and ‘individual specialization’ among conspecific individuals is common in natural populations, including fish (Bolnick et al. Reference Bolnick, Yang, Fordyce, Davis and Svanback2002, Reference Bolnick, Svanback, Fordyce, Yang, Davis, Hulsey and Forister2003; Araujo et al. Reference Araujo, Bolnick and Layman2011; Layman et al. Reference Layman, Newsome and Crawford2015; Rosenblatt et al. Reference Rosenblatt, Nifong, Heithaus, Mazzoti, Cherkiss, Jeffery, Elsey, Decker, Silliman, Guillette, Lowers and Larson2015). Species assumed to be dietary generalists and exhibiting broad population-level diets can actually specialize at the individual level, inducing intraspecific differences in risk of parasitism (Curtis et al. Reference Curtis, Berube and Stenzel1995; Wilson et al. Reference Wilson, Muzzall and Ehlinger1996). Combining data on individual fish stomach contents (number of prey groups and relative abundance in fish diet) and parasites (richness and specific abundances) may therefore provide a more accurate picture of the link between host diet and infection levels. Numerous fish species are considered opportunistic omnivores consuming a wide variety of prey taxa, though as individuals, fish can display contrasting dietary preferences that may yield differences in parasite richness and abundance among conspecific hosts. An individual host typically harbours a small sample of the local parasite community that reflects its individual diet range (i.e. number of prey groups consumed) and prey selectivity (Locke et al. Reference Locke, McLaughlin and Marcogliese2013). Usually, parasites are aggregated among available hosts (Poulin, Reference Poulin2007, Reference Poulin2013). This is often due to differences in the rate of parasite acquisition among hosts. For trophically transmitted helminths, differences in diet among conspecific hosts can generate heterogeneity in exposure to parasites and ultimately produce such aggregated distributions (Knudsen et al. Reference Knudsen, Curtis and Kristofferson2004; Poulin, Reference Poulin2007).
Here, we used field sampling to quantify and analyse the richness and abundance of all helminth parasites as well as stomach contents of individual fish of 11 species. Stomach contents reflect short-term feeding patterns, but may still capture the causal link between diet and helminth richness and abundance among but also within fish species (i.e. among conspecific fish individuals; Johnson et al. Reference Johnson, Nelson and Dick2004a ). Individual fish feeding preferences are likely consistent over time, at least seasonally, and even a single stomach content sample should reflect fairly accurately individual fish diet. Strong overlap in parasite infection (richness and abundance), or lack thereof, among unrelated fish species may reflect similarities or differences in diet, habitat and host specificity (or a combination of these factors) that are sometimes difficult to tease apart due to phylogenetic effects (Carney and Dick, Reference Carney and Dick1999). Here, by comparing parasite richness and abundance among sympatric conspecifics, we eliminated these potential phylogenetic and geographical effects. Our main goal was to determine whether differences in parasite richness and abundance among fish species and among conspecific fish individuals can be linked to variations in the number of prey groups consumed, feeding preferences and/or fish size. These factors should have contrasting influences on trophically compared with directly transmitted parasites. We thus tested the potential effects of diet range and selectivity on parasite infection levels in individual fish host separately for the 2 parasite categories. Trophically transmitted parasite richness should increase with diet range in fish diet and specific parasite abundance be more influenced by individual fish feeding preferences. In contrast, directly transmitted parasites should not be influenced by fish host diet. Overall, differences in feeding preferences among individuals may be reflected in differences in parasite infections. Ideally, individual feeding preferences would be assessed at multiple time points; however, for obvious reasons (the need to sacrifice fish to recover gut contents and parasites), this is not possible, and we must rely on a single measurement.
MATERIAL AND METHODS
Data collection
Field sampling
Fish were sampled in 4 lake ecosystems. Lake Hayes (44°58′59·4″S, 168°48′19·8″E), Lake Tuakitoto (46°13′42·5″S, 169°49′29·2″E), Lake Waihola (46°01′14·1″S, 170°05′05·8″E) and Tomahawk Lagoon (45°54′06·0″S, 170°33′02·2″E; South Island, New Zealand) were selected to provide a variety of lake types (size, depth and altitude), freshwater communities (coastal vs alpine, trophic state and tidal or not; see Table S1 for details). Within each lake, 4 sampling sites were selected along the littoral zone to cover all microhabitat types (substrate, macrophytes, riparian vegetation, etc.) present within each lake. The 4 lakes were sampled in early spring, summer and late autumn (austral seasons: September 2012, January and May 2013). Fish were captured at each site and in each lake to assess potential spatial variability within and among lakes in fish gut contents (prey richness and selectivity) and infection levels (parasite richness and abundance).
We used a combination of fish catching gear types so that accurate cross-sections of fish species and size classes were sampled from each site. Two fyke nets and 10 minnow traps were set overnight in each site, when some fish species are more active (i.e. eels and common bully), as they are passive sampling methods relying on fish to willingly encounter and enter traps (Hubert, Reference Hubert, Murphy and Willis1996). The next day, trapped fish were recovered and set aside for later dissection. Sampling was then complemented using two 15 m long multi-mesh gillnets. Gillnets were benthic-weighted sets with top floats, 1·5 m high and comprised 3 panels of 25, 38 and 56 mm meshes, each 5 m long. Gillnets covered the whole water column and were used to capture highly mobile, mainly diurnal fish (i.e. trout, perch and mullet). Fish caught in the nets were removed immediately to avoid excessive accumulation and the potential visual deterrence to incoming fish (Lagrue et al. Reference Lagrue, Kelly, Hicks and Poulin2011). Finally, fish sampling was completed using a standard, fine-mesh (5 mm mesh size) purse seine net. As an active sampling method, seine netting captures small and/or sedentary fish species (i.e. galaxiids, smelt and juvenile fish of most species) that are not captured by passive gear like fyke nets or gillnets (Nielsen and Johnson, Reference Nielsen and Johnson1983). All fish were killed immediately to inhibit the digestion process and stored on ice to preserve internal tissues, stomach contents and parasites for future identification, count and measures. In the laboratory, fish were identified to species, measured to the nearest millimetre (fork length), weighed to the nearest 0·01 g and then dissected. The gastrointestinal tract, from oesophagus to anus, and all internal organs (heart, liver, gall bladder, gonads, swim bladder, etc.) of each fish were removed and preserved in 70% ethanol for later diet and parasite analyses. Fish bodies were frozen separately for later parasite analyses as ethanol preservation renders muscle tissues difficult to screen for parasites.
Parasites
Complete necropsies of all fish were conducted under a dissecting microscope. The head, gills, eyes, brain and spine of each fish were examined using fine forceps to pull apart fish tissues and obtain an accurate, total parasite count for all helminth species in each individual fish. Soft tissues (muscle and skin) were removed from the spine, crushed between 2 glass plates and examined by transparency to identify and count parasites. Internal organs and the gastrointestinal tract were first rinsed in water to wash off the ethanol. The digestive tract was then separated from other organs. Liver, swim bladder, gall bladder, gonads and other organs and tissues from the body cavity (fat, mesentery, kidneys, heart, etc.) were all screened for parasites. Finally, the digestive tract was dissected. Stomach and intestine contents were removed, screened for parasites and then set aside for later diet examination. Oesophagus, stomach, pyloric caeca (when present), intestine and rectum were then examined for gastrointestinal parasites. All parasites were identified and counted. For each fish individual, helminth parasite richness (total number of species) and specific abundances (total number of individuals per parasite species) were determined. The life stage (adult or larval) and infection mode (directly or trophically transmitted) of all individuals was also recorded. Note that no external parasite (copepods, monogeneans or leeches) were recovered from any of the fish examined and are thus not considered here.
Fish diet contents
Food items from the stomach and intestine of all fish were identified under a dissecting microscope to determine the diet range of each individual (number of different prey taxa). Prey items were also counted to estimate the relative importance of each prey taxa in individual fish gut contents. Relative importance of each prey (number of a specific prey divided by the total number of prey items in the fish diet contents) was used as an estimate of diet selectivity of individual fish hosts.
Analyses
Parasite richness
As different mechanisms are expected to affect the number of directly and trophically transmitted parasite species acquired by a given fish host, we first divided the parasite community within each fish based on transmission mode (considering each life stage separately for parasites with complex life cycles). We then tested for a potential relationship between the richness of each group of parasites and host diet range (here defined as the number of prey taxa found in the fish host's gut contents), size (log of weight in grams) and their interaction. To account for the possibility that the richness of a host's parasite community was lower or higher because of its environment, we also included nested random effects of lake and site within lake. These random effects allow us to control for additional variation in parasite richness that can be explained by lake and site-within-lake without sacrificing the degrees of freedom that would be lost if they were fixed effects. This gave us the model:
 $$\eqalign{\Sigma _i &= \beta _0 + \beta _{0t} + (\beta _1 + \beta _{1t} )\omega _i + (\beta _2 + \beta _{2t} )\rho _i \cr & \quad+ (\beta _3 + {\rm} \beta _{3t} )\omega _i \rho _i + L_i + S_i + \varepsilon _i} $$
where Σ i is the number of parasite species with a given transmission mode (direct or trophic) in an individual host i, ω i is the log of the weight of the fish host, ρ i is the host's diet range, L i is a random effect of lake, S i is a nested random effect of site within lake, and ε i is a residual error term. Note that β 0, β 1, β 2 and β 3 refer to directly-transmitted parasites while β 0t , β 1t , β 2t and β 3t are ‘adjustments’ to these β's when considering trophically transmitted parasites. As we were not interested in seasonal variations in this study, we analysed data from all 3 seasons together.
As richness, defined here as the number of parasite species per fish host, can take integer values only, and because many potential hosts did not contain any parasites, we fit these models as zero-inflated Poisson processes where the fixed effects described above applied to the Poisson components of the model only. That is, the zero-inflated component consisted of a fixed probability of having a parasite richness of zero, modulated by different random effects of lake and site within lake. In addition to having separate random effects, separate variance terms were fit to the zero-inflated and Poisson components of the model with no covariance between them.
Because the number of parasites infecting a host varied among fish species, we fit separate models for each host species. We also restricted our analyses to fish host species in which at least 1 individual was infected with at least 1 parasite and to host species represented by at least 11 individuals (to give the necessary degrees of freedom to fit the model above). Individuals of Anguilla australis and Anguilla dieffenbachi were pooled under Anguilla spp. to increase sample size and fit a single model at the genus level. Both species are biologically and functionally similar, feeding on the same prey and acquiring the same parasites, and often co-exist (McDowall, Reference McDowall1990). We fit all models using the function MCMCglmm in the R (R Core Team, 2014) package of the same name (Hadfield, Reference Hadfield2010).
Abundance and biomass of trophically transmitted parasites
We next tested whether feeding preferences of individual fish hosts showed any relationship with the abundance and biomass of trophically transmitted parasites with which they were infected. For each fish host species and each trophically transmitted parasite species found in that host, we determined the proportion η iq of host i's gut contents (by abundance) accounted for by intermediate host q. We used abundance (rather than biomass or volume) to determine proportions because, while prey species deliver different amounts of energy to the predator depending on their size, each intermediate host acts as a single ‘packet’ of parasites delivered to the definitive host.
While addressing the richness of fish parasite communities, we fit separate models for each observed combination of fish host and parasite species.
Using these data, we constructed parallel models for the abundance of each parasite species in each individual fish host. When a host i had 2 intermediate host preys q and r, we fit the model:
 $$\eqalign{\Upsilon _{ij} & = \beta _0 + \beta _{0t} + \beta _1 \omega _i + \beta _2 \eta _{iq} + \beta _3 \eta _{ir} + \beta _4 \omega _i n_{iq} \cr & \quad + \beta _5 \omega \;\eta _{ir} + L + S + \varepsilon _{ij}}$$
where Y is the number of individuals of parasite species j observed in a fish host i and all other symbols are as in equation (1) or as defined above. Where only 1 intermediate host prey taxon was observed for a given fish host–parasite combination, β 3 and β 5 were omitted from the model. We then fit an equivalent model for the total biomass of parasites,
 $$\eqalign{M_{ij} & = \beta _0 + \beta _{0t} + \beta _1 \omega _i + \beta _2 \eta _{iq} + \beta _3 \eta _{ir} + \beta _4 \omega _i n_{iq} \cr & \quad + \beta _5 \omega _i \eta _{ir} + L_i + S_i + \varepsilon _{ij}} $$
where M ij is the biomass of parasite species j observed in host species i and all other symbols are as above.
We fit both of these models to each fish host–parasite combination with sufficient sample size (the minimum required sample size varied depending on the number of intermediate hosts and levels of random effects). We also excluded combinations where none of the parasite's potential intermediate hosts were observed in the diet of fish hosts as the effect of diet could not be measured in these cases. As parasite abundances were integer values, we fit the models of parasite abundances as Poisson processes, and we fit the model of parasite biomass as a Gaussian process. We therefore fit equation (2) using the function glmer in the R (R Core Team, 2014) package lme4 (Bates et al. Reference Bates, Mächler, Bolker and Walker2014) and fit equation (3) using the function lmer in the R package lmer test (Kuznetsova et al. Reference Kuznetsova, Brockhoff and Christensen2014). After fitting the full models, we fit the suite of all possible reduced models for each full model using the R (R Core Team, 2014) function dredge from package MuMIn (Barton, Reference Barton2014) and then averaged across all models (weighting by AIC) using the function model.avg.
RESULTS
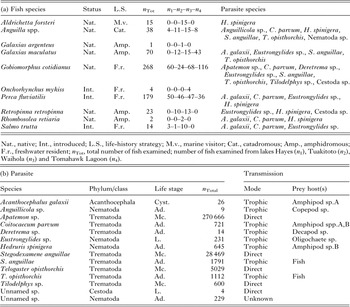
Across all samples, 614 fish representing 11 species were examined, and 12 species of parasites were identified (see Table 1a for details). A total of 309 546 parasites with different transmission modes (direct vs trophic) and prey hosts were recovered (see Table 1b for details). Note that the trematodes Stegodexamene anguillae and Telogaster opisthorchis use fish, albeit different species, as both intermediate and definitive hosts and were found as either directly transmitted metacercariae (i.e. trematode parasites larval stage) or trophically transmitted adults (Table 1b). The different life stages of these 2 parasite species were thus considered separately in the models. Overall, 2 224 096 prey items belonging to 53 different taxa were found in stomach contents of fish, identified and counted.
Details of the (a) fish species, status, life-history strategy and numbers examined for our study with the parasite species identified from each fish species, and of the (b) parasite phylum/class, numbers, life stage, transmission mode, and prey host species used for transmission for each parasite species

Cyst., cystacanth; Ad., adult; Mc., metacercaria; L., larva; Prey host(s): Paracalliope fluviatilis (Amphipoda sp.A), Paracorophium excavatum (Amphipoda sp.B), Tenagomysis chiltoni (Decapod sp.), Gobiomorphus cotidianus and Galaxias maculatus (Fish).
Parasite richness
We were able to fit our models in 6 fish taxa: Aldrichetta forsteri (n = 15), Anguilla spp. (n = 38), Gobiomorphus cotidianus (n = 268), Perca fluviatilis (n = 179), Galaxias maculatus (n = 70) and Salmo trutta (n = 14).
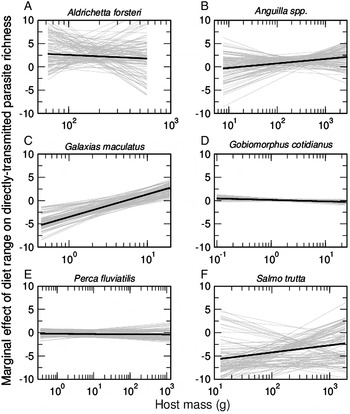
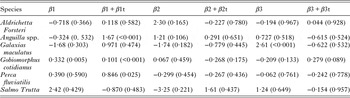
As hypothesized, there was no significant effect of host diet range on the richness of directly transmitted parasites in A. forsteri (<β 2> = 2·30, P = 0·165), Anguilla spp. (<β 2> = 1·21, P = 0·106), G. maculatus (<β 2> = −1·74, P = 0·182), G. cotidianus <β 2> = 0·101, P = 0·459), P. fluviatilis (<β 2> = −0·299, P = 0·454) or S. trutta (<β 2> = −3·25, P = 0·221). In G. maculatus, there was a significant interaction between diet range and host size (<β 3> = 2·61, P < 0·001), but in all other fish species the interaction was non-significant (<β 3> = −0·194, P = 0·967; <β 3> = 0·727, P = 0·518; <β 3> = −0. 209, P = 0·133; <β 3> = −0·062, P = 0·761; and <β 3> = 1·24, P = 0·649 for A. forsteri, Anguilla spp., G. cotidianus, P. fluviatilis and S. trutta, respectively). There was thus no overall effect of fish gut contents on directly transmitted parasite richness in any of the 4 fish taxa mentioned above; in the case of G. maculatus the effect of the interaction between host mass and diet range was small relative to the variability between MCMCglmm fits (Fig. 1; Table 2).
Marginal effects of fish host diet range on the richness of directly transmitted parasites found in the 6 fish taxa for which models could be fitted; (A) Aldrichetta forsteri, (B) Anguilla spp., (C) Galaxias maculatus, (D) Gobiomorphus cotidianus, (E) Perca fluviatilis and (F) Salmo trutta. Marginal effects are obtained by summing the effect of host diet range with the effect of the interaction between host mass and diet range across the observed range of fish host masses. A marginal effect of zero indicates that there is no overall effect of host diet range on parasite richness. Marginal effects greater than zero indicate that parasite richness increases with increasing host diet range, and marginal effects below zero indicate that parasite richness decreases as host diet range increases. Horizontal lines indicate that the effect of host diet range does not vary with host size, while sloped lines indicate that the effect of host diet range differs among hosts of different sizes. We show mean marginal effects (mean over 10 000 MCMCglmm iterations; black line) along with the marginal effects estimated in 100 of the MCMCglmm iterations with below-average deviances (grey lines).

Estimated fixed effects in equation (1) (with P-values in parentheses). β 1, β 2 and β 3, represent the effects of host mass, diet range and their interaction (respectively) on the richness of directly transmitted parasites, while β 1t, β 2t and β 3t are adjustments to these effects for trophically transmitted parasites. β1 + β1t therefore represents the main effect of host mass acting on the richness of trophically transmitted parasites. Effects are means over 1000 MCMC iterations

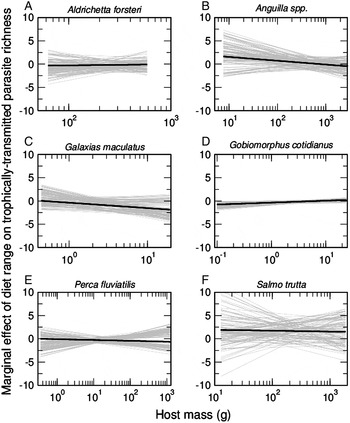
Contrary to our expectations, there was no effect of host diet range on the richness of trophically transmitted parasites in A. forsteri, Anguilla spp., G. maculatus, G. cotidianus, P. fluviatilis and S. trutta (<β 2 + β 2t> = −0·227, P = 0·780; <β 2 + β 2t> = 0·291, P = 0·651; <β 2 + β 2t> = −0·779, P = 0·445; <β 2 + β 2t> = −0·268, P = 0·175; <β 2 + β 2t> = −0·267, P = 0·436; and <β 2 + β 2t> = 1·61, P = 0·437, respectively). Furthermore, there was no significant interaction between host size and diet range in any of the above fish (<β 3 + β 3t> = 0·044, P = 0·928; <β 3 + β 3t> = −0·615, P = 0·524; <β 3 + β 3t> = −0·622, P = 0·532; <β 3 + β 3t> = 0·279, P = 0·089; <β 3 + β 3t> = −0·242, P = 0·778; and <β 3 + β 3t> = −0·154, P = 0·957, respectively). There was therefore no overall effect of diet range on the richness of trophically transmitted parasites at any host size in these fish (Fig. 2; Table 2).
Marginal effects of fish host diet range on the richness of trophically transmitted parasites found in the 6 fish taxa for which models could be fitted; (A) Aldrichetta forsteri, (B) Anguilla spp., (C) Galaxias maculatus, (D) Gobiomorphus cotidianus, (E) Perca fluviatilis and (F) Salmo trutta. Marginal effects are obtained by summing the effect of host diet range with the effect of the interaction between host mass and diet range across the observed range of fish host masses. We show mean marginal effects (mean over 10 000 MCMCglmm iterations; black line) along with the marginal effects estimated in 100 of the MCMCglmm iterations with below-average deviances (grey lines). See Fig. 1 for details about the interpretation of marginal effects.

Abundance and biomass of trophically transmitted parasites
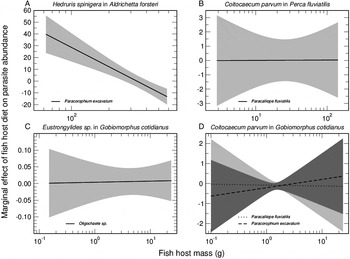
We were able to fit our models to the abundance and biomass of 3 trophically transmitted parasites in 3 fish host taxa: Hedruris spinigera in A. forsteri, Coitocaecum parvum in P. fluviatilis, and both Eustrongylides sp. and C. parvum in G. cotidianus. In the first 3 cases, only 1 prey species is used by the parasite as an intermediate host. Hedruris spinigera uses the amphipod Paracorophium excavatum for transmission to A. forsteri, C. parvum uses the amphipod Paracalliope fluviatilis only for transmission to P. fluviatilis and Eustrongylides uses oligochaete sp. to reach G. cotidianus. Two prey species, the amphipods P. excavatum and Pa. fluviatilis are used as intermediate hosts by C. parvum to be transmitted to and infect G. cotidianus.
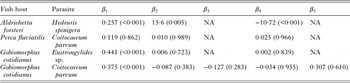
As expected, the abundance of H. spinigera in A. forsteri (i.e. number of parasites per individual fish host) tended to increase as the proportion of the intermediate host P. excavatum in the diet of an individual fish increased (<β 2 > = 15·6, P = 0·005). This effect interacted negatively with host mass (<β 4 > = −10·7, P < 0·001) such that in smaller A. forsteri (roughly <300 mm) the abundance of H. spinigera increased sharply with the proportion of P. excavatum in the diet but in the largest A. forsteri the abundance of H. spinigera decreased (Fig. 3A; Table 3). Note that ‘small’ and ‘large’ here refer to opposite ends of the continuum of A. forsteri lengths and not to explicit groups.
Marginal effects of the proportion of intermediate hosts in fish stomach contents on the abundance of trophically transmitted parasites in individual fish hosts in the 4 parasite–fish host taxon combinations for which models could be fitted; (A) Hedruris spinigera in Aldrichetta forsteri, (B) Coitocaecum parvum in Perca fluviatilis, (C) Eustrongylides sp. in Gobiomorphus cotidianus and (D) C. parvum in G. cotidianus. Intermediate host prey taxa are also identified within each panel. Marginal effects are obtained by summing the effect of proportion of intermediate host with the effect of the interaction between fish host mass and proportion of intermediate hosts across the observed range of fish host masses. We show mean marginal effects (black lines) with 95% confidence intervals (grey). See Fig. 1 for details about the interpretation of marginal effects.

Estimated fixed effects in equation (2) (with P-values in parentheses). β 1 indicates the effect of fish host mass on the abundance of the parasite, β 2 and β 3 the effects of the proportions of 2 intermediate hosts in the diet of the fish host, and β 4 and β 5 the effects of the interaction between proportion of intermediate host and fish host mass. NA indicates that only 1 intermediate host was found in the gut contents of the fish host. Estimates are based on averages over the full equation (2) and all possible reduced models, weighted by AIC

The abundances of C. parvum in P. fluviatilis and Eustrongylides sp. in G. cotidianus did not vary with the proportion of intermediate hosts (the amphipod Pa. fluviatilis and an unnamed oligochaete, respectively) in the diets of the fish hosts (<β 2> = 0·010, P = 0·989 and <β 2> = 0·006, P = 0·723, respectively). There was no significant interaction between fish host size and the proportion of intermediate hosts in fish host diets (<β 4> = 0·025, P = 0·966 and <β 4> = 0·002, P = 0·839, respectively). As such, there was no overall effect of the proportion of intermediate hosts in fish diet contents on parasite abundance for these 2 parasite–host combinations (Fig. 3B, C; Table 3).
Likewise, the abundance of C. parvum in G. cotidianus did not vary with the diet of fish hosts. Parasite abundance was not significantly associated with the proportion of either intermediate host (the amphipods Pa. fluviatilis and P. excavatum; <β 2> = −0·087, P = 0·383 and <β 3> = −0·127, P = 0·283, respectively). Further, there were weak interactions between the proportions of each intermediate host in the diet and fish host size (<β 4> = −0·034, P = 0·955 and <β 5> = 0·307, P = 0·610, respectively). Overall, the abundance of C. parvum did not vary significantly with the diet of G. cotidianus (Fig. 3D; Table 3).
In general, relationships between parasite biomass and proportions of intermediate hosts in the diet of fish hosts were similar to the relationships with parasite abundances described above (see Supplementary Material for details).
DISCUSSION
Conspecific individuals are often treated as ecologically equivalent although individual specialization in habitat or resource use is a widespread phenomenon with potentially broad ecological implications (Bolnick et al. Reference Bolnick, Svanback, Fordyce, Yang, Davis, Hulsey and Forister2003). Inter-individual variation in diet can influence infection risk among conspecific fish when exposure to parasites varies with prey type (Curtis et al. Reference Curtis, Berube and Stenzel1995; Wilson et al. Reference Wilson, Muzzall and Ehlinger1996). Fish that consume more species of prey should have more diverse trophically transmitted parasites (Locke et al. Reference Locke, Marcogliese and Valtonen2014). Comparatively, exposure to directly transmitted parasites should not depend on host diet (Simkova et al. Reference Simkova, Morand, Matejusova, Jurajda and Gelnar2001; Locke et al. Reference Locke, McLaughlin and Marcogliese2013, Reference Locke, Marcogliese and Valtonen2014). We indeed found no clear relationship between fish gut contents and the richness of directly transmitted parasites in individual hosts. Results indicate that infection levels of directly transmitted helminth larvae are highly variable among fish species, indicating high host specificity and potential phylogenetic constraints in these parasites.
In contrast with our predictions, we also did not find clear relationships between host diet range and the richness of trophically transmitted parasites in fish hosts. Although broader diet range has been linked with higher parasite richness in fish, this pattern is only observed when a wide variety of prey species is utilized by a diverse array of parasite species for transmission (Carney and Dick, Reference Carney and Dick1999). If only a few species in the ecosystem are actually used by local parasites for trophic transmission, then parasite richness in fish host is unlikely to increase with diet range (Kennedy et al. Reference Kennedy, Bush and Aho1986). In lakes sampled here, the number of fish parasite species using trophic transmission is relatively low (8 species overall with a maximum of 7 in any 1 lake/season combination) and the overall number of prey taxa used by these parasites limited to 7, divided into only 3 groups (fish, crustaceans and oligochaetes). Comparatively, 53 different prey taxa were found in fish gut contents with a maximum of 26 prey taxa in any 1 site/lake/season combination. It is thus possible that, as long as the few prey taxa used by parasites are consumed by fish, a broader diet range does not further increase the richness of parasites found in individual hosts (Kennedy et al. Reference Kennedy, Bush and Aho1986). Usually, larger fish harbour higher parasite diversities because large individuals have a higher feeding rate and are also less gape-limited (and thus less restricted in prey choice) than small fish (Poulin and Valtonen, Reference Poulin and Valtonen2002; Gonzalez and Poulin, Reference Gonzalez and Poulin2005). Generally, our results indicate that individual fish size did not have major effects on the relationship between host diet range and parasite richness in fish species captured in the present study.
Interspecific differences in diet range and host–parasite compatibility among fish species may add extra layers of complexity to the factors determining parasite richness in individual fish hosts (Knudsen et al. Reference Knudsen, Kristoffersen and Amundsen1997, Reference Knudsen, Amundsen, Nilsen, Kristofferson and Klementsen2008; Lagrue et al. Reference Lagrue, Kelly, Hicks and Poulin2011). Fish species sampled here have contrasting life-history strategies, varying from freshwater resident to marine visitors, potentially affecting their parasite fauna (Bouillon and Dempson, Reference Bouillon and Dempson1989; Kristoffersen et al. Reference Kristoffersen, Halvorsen and Jørgensen1994). However, apart from A. forsteri, all other fish species examined in our study are permanent freshwater residents as adults (McDowall, Reference McDowall1990). Although the larvae of the catadromous and amphidromous fish sampled here are oceanic, their freshwater parasite fauna could not have been influenced by different life-history strategies. Aldrichetta forsteri is a marine fish that migrates inland into freshwater during the summer months and usually remains freshwater bound for several months, feeding exclusively on freshwater prey. However, it is possible that recently immigrated fish individuals may lack freshwater parasites due to their recent arrival from the sea, potentially influencing diet–parasite links. Unfortunately, this cannot be determined from our data as we cannot determine residence time of fish in freshwater.
Parasites can also be highly host-specific and may never be found in some fish species even though prey taxa used for transmission are consumed by that particular fish species. Alternatively, some parasite-carrying prey may never be consumed by a given fish species, further reducing parasite richness in any particular host (Kennedy et al. Reference Kennedy, Bush and Aho1986; Lagrue et al. Reference Lagrue, Kelly, Hicks and Poulin2011); for example, parasites transmitted through fish prey consumption can only infect large piscivorous fish predators. Finally, gut contents may also provide a biased representation of individual diet range (Svanback et al. Reference Svanback, Quevedo, Olsson and Eklov2015). Apparent differences in diet among individual fish may reflect short-term foraging activities, with observed diets being only snapshots of actual diet ranges; all fish within a population may actually be feeding on the same range of available prey (Curtis et al. Reference Curtis, Berube and Stenzel1995). Comparatively, parasites likely remain in fish for longer than the prey used for transmission and thus provide a clearer signature of prey consumed over extended time periods than stomach contents (Johnson et al. Reference Johnson, Hesslein and Dick2004b ; Valtonen et al. Reference Valtonen, Marcogliese and Julkunen2010). For example, in our study, prevalence of H. spinigera in A. forsteri was 100% although only 40% of fish were found with the intermediate host prey P. excavatum in their gut contents, indicating that all fish individuals were feeding on P. excavatum even though the prey was not found in stomach contents. Similarly, only around 10% of G. cotidianus individuals infected with Eustrongylides sp. larvae had eaten oligochaetes recently. However, on the other end of the spectrum, only around 10% of G. cotidianus individual infected by C. parvum had not consumed the host Pa. fluviatilis, while all infected P. fluviatilis had the prey intermediate host in their stomachs. These differences are likely explained by the specific persistence time (i.e. lifespan) of each parasite in fish hosts. Eustrongylides sp. larvae remain in the fish until transmission to the bird definitive host and thus potentially for the life time of the fish. Hedruris spinigera is a large nematode that attaches to the stomach epithelium of the fish host, needing to achieve significant growth and to find a mate before reproduction, and likely remain in the fish for longer than the small, fast maturing, hermaphrodite C. parvum adult (Lagrue et al. Reference Lagrue, Kelly, Hicks and Poulin2011). On the other hand, although intestinal parasites were found in introduced fish host species (Table 1), a previous study on the same system showed that their abundance and size are significantly lower in introduced hosts (Lagrue et al. Reference Lagrue, Kelly, Hicks and Poulin2011). Despite feeding heavily on intermediate host prey, these fish harboured low abundances of small parasites, hinting at a quick turnover with parasites remaining in fish host for a short amount of time due to host–parasite incompatibility. As a result, infection levels in introduced species may be more closely linked to recent, short-term fish host diet. Overall, stomach content data represent only a very limited window of time unless stomach contents are repeatedly sampled from the same individual using non-lethal methods like stomach flushing (Araujo et al. Reference Araujo, Bolnick and Layman2011). However, this is logistically very difficult to achieve and cannot document parasite richness and abundance simultaneously as parasite identification and count require host dissection. Overall, the utility of the stomach contents data when assessing fish diet range and selectivity and their link with parasite richness and abundance will likely be influenced by species-specific host–parasite characteristics.
While diet range did not seem to influence parasite richness, diet specialization among fish individuals may still influence their exposure to trophically transmitted parasites (Bolnick et al. Reference Bolnick, Svanback, Fordyce, Yang, Davis, Hulsey and Forister2003). Among individuals, variation in diet is common in natural populations (Svanback et al. Reference Svanback, Quevedo, Olsson and Eklov2015). Intraspecific differences in diet preferences (i.e. individual diet specialization; Layman et al. Reference Layman, Newsome and Crawford2015; Rosenblatt et al. Reference Rosenblatt, Nifong, Heithaus, Mazzoti, Cherkiss, Jeffery, Elsey, Decker, Silliman, Guillette, Lowers and Larson2015) should thus translate in abundance variations of trophically transmitted parasites among conspecific fish hosts (Curtis et al. Reference Curtis, Berube and Stenzel1995; Wilson et al. Reference Wilson, Muzzall and Ehlinger1996). Diet range may be limited, but fish feeding intensively on the few prey taxa used by local parasites for transmission should carry heavy parasite loads, and vice versa for fish feeding preferentially on prey taxa devoid of parasites (Kennedy et al. Reference Kennedy, Bush and Aho1986; Dick et al. Reference Dick, Chamber and Gallagher2009). Differences in prey selectivity among sympatric fish should thus cause differences in parasite acquisition, and potential patterns of parasite segregation and aggregation among hosts (Crofton, Reference Crofton1971; Knudsen et al. Reference Knudsen, Kristoffersen and Amundsen1997, Reference Knudsen, Curtis and Kristofferson2004, Reference Knudsen, Amundsen, Nilsen, Kristofferson and Klementsen2008). However, our results showed no clear link between the proportion of prey intermediate hosts in individual fish diet contents (i.e. individual diet preference) and the abundance of parasites in fish hosts. Furthermore, relationships between diet preferences and parasite abundance were differentially influenced by fish size and species as well as prey and parasite species. In particular, the relationship between the abundance of H. spinigera in A. forsteri and the proportion of the intermediate host in the diet of A. forsteri was stronger in smaller fish. It is important to note, however, that feeding observations over short time frames (e.g. stomach content analyses) may overestimate the degree of diet specialization and thus influence documented relationship between parasite loads and host diet (Novak and Tinker, Reference Novak and Tinker2015). As mentioned previously, the temporal scale of study, as well as the number of independent observations, can greatly influence estimates of the degree and persistence over time of diet range and preferences (Curtis et al. Reference Curtis, Berube and Stenzel1995; Fodrie et al. Reference Fodrie, Yeager, Grabowski, Layman, Sherwood and Kenworthy2015). Dietary variations among individuals can also be caused by temporal or spatial patchiness in prey distribution rather than individual specialization and may not be reflected in parasite loads if individual hosts are mobile enough to move among prey patches (Rosenblatt et al. Reference Rosenblatt, Nifong, Heithaus, Mazzoti, Cherkiss, Jeffery, Elsey, Decker, Silliman, Guillette, Lowers and Larson2015). Again, potential links between feeding specialization and variation in parasite loads among individual fish hosts should be confirmed through repeated diet and parasite sampling, if at all feasible.
Overall, there was no clear relationship between diet range, estimated as the number of prey taxa in fish stomach contents, and parasite richness or between diet preferences (i.e. the proportion of prey species used for parasite transmission in individual fish diet contents) and parasite loads among individual fish hosts. Whether this lack of clear patterns was due to stomach sampling method limitations or accurately represents host–parasite relationships in the study systems is a question that should be tested further, but is technically and logistically challenging. Sampling repeatedly and concomitantly stomach contents and parasite abundances overtime in the same fish individuals would be ideal but is difficult if not impossible in wild fish. Although the methods used here are only a proxy of overall fish diet and parasite surveys, our results are roughly consistent across several host and parasite species, and contrast with those of earlier studies using similar methods in which diet and parasite infection were linked (Curtis et al. Reference Curtis, Berube and Stenzel1995; Knudsen et al. Reference Knudsen, Kristoffersen and Amundsen1997, Reference Knudsen, Amundsen and Klementsen2003; Bertrand et al. Reference Bertrand, Marcogliese and Magnan2008). This pattern hints at a true disconnect between host diet (at least as measured here) and measures of parasite infections although host–parasite species-specific patterns may vary. Inherent characteristics of New Zealand lake systems (low parasite species richness, limited numbers of prey species used for trophic transmission, high host–parasite specificity) likely limit the influence of diet range and individual diet specialization on parasite richness and abundance patterns. Repeated diet sampling over a longer time period, by maintaining fish in enclosure and using non-lethal stomach flushing to document individual fish diet for example, would help confirm or invalidate the utility of gut content data as well as the role of variation among individuals in diet specialization and its effects on parasite loads among sympatric fish. Our results and those of previous studies confirm that, although parasite acquisition is obviously related to host diet, other factors that vary widely among ecosystems, hosts and parasites likely influence how parasite richness and load are linked to host diet.
SUPPLEMENTARY MATERIAL
To view supplementary material for this article, please visit http://dx.doi.org/10.1017/S003118201500150X.
ACKNOWLEDGEMENTS
We thank Anne Besson, Isa Blasco-Costa, Manna Warburton and Kim Garrett for assistance with field collection. Animal sampling was carried out in accordance with Otago University animal ethics guidelines (Animal Ethics Approval ET 10/12) and under the New Zealand Department of Conservation and Fish and Game fishing permit (NZ – DOC permit OT-34204-RES). We thank three anonymous referees and the editor for positive and constructive comments on previous versions of the manuscript.
FINANCIAL SUPPORT
This study was funded by a grant from the Marsden Fund (Royal Society of New Zealand) to RP. ARC was supported by an NSERC PGS-D Doctoral Scholarship and a University of Canterbury Doctoral Scholarship, and DBS by a Marsden Fund grant (UOC-1101) and a Rutherford Discovery Fellowship (both administered by the Royal Society of New Zealand).