





Impact Statement
In this article, we focus on the impact of growing infrastructure needs for AI, specifically data centers, and the increasing energy demand required to power them. While the energy mix that will supply these data centers is important, our main emphasis is on CO2 emissions and their broader climate impact. In determining whether AI results in a net positive or negative contribution to emissions, it is essential to consider scenarios both with and without dedicated emissions reduction measures. Additionally, we consider the carbon benefits directly attributed to AI across various sectors of the energy industry.
1. Introduction
The concept of net-zero greenhouse gas (GHG) emissions is crucial for combating climate change and limiting global warming to well below 2°C, ideally to 1.5°C pre-industrial levels, as outlined in the Paris Agreement (United Nations Framework Convention on Climate Change, 2015). Achieving net-zero means balancing the total amount of GHGs released into the atmosphere with an equivalent amount being removed, thus stopping the accumulation of these gases that drive climate change. This goal requires significant transformations across all sectors of the economy, including energy, transportation, manufacturing, and agriculture (Benes et al., Reference Benes, Porterfield and Yang2024; Shell plc, 2025). This necessitates a comprehensive strategy and a multifaceted approach involving significant change in energy systems, agriculture and land use, and industrial processes. The sheer scale of this economic transformation is a major challenge (Krishnan et al., Reference Krishnan, Samandari, Woetzel, Smit, Pacthod, Pinner, Naucler, Tai, Farr, Wu and Imperato2022). For example, to reach net zero by 2050, Shell scenarios suggest that $3–4 trillion of commercially viable investment in low-carbon energy is required each year, up from the current $1.7 trillion-a-year investment (Shell plc, 2024). While these are large numbers, the difference from a reasonable baseline energy system investment profile is much smaller.
Generating electricity is a growing contributor to climate change, primarily because coal, oil, and gas are and will still be widely used compared to cleaner energy sources (Shell plc, 2025). While electricity demand has been steady over the years, it has recently surged and is projected to continue increasing its share until 2050. This growth is driven by the expanding digital economy and the rise of artificial intelligence (AI). Projections indicate a substantial surge in power consumption from data centers, which are essential for AI infrastructure. Some forecasts suggest that electricity demand from this sector could double by 2026 (Electricity, 2024—Analysis and forecast to 2026, 2024). The increasing complexity and computational intensity of AI models, especially generative AI, require significantly more energy per query compared to traditional Internet services.
While recent reports, such as the IEA’s Energy and AI (Energy and AI, 2025), present static sensitivity cases for future energy demand, this article extends that analysis by introducing a probabilistic risk assessment framework. Unlike deterministic studies, we employ Monte Carlo (MC) simulations to quantify the uncertainty and likelihood of these outcomes, generating P5, P50, and P95 emission scenarios. This methodological advancement allows us to move beyond simple “growth” versus “stagnation” narratives and assess the statistical probability of extreme scenarios—such as the “Energy Crisis” or “Abundance” cases—actually materializing by 2035.
This rising demand puts considerable pressure on existing electricity infrastructure, necessitating a re-evaluation of energy production and consumption patterns (Power Intelligence: Analyzing Artificial Intelligence and Data Center Energy Consumption, 2024; Norris et al., Reference Norris, Profeta, Patino-Echeverri and Cowie-Haskell2025). Major tech companies and cloud providers like Microsoft and Google have reported that their emissions have increased recently (Google, 2025; Microsoft, 2024). This trend is expected to continue due to the rush toward building more data centers in the next few years to support the rising AI demand and the ambition to become dominant players in AI. Several reports, including the IEA report on AI and power demand trends, indicate that GHG emissions will inadvertently rise in the near future as alternative energy sources are expected to take more time to become significant contributors (Shell plc, 2025).
However, AI also presents a transformative opportunity for accelerating the transition to a net-zero future. AI’s unique ability to process vast amounts of complex data on energy systems, emissions, and climate impact allows for more informed and data-driven approaches to decarbonization. AI can optimize energy grids, improve the efficiency of renewable energy sources through better forecasting, and support the development of more sustainable industrial processes and materials. Additionally, AI can enhance energy efficiency and availability and reduce waste across various sectors, from transportation and buildings to industrial manufacturing, significantly contributing to emissions reduction. Some reports suggest that AI alone could potentially reduce global GHG emissions by 4%–16% by 2030 (Maher et al., Reference Maher, Meinecke, Gromier, Garcia-Novelli and Fortmann2022; Shell plc, 2025) and by 1.4 gigatons by 2035 in the widespread adoption case (Energy and AI, 2025). The advancements in AI for science (see, e.g., Chandra et al., Reference Chandra, Koch, Pawar, Panda, Azizzadenesheli, Snippe, Alpak, Hariri, Etienam, Devarakota, Anandkumar and Hohl2024) demonstrate that AI can significantly accelerate complex challenges such as weather modeling and prediction, climate modeling, and carbon capture storage (CCS) modeling technologies, potentially by up to 100,000 times. At Shell, we have conducted projects investigating the role of AI in CCS within both traditional aquifers and land use. Our findings indicate that AI can greatly expedite the process of identifying suitable sites and accelerating project execution by several orders of magnitude. We anticipate that in the next 5–10 years, these areas will present significant potential and opportunities to offset carbon emissions (Pawar et al., Reference Pawar, Chandra, Panda, Devarakota, Alpak, Snippe and Hohl2025).
This paper explores the complex interplay between AI and the pursuit of net-zero emissions. Rather than constructing a fully coupled Integrated Assessment Model (IAM) to calculate a definitive mathematical “net impact,” our approach serves explicitly as a scenario synthesis combined with a probabilistic uncertainty analysis. Section 2 lays down the methodology of calculating the direct probabilistic footprint. The analysis of the exponential growth in demand for critical resources required to support AI development and deployment, and its consequent impact on CO2 emissions in the near-term scenario, is presented in Sections 2–4. This footprint analysis highlights a critical juncture that requires careful consideration. Subsequently, we complement this quantitative footprint with a qualitative synthesis of how AI can act as a decarbonization enabler across various sectors, reshaping this trajectory in the long-term (Sections 5–7). Finally, we discuss the inherent analytical limitations of comparing these two distinct paradigms prior to concluding our findings.
2. Methodology
To accurately estimate CO2 emissions from data centers and AI workloads, a refined methodology is necessary. This involves moving beyond simple estimations of data center energy consumption to utilizing more granular data and applying location-specific, time-varying emission factors that explicitly incorporate uncertainty. Near-term scenarios should quantify the growth of data centers and AI workloads with defined probability distributions, reflecting the inherent unpredictability. Long-term projections need to model potential efficiency gains in AI hardware and software, the indirect impact of AI in optimizing energy systems and increasing renewable penetration, and the uncertain trajectory of the energy mix. By employing MC simulations with these probabilistically defined inputs, we can generate a range of potential emission scenarios for both the near and long term. This approach allows for a more nuanced understanding of the uncertainties involved and enables sensitivity analysis based on the factors with the most significant influence on future data center and AI-related emissions. The ultimate goal is to provide robust, probabilistic insights that can inform strategies for mitigating the environmental impact of this rapidly growing sector.
3. The AI boom and its energy appetite
The AI landscape is experiencing unprecedented expansion, particularly in the areas of deep learning and large language models (LLMs). This surge in AI capabilities has been driven by breakthroughs in algorithms, the availability of large datasets, and advancements in computing hardware. Since the advent of ChatGPT, the capabilities of these LLMs have evolved from simple text generation and summarization to advanced reasoning abilities with remarkable accuracy and acceptance. These models are now routinely used on desktops (e.g., Copilot) and for content generation by creative artists. The bulk of these AI models are termed foundational models, which are trained on large datasets and are versatile and suitable for numerous downstream applications. GPT and Llama are both examples of these foundational models. Figure 1 shows the number of foundational models with more than 10 billion parameters built between 2021 and 2024 (data courtesy of EcoSystem Graphs, (n.d.). It also illustrates the increase in revenues from high-density graphics processing units (GPUs) from 2022 to 2028 (Source: ElectroIQ, n.d.). As can be seen, more investments are being made toward building GPU servers to support the development of large AI models. Although NVIDIA GPUs dominate the market for chips and low-level software libraries, there are no barriers for new entrants to join the arena of building new foundational models. Due to supply and demand mismatches and other approval process-related issues, commissioning grid infrastructure has temporarily slowed the pace of data center growth. However, the overall trend remains one of rapid expansion.
The figure illustrates the growth of foundational models between 2021 and 2024 and the revenue growth of high-density GPU markets. Data courtesy of EcoSystem Graphs (n.d.).

Figure 1. Long description
The first panel on the left is a bar chart titled Number of Foundational Models by Year. The Y axis represents the Number of Foundational Models ranging from 0 to 120. The X axis represents the Year. The data shows a significant upward trend. In 2021, there are approximately 5 models. In 2022, the count jumps to approximately 65. In 2023, it reaches 90. By 2024, the number peaks at approximately 125 models.
The second panel on the right is a bar chart titled High-Density Server Graphics Processing Unit G P U Market Revenue Worldwide in 2022, 2023, and 2028. The Y axis represents revenue in billion U S dollars from 0 to 50. The X axis lists three specific years. In 2022, revenue is 7.6 billion. In 2023, revenue increases slightly to 9.8 billion. For the year 2028, the chart shows a projected surge to 38.5 billion dollars.
However, this progress comes with significant consequences: a rapidly increasing demand for computational resources required to support the tasks in the life cycle of AI models, which involves both training (a one-time or occasional effort) and inference (repeatedly executed when the model is deployed for consumption). Although the work done (measured in FLOPs) per dollar and per watt has increased, meaning the power consumption per FLOP has decreased (see Figure 2 [left]), the number of FLOPS required to train AI models has continued to rise (see Figure 2 [right]). Consequently, the total power consumption for training AI models keeps increasing. This translates directly into escalating energy consumption (AI to Drive 165% Increase in Data Center Power Demand by 2030, 2025). For instance, it was reported in Patterson et al. (Reference Patterson, Gonzalez, Le, Liang, Munguia, Rothchild, So, Texier and Dean2021) that training the LLM powering ChatGPT-3 consumed almost 1300 megawatt hours of energy, equivalent to the annual energy usage of 130 American homes. Furthermore, an analysis by OpenAI suggests that the amount of power needed to train AI models has grown exponentially since 2012, doubling roughly every 3.4 months as the models become more sophisticated (AI and Compute, 2018).
The figure illustrates the decrease in energy consumption per GFLOPS over the years (left) and the number of FLOPS required to train different models (right).

Figure 2. Long description
The first panel is a line graph titled Energy Consumption per G F L O P S Over the Years. The x-axis represents Year from 2000 to 2025. The y-axis represents Energy Consumption in joules per G F L O P S from 0.0 to 1.0. A blue line shows a steep exponential-like decrease from 1.0 in the year 2000 to 0.1 in 2010, continuing to decline toward nearly 0.0 by 2025.
The second panel is a bar chart titled Number of F L O P S by Model. The x-axis lists four models: Transformer, G A N, G P T-3, and G P T-4. The y-axis is a log scale representing the Number of F L O P S from 10 super 11 to 10 super 25.
* Transformer and G A N bars are the lowest, positioned near 10 super 11.
* G P T-3 shows a massive increase, reaching approximately 10 super 23.
* G P T-4 is the highest, exceeding 10 super 25.
3.1. Computational demands of training and inference
AI models, especially deep learning models and LLMs, require immense computational power for both training and inference (de Vries, Reference de Vries2023).
-
• Training involves feeding the model vast amounts of data and adjusting its parameters to achieve the desired level of accuracy. This process can take weeks or even months and accounts for a significant portion (30%–40%) of an AI model’s total electricity consumption (see Figure 3 for the electricity consumption of training several prominent LLMs).
-
• Inference is the deployment and utilization of the trained AI models in real-world applications, where the model interprets new data and generates outcomes or predictions. Despite innovations in model efficiency, the inference phase accounts for the majority (60%) of the energy footprint (Power Intelligence: Analyzing Artificial Intelligence and Data Center Energy Consumption, 2024) (see Supplementary Table 1 for electricity consumption of various tasks that AI chatbots are typically asked to execute).
The figure illustrates the electricity consumption of several prominent large language models published in recent years. Although the authors usually do not provide these statistics directly, some do. Many factors influence electricity consumption, but typically, if they disclose the hardware details—such as the number of GPU hours used and the types of GPUs—it is possible to calculate the overall power consumption using the GPUs’ wattage. However, this calculation does not account for other components like CPUs, data storage, and cooling technology. Nonetheless, it indicates the resources required to train these models.

Figure 3. Long description
The chart is titled Energy Consumption of Different Models in M W h. The y-axis is labeled Model and the x-axis is labeled M W h with a scale from 0 to 1750 in increments of 250. The orange bars represent the following data from top to bottom.
* G P T 4: approximately 1750 M W h.
* G P T 3: approximately 1280 M W h.
* Gopher: approximately 1060 M W h.
* Llama 2: approximately 750 M W h.
* Llama 3.1: approximately 500 M W h.
* BLOOM: approximately 430 M W h.
* O P T: approximately 320 M W h.
* T 5: approximately 10 M W h.
While this section focuses heavily on LLMs due to their high energy intensity per query, it is important to note that LLMs represent only one manifestation of AI. Consumer-facing generative AI accounts for a massive surge in inference compute; however, the industrial applications of AI discussed later in Section 7—such as grid optimization and CCS surrogate modeling—often utilize smaller, purpose-built models (e.g., Fourier neural operators) or inference-light architectures. Therefore, the energy footprint calculated here represents a high-intensity scenario dominated by generative AI, rather than a universal baseline for all machine learning applications.
While the trends clearly indicate a rise in the computational resources required for AI models, understanding the global consumption trends for all AI-related workloads necessitates knowing where these models are being trained and hosted during the post-deployment phase. These details will be discussed in the next section.
4. Data centers: The epicenter of AI’s energy demand
Data centers are the backbone of the AI ecosystem, serving as the primary energy consumers that power the computational workloads required for training and deploying AI models. These facilities house vast arrays of servers, storage devices, and networking equipment, all of which demand significant amounts of electricity to operate. The rapid expansion of AI, particularly deep learning and LLMs, has led to an unprecedented surge in data center growth, intensifying concerns about their environmental impact (Power Intelligence: Analyzing Artificial Intelligence and Data Center Energy Consumption, 2024).
The data center industry is experiencing rapid growth worldwide, driven by the increasing demand for cloud computing, digital services, cryptocurrencies, and AI applications. The number of data centers is increasing, and their sizes are also expanding. As of March 2024, there were approximately 9,580 data centers globally, with more than half of them located in the United States (Data Center Map, 2024). Between 2015 and 2024, the electricity consumption at data centers increased from under 200 TWh to over 400 TWh (Energy and AI, 2025). Data centers are projected to consume between 4.6% and 9.1% of US electricity generation annually by 2030, up from an estimated 4% today. Some forecasts even predicted that data centers could draw up to 21% of the world’s electricity supply by 2030 (Jones, Reference Jones2018). In the United States, 15 states account for 80% of the national data center load, with data centers comprising a quarter of Virginia’s electric load in 2023. New data centers are being built with capacities ranging from 100 to 1000 megawatts, equivalent to the load from 80,000 to 800,000 homes.
It is critical to distinguish between the baseline energy consumption of data centers and the marginal growth driven by AI. Historically, data center energy use has not grown exponentially despite rising demand, due to significant efficiency gains (Masanet et al., Reference Masanet, Shehabi, Lei, Smith and Koomey2020). Current estimates suggest that AI workloads account for approximately 10%–20% of total data center electricity consumption (Energy and AI, 2025). However, AI represents the primary driver of new capacity demand. In the “Power Intelligence” report by EPRI Power Intelligence: Analyzing AI and Data Center Energy Consumption (2024), the authors note that in high-growth scenarios, the majority of the additional load is attributable to AI-specific infrastructure, distinct from traditional streaming or cloud storage services.
In Power Intelligence: Analyzing Artificial Intelligence and Data Center Energy Consumption (2024), the authors have developed four growth scenarios for US data center electricity load from 2023 to 2030: low growth (3.7% annual), moderate growth (5% annual), high growth (10% annual), and higher growth (15% annual). In the higher growth scenario, data center loads are projected to increase by a staggering 166% from 152 TWh/year in 2023 to 403 TWh/year in 2030, with the majority of this demand attributed to AI. Such projections highlight the significant energy demands of AI and data centers and the need for innovative energy management and infrastructure planning to accommodate this growth.
Compared to traditional data center infrastructure, AI-focused data centers have significantly different operational requirements and substantially higher energy demands. Hyperscale data centers, often required for AI, contain a minimum of 5,000 servers and at least 10,000 sq ft of space, enabling extreme scalability. These AI-ready data centers rely on accelerators such as GPUs (Graphical Processing Unit), NPUs (Neural Processing Unit), and tensor processing units (TPUs) to support machine learning and deep learning workloads, which generate far greater heat loads than conventional CPUs (Central Processing Unit). As a result, they require advanced cooling solutions to maintain reliability and prevent outages.
To manage these high thermal densities, many operators are shifting from air-based cooling to liquid-based technologies. In addition to direct-to-chip liquid cooling, immersion cooling—where entire servers are submerged in thermally conductive dielectric fluids—is emerging as one of the most energy-efficient approaches. Immersion cooling can dramatically improve heat-transfer efficiency, lower fan and pump power consumption, and deliver superior power usage effectiveness (PUE). Because these systems operate with fully contained coolant loops, they can also reduce or eliminate the need for evaporative cooling, thereby decreasing overall water consumption and improving water usage effectiveness (WUE). By enabling higher rack densities while lowering operational overhead, immersion cooling helps AI data centers scale more efficiently with a smaller environmental footprint.
Beyond cooling, AI data centers require high-speed networking and ultra-low-latency interconnects to move data rapidly between distributed accelerators. They also depend on specialized storage and data management systems for handling large volumes of unstructured data, such as NVMe (Non-Volatile Memory Express) SSDs (Solid-state drives) and parallel file systems like Lustre. While these capabilities support rapid scaling and high computational throughput, they also drive higher capital costs due to the increased expense of accelerators, immersion-ready infrastructure, and next-generation networking components.
Despite increasing investment in renewable energy, many regions continue to rely heavily on fossil fuels—particularly natural gas—to meet growing electricity demands (Rotman, Reference Rotman2025). Consequently, a significant share of data center energy consumption still contributes directly to GHG emissions. In regions with limited access to clean power, the surge in electricity demand from AI workloads can deepen reliance on fossil generation, complicating efforts to decarbonize the energy sector. As noted in Rotman (Reference Rotman2025), natural gas is often viewed as the only reliable and affordable option for meeting the constant 24/7 electricity load associated with large AI-focused data centers.
4.1. Water consumption
Beyond electricity, the environmental footprint of AI data centers extends to water use for cooling high-density racks. As power density increases to support GPU-heavy workloads, many facilities historically depended on evaporative cooling towers, which can consume millions of gallons of water annually. The adoption of immersion cooling and other closed-loop liquid systems offers a pathway to reduce this water dependence, shifting the sustainability profile away from evaporative methods. In drought-prone regions, these technologies are particularly valuable, helping data centers maintain operational efficiency while minimizing pressure on local water resources. A comprehensive assessment of AI’s environmental impact must therefore consider both PUE and WUE, with immersion cooling playing a critical role in improving both metrics.
4.2. Specific energy needs of AI workloads
As AI has become increasingly pervasive, it is difficult to estimate how much electricity consumption can be attributed solely to AI-related workloads. Some studies using proxies estimate that AI accounts for 10%–20% of total data center electricity consumption (see, e.g., Energy and AI, 2025), but this percentage is rapidly increasing. AI workloads, including computation, storage, and networking, have specific energy needs within data centers (Electricity, 2024—Analysis and forecast to 2026, 2024; Power Intelligence: Analyzing Artificial Intelligence and Data Center Energy Consumption, 2024).
-
• Computation: AI model training and inference require immense computational power, driving up electricity consumption. The energy intensity of AI queries is significantly higher than that of traditional Internet searches. Previous estimates suggested a single ChatGPT query consumed roughly 10x the electricity of a Google search. More recent analyses, such as those by Epoch AI (You Reference You2025) and Google’s Environmental Report (Google 2025), refine these figures, suggesting that while the disparity remains significant, the energy per query is decreasing as inference becomes more optimized. Nevertheless, the aggregate volume of queries maintains a high total energy demand. See Section 3 for a more detailed discussion on this. Studies indicate that computation accounts for 30%–40% of total energy consumption in data centers.
-
• Storage: AI models often rely on vast datasets, necessitating large-scale storage infrastructure within data centers. Storing and accessing these datasets consumes additional energy.
-
• Networking: AI applications frequently involve data transfer between different servers and locations, placing demands on data center networking infrastructure. The energy consumption associated with data transmission contributes to the overall energy footprint.
-
• Cooling systems: These systems are critical for maintaining optimal temperatures within data centers to prevent hardware malfunction and ensure longevity. However, cooling is also one of the most energy-intensive aspects of data center operations, typically accounting for 30%–40% of total energy consumption.
As we understand the global trends in data center growth and the rise of AI workloads at these facilities, along with the overall energy consumption patterns, we will present the near-term carbon footprint of AI and discuss its implications for achieving net-zero emissions in the next section.
5. The energy consumption scenarios and near-term outlook for data centers and AI
5.1. Shell’s energy security scenarios and the role of AI
Shell’s 2025 Energy Security Scenarios explore AI’s transformative role across different pathways, each highlighting a distinct impact on energy systems and societal change (Shell plc, 2025). In the Surge scenario, AI is a key driver of economic growth and societal transformation. AI optimizes manufacturing processes, enhances productivity across various sectors, and leads to increased economic activity. This surge in economic activity results in higher energy demand, which is managed efficiently by AI-powered smart grids. Additionally, AI accelerates the transition to low-carbon energy sources by optimizing the integration of renewable energy and enhancing energy storage solutions. The Archipelagos scenario presents a different picture, where AI development is hindered by global concerns about resource security, border control, and trade restrictions. Geopolitical tensions limit the sharing of AI technologies and data, slowing progress. As a result, technological advancements are slower, impacting the transformation of energy systems. In the Horizon scenario, AI plays a crucial role in achieving net-zero emissions by 2050. AI-driven innovations in energy efficiency and carbon capture technologies are pivotal in reaching this goal. AI also helps limit global warming to 1.5°C by optimizing energy consumption and reducing GHG emissions (Figure 4).
Electricity generation and associated CO2 emissions between 2020 and 2060 under the three Shell Energy Security Scenarios. Of those, only Horizon is reaching Net Zero by the 2050s (Courtesy of Shell Energy Security Scenarios, 2025).

Figure 4. Long description
A two-panel figure showing energy projections.
Left Panel: Electricity Generation 2020 to 2060. The y-axis measures T W h from 0 to 90000. The x-axis shows years from 2020 to 2060. All three scenarios start at approximately 23000 T W h in 2020.
- Surge (orange line) shows a steep linear increase, reaching the highest point at approximately 85000 T W h by 2060.
- Archipelagos (green line) follows a steady upward trend, reaching approximately 66000 T W h by 2060.
- Horizon (blue line) tracks closely with Archipelagos until 2040, then curves slightly higher to end near 66000 T W h.
Right Panel: C O sub 2 from Electricity Generation 2020 to 2060. The y-axis measures M t C O sub 2 forward slash year from negative 2000 to 9000. The x-axis shows years from 2020 to 2060. All scenarios start near 4800 M t in 2020.
- Surge (orange line) peaks at approximately 8200 M t around 2042 before declining to 5300 M t by 2060.
- Archipelagos (green line) rises slowly to a plateau of approximately 7400 M t between 2050 and 2054, ending at 6900 M t in 2060.
- Horizon (blue line) peaks earliest at 6400 M t in 2034, then enters a steep decline, crossing the zero line in the late 2050s and reaching approximately negative 800 M t by 2060.
Each scenario underscores the diverse roles AI can play in shaping future energy landscapes. The Surge scenario emphasizes AI’s potential to drive rapid economic growth and energy demand, while the Archipelagos scenario highlights the constraints and risks associated with geopolitical tensions. The Horizon scenario focuses on AI’s role in achieving sustainability goals and mitigating climate change.
5.2. Data center scenarios
To contextualize the technical energy forecasts within broader geopolitical trends, we map the sensitivity cases from the IEA’s Energy and AI (2025) report onto the socioeconomic narratives provided by Shell’s Energy Security Scenarios (2025). While these reports are independent, aligning them allows us to explore how macro-factors—such as the “Archipelagos” fragmented trade environment—might physically manifest as the “Headwinds” or “Limits to Growth” cases for AI infrastructure.
The Lift-Off Case assumes higher rates of AI adoption and proactive measures to reduce energy sector bottlenecks, envisioning rapid expansion of AI technologies and infrastructure. This scenario highlights the transformative potential of AI when supported by robust energy policies and investments, leading to significant advancements in AI capabilities and widespread adoption. The Headwinds Case incorporates various bottlenecks, including macroeconomic challenges and delays in building out necessary energy infrastructure, representing a more cautious and constrained growth scenario. This case underscores the importance of addressing external factors that can hinder AI development, such as economic instability and infrastructure limitations, which can slow progress and reduce the overall impact of AI. The High Efficiency Case focuses on significant improvements in energy efficiency, both in AI technologies and in the broader energy sector, assuming technological advancements will lead to reduced energy consumption per unit of AI output. This scenario emphasizes the potential for AI to drive sustainability and efficiency, reducing the environmental footprint of AI operations and enhancing the competitiveness of the energy sector. Lastly, the Baseline Case serves as the reference scenario, assuming current trends and policies continue without significant changes, providing a benchmark to compare the other cases against. This case offers insights into the potential future of AI development if no major interventions are made, highlighting the risks and opportunities associated with maintaining the status quo. These four scenarios provide a broad view of potential futures, helping to understand the implications of AI development on energy consumption and sustainability.
5.3. AI scenarios
In a recent study (Paccou and Wijnhoven, Reference Paccou and Wijnhoven2024), the authors presented a comprehensive outlook using a system dynamics approach to model four scenarios for AI electricity consumption: Sustainable AI, Limits To Growth, Abundance Without Boundaries, and Energy Crisis. These scenarios provide insights into potential future trajectories of AI electricity use, influenced by current AI infrastructure decisions. While all scenarios show initial growth, their paths diverge after 2030 due to various internal and external factors (Figure 5b). The Sustainable AI scenario prioritizes efficiency and sustainability, with energy consumption increasing from 100 TWh in 2025 to 785 TWh in 2035. This scenario balances technological advancement with environmental stewardship. In contrast, the Limits To Growth scenario shows minimal increase in consumption, from 510 TWh in 2030 to 570 TWh in 2035, indicating stunted economic expansion due to constraints like power availability and data scarcity. The Abundance Without Boundaries scenario projects unchecked growth, with consumption reaching 1370 TWh by 2035. This scenario highlights risks such as power centralization and inequitable AI access. Meanwhile, the Energy Crisis scenario underscores the risks of mismatched energy demand and infrastructure, with consumption peaking at 670 TWh before dropping to 190 TWh by 2035, indicating a potential energy crisis.
(a) Four scenarios for electricity demand by data centers globally between 2020 and 2035 (reproduced from Energy and AI, 2025); (b) Plausible scenarios for electricity usage by AI applications between 2020 and 2035 (reproduced from Paccou and Wijnhoven, Reference Paccou and Wijnhoven2024).

Figure 5. Long description
Panel a is a line graph titled Global electricity demand from data centers 2020-2035. The X axis shows years from 2020 to 2035 and the Y axis shows T W h from 0 to 2000. All four scenarios start at approximately 270 T W h in 2020 and diverge after 2024. The Lift-Off Case shows the steepest exponential growth reaching about 1700 T W h by 2035. The Base Case follows a steady upward curve to 1200 T W h. The High Efficiency Case reaches nearly 1000 T W h. The Headwinds Case shows the slowest growth leveling off around 700 T W h.
Panel b is a line graph titled A I Electricity Usage Scenarios Between 2020 and 2035. The X axis shows years from 2020 to 2035 and the Y axis shows T W h from 0 to 1600. All scenarios show near-zero usage until 2025. The Abundance Without Boundaries A I scenario rises sharply to 1400 T W h by 2035. The Sustainable A I scenario reaches approximately 800 T W h. The Limits To Growth A I scenario peaks around 600 T W h in 2032 and plateaus. The Energy Crisis A I scenario peaks at 700 T W h in 2030 before dropping sharply to 200 T W h by 2035.
Specific insights from these scenarios include the dominance of generative AI in the Sustainable AI scenario, focusing on less energy-intensive models. The Limits To Growth scenario highlights constraints in AI development due to power, chip manufacturing, and data scarcity. The Abundance Without Boundaries scenario warns of risks associated with unchecked AI growth, including unsustainable infrastructure costs, global inequality, and increased e-waste. The Energy Crisis scenario emphasizes the likelihood of underestimated future electricity needs due to insufficient grid planning and inaccurate demand projections. The authors note that projections for electricity consumption in TWh face challenges due to the nascent nature of the discipline, making direct comparisons difficult. However, some convergence is observed: the AI Abundance Without Boundaries scenario projects 880 TWh usage by 2030, aligning with estimates by Patel et al. (Reference Patel, Nishball and Ontiveros2024). Another projection by Kindi (Reference Kindig2024) of 652 TWh by 2030 aligns with the Sustainable AI scenario, suggesting a balanced growth trajectory.
To provide a comprehensive understanding of the potential futures for AI development and energy consumption, we have matched the Shell scenarios with the IEA sensitivity cases and the AI scenarios from Paccou and Wijnhoven (Reference Paccou and Wijnhoven2024). This alignment is based on the shared themes and underlying assumptions of each scenario. The Shell scenarios offer a broad perspective on global economic and technological trends, while the IEA sensitivity cases focus on the specific impacts of AI on the energy sector. The AI scenarios from Paccou and Wijnhoven (Reference Paccou and Wijnhoven2024) provide detailed insights into the potential trajectories of AI electricity consumption. By matching these scenarios, we can explore how different factors such as geopolitical tensions, technological advancements, and sustainability efforts might influence the future of AI and energy. This integrated approach allows us to identify common challenges and opportunities, offering a more nuanced and holistic view of the interplay between AI development and energy consumption:
-
1. Surge—Lift-Off Case—Abundance Without Boundaries: The Surge scenario envisions rapid AI adoption and technological advancements, driving significant economic growth. Similarly, the Lift-Off Case from the IEA assumes high AI adoption rates and proactive measures to reduce energy bottlenecks, highlighting AI’s transformative potential. The Abundance Without Boundaries scenario by Paccou and Wijnhoven (Reference Paccou and Wijnhoven2024) projects unrestricted AI growth, emphasizing its power to drive economic and technological progress without major constraints. These scenarios share a vision of rapid and expansive AI growth fueling economic and technological advancements. Under these scenarios, the energy demand by data centers continues to grow past 2035, exceeding 1700 TWh. AI accounts for more than three-quarters of the electricity usage (Figure 6a).
-
2. Archipelagos—Headwinds Case—Limits To Growth: The Archipelagos scenario depicts technology development hindered by global concerns about resources, borders, and trade security, leading to fragmented efforts and slower progress. Similarly, the Headwinds Case from the IEA includes various bottlenecks, such as macroeconomic challenges and infrastructure delays, representing cautious growth with significant obstacles. The Limits To Growth scenario by Paccou and Wijnhoven (Reference Paccou and Wijnhoven2024) highlights constraints on AI development due to resource limitations, emphasizing the need for careful management of AI’s energy demands. These scenarios share a focus on limitations and challenges that hinder AI and energy sector progress. Under these scenarios, energy demand by data centers plateaus by 2030 at around 700 TWh. AI accounts for approximately 80% of the electricity usage (Figure 6b).
-
3. Horizon—High Efficiency Case—Sustainable AI: The Horizon scenario focuses on achieving net-zero emissions by 2050 and limiting global warming to 1.5 °C, emphasizing sustainability and efficiency in energy use. Similarly, the High Efficiency Case from the IEA assumes significant improvements in energy efficiency, both in AI technologies and in the broader energy sector, envisioning reduced energy consumption per unit of AI output. The Sustainable AI scenario by Paccou and Wijnhoven (Reference Paccou and Wijnhoven2024) balances AI development with sustainability, highlighting the importance of generative AI inferencing and traditional AI in decarbonization efforts. These scenarios share an emphasis on achieving sustainability and efficiency in AI and energy consumption. Under these scenarios, energy demand by data centers is approaching a plateau by 2035 at nearly 1,000 TWh. AI accounts for approximately 80% of the electricity usage (Figure 6c).
-
4. Baseline Case—Energy Crisis: The Baseline Case from the IEA assumes current trends and policies continue without significant changes, serving as a benchmark for comparing other scenarios and representing a future where AI development follows existing trajectories. The Energy Crisis scenario by Paccou and Wijnhoven (Reference Paccou and Wijnhoven2024) considers the possibility of an energy crisis caused by AI, highlighting the risks of unmanaged AI development leading to significant energy consumption and potential shortages. It emphasizes the need for strategic planning and management to avoid such crises. These scenarios share a focus on the potential risks and challenges associated with AI development and energy consumption. Under these scenarios, energy demand by data centers is approaching a plateau in 2035 at around 1,200 TWh. AI electricity usage reaches its maximum in 2030, when it accounts for 70% of the data center’s electricity usage. However, due to the energy crisis, it drops to around 16% by 2035 (Figure 6d).
Historical trends and forecasts for AI electricity demand through 2035. Depending on the scenario, it is estimated that electricity demand from data centers could range between 500 and 1700 TWh, with AI workload expected to pick between 600 and 1400 TWh at some point between 2030 and 2035.

Figure 6. Long description
A four-panel set of stacked bar charts. Each chart shares a common Y-axis representing electricity demand in T W h from 0 to 1800 and an X-axis representing years from 2020 to 2035.
* Top-Left Panel: Lift-Off and A w B scenarios. The blue base representing Lift-Off Case no A I remains stable around 400 T W h. The orange section representing Abundance Without Boundaries A I grows exponentially, reaching a total of approximately 1700 T W h by 2035.
* Top-Right Panel: Headwinds and L t G scenarios. The blue base for Headwinds Case no A I declines significantly after 2027. The orange Limits To Growth A I section grows moderately, with the total demand plateauing around 700 T W h by 2035.
* Bottom-Left Panel: High Eff. and Sustainable A I scenarios. The blue High Efficiency Case no A I base drops to roughly 200 T W h by 2035. The orange Sustainable A I section grows steadily, bringing the total demand to just under 1000 T W h.
* Bottom-Right Panel: Base and Energy Crisis scenarios. The blue Base Case no A I grows steadily to 1000 T W h. The orange Energy Crisis A I section adds a smaller consistent layer, resulting in a total demand of approximately 1200 T W h by 2035.
6. The near-term carbon footprint: AI as a net contributor
Although energy consumption scenarios for data centers are based on global estimates, they can greatly vary by country. This leads to a diverse global landscape influenced by global trends, local conditions, policies, and decisions. In fact, geopolitical factors play a crucial role in shaping AI’s impact on the energy transition and carbon footprint in the short term. Regulatory frameworks across different countries can either accelerate or hinder AI advancements, influencing how quickly AI technologies are adopted in energy sectors. National security concerns drive investments in AI for defense and surveillance, which can divert resources from sustainable energy initiatives. International trade policies and technological alliances also affect the global distribution of AI technologies, impacting their deployment in renewable energy projects (World Economic Forum, 2024). Control over semiconductor supply chains, essential for AI hardware, can create geopolitical tensions, affecting the availability and cost of AI technologies. Additionally, countries leading in AI development, such as the United States and China, have significant influence over global AI policies and standards, shaping the direction of AI applications in energy efficiency and carbon reduction. These geopolitical dynamics, combined with societal factors like public perception and workforce adaptation, will determine AI’s role in achieving a sustainable energy transition and reducing carbon emissions (Iqbal et al., Reference Iqbal, Zhang and Jahangir2025).
Despite the growing emphasis on renewable energy, many regions still rely heavily on fossil fuels to power their electricity grids. This means that a significant portion of data centers’ energy consumption is indirectly contributing to GHG emissions. In regions with limited access to clean energy sources, the increasing electricity demands of data centers can exacerbate the reliance on fossil fuels, hindering efforts to decarbonize the energy sector (Maher et al., Reference Maher, Meinecke, Gromier, Garcia-Novelli and Fortmann2022).
As we probe the various scenarios in data center growth and the rise of AI workloads at these facilities, it will be important to deliberate on their near-term carbon footprint and its implications for achieving net-zero emissions. Depending on the energy mix used to generate electricity, the CO2 emissions largely vary from region to region. In some locations, the data centers claim to be 100% renewable, but in many different places, it varies. Due to the lack of detailed CO2 data for electricity generation in the three Shell scenarios, we based our calculations on the CO2 emissions from the primary energy production (not only electricity). As the primary energy mix changes over time from fossil fuels to renewable energy, the associated CO2 emissions are declining accordingly. As we see in Figure 7a, the rate of decline varies between scenarios. For the CO2 estimates by data centers and AI workloads, the corresponding Shell scenarios were used as described in the previous section. For the Base Case scenario, the average energy mix between the Surge and Archipelagos scenarios was used, as they represent rather opposing cases. More precisely, the CO2 emissions by data centers in the Headwinds Case and the High Efficiency Case reached a plateau by 2030 at around 130–150 Mt CO2 per year. In the High Efficiency Case, the trend started pointing downwards by 2035. Finally, in the Base and Lift-Off Cases, the CO2 emissions continued to increase past 2035, albeit at different rates, reaching 210 and 300 Mt per year, respectively (Figure 7a). In the case of AI, the CO2 emissions from electricity usage in Sustainable AI and Limits to Growth plateaued around 2030 at around 115 Mt per year. On the contrary, the Abundance without Boundaries scenario grew at a much faster pace, reaching 240 Mt CO2 by 2035 with no clear signs of slowing down. Finally, the Energy Crisis scenario peaked at 130 Mt CO2 in 2030, followed by a rapid decline to 35 Mt within 5 years (Figure 7b). For context, 100 Mt CO2 is equivalent to the emissions from nearly 13.5 million American homes’ energy usage for 1 year (EPA Calculator, n.d.).
Historical trends and forecasts for CO2 emissions from (a) data centers and (b) AI workloads through 2035. These forecasts are based on the data provided in the Shell plc (2025), Energy and AI (2025), and Paccou and Wijnhoven (Reference Paccou and Wijnhoven2024).

Figure 7. Long description
Two side-by-side line graphs.
Left graph: C O sub 2 emissions by data centers 2020-2035.
* X-axis: Years from 2020 to 2035.
* Y-axis: M t C O sub 2 forward slash year, ranging from 0 to 350.
* Data: All scenarios start at approximately 55 M t in 2020. The Lift-Off Case (orange) shows a steep sigmoid curve peaking near 300 M t. The Base Case (blue) rises to about 210 M t. The High Efficiency Case (dark green) peaks at 150 M t in 2032 before a slight decline. The Headwinds Case (purple) plateaus at 130 M t by 2030.
Right graph: C O sub 2 emissions from electricity usage by A I 2020-2035.
* X-axis: Years from 2020 to 2035.
* Y-axis: M t C O sub 2 forward slash year, ranging from 0 to 250.
* Data: Emissions are near zero until 2024. The Abundance Without Boundaries A I (green) shows an exponential-like increase reaching 240 M t. The Sustainable A I (purple) and Limits To Growth A I (orange) follow similar paths, peaking around 110-120 M t. The Energy Crisis A I (light blue) peaks at 130 M t in 2030 before sharply declining to 35 M t by 2035.
As illustrated in Figure 7, these scenarios present contrasting perspectives on the penetration of AI and its impact on CO2 emissions. For example, the Lift-Off Case from IEA is more optimistic, projecting the highest CO2 emissions, whereas the Energy Crisis scenario from Paccou and Wijnhoven (Reference Paccou and Wijnhoven2024) is pessimistic, predicting the least emissions. Although these reports present extreme scenarios, we believe the reality lies somewhere in between. It is often preferable to provide an interval within which the forecasted CO2 emissions are expected to fall. To determine this interval, we consider the mean scenario presented in Figure 7 and calculate the P5, P50, and P95 probability cases around that, which will be described next.
6.1. Mean scenario and probabilistic assessment
To generate the potential range of CO2 emissions under various assumptions and scenarios and to understand the variability and uncertainty in future emissions projections, a comprehensive methodology has been developed. This methodology includes a list of factors that influence emissions in data centers and the relationship between these factors and emissions. Supplementary Table 2 describes the factors that we considered to influence the emissions at the data centers. It is important to note that the mean scenario calculated from Figure 7 is captured in the last column, and the values for other factors were taken from various reports and studies carried out that represent the actual numbers available until 2024 and the forecasts until 2035.
The energy mix factor and AI workload at the data centers used for Figure 7 have also been reported here. The mean and standard deviation for each variable are used to define the 99% confidence interval, which provides the probabilistic range that the MC simulations can use to generate many such possibilities and then calculate the emissions for each possibility. Our main hypothesis is that the extreme scenarios depicted in Figure 7 would be highly unlikely to occur. An important point to note here is that these years include two pandemic years, where there is no significant deviation in the variation for these factors. In order to make predictions for each possibility, a mathematical model was fitted to the data presented in the Supplementary Table 2 with Columns 2–5 as inputs and Column 6 as output. Historical data is integrated into the model to validate its accuracy and ensure that the projections are grounded in real-world observations. For example, the mean scenario curve perfectly honors the historical and forecast data presented in Supplementary Table 2. Different scenarios (P5, P50, and P95) represent varying levels of probability, with P5 being the pessimistic one, with 5% of the time the outcome will fall below this value, P50 the median, and P95 the optimistic one, with 95% of the time that the outcome will fall below this value. Key assumptions made in the methodology include the stability of certain factors over time and the exclusion of extreme events. These assumptions, along with potential limitations and uncertainties, are acknowledged to provide a balanced view of the projections. The impact of AI workloads on CO2 emissions is specifically accounted for in the model, recognizing that AI-related activities can significantly influence energy consumption. The energy mix factor, which defines the ratio of fossil versus renewable energy used, is a critical component of the model, as it directly affects the emissions calculations. Below is a summary of the methodology and steps involved to compute the P5, P50, and P95 probability scenarios:
-
1. Calculate the mean CO2 emission scenario from all the scenarios presented in Figure 7.
-
2. Identify factors potentially impacting CO2 emissions at data centers and gather past and future forecasts from published reports and literature from 2020 to 2035.
-
3. Develop and validate a model honoring the data from Step 2.
-
4. Determine the mean and standard deviation of each variable and the corresponding 99% confidence interval for data variation.
-
5. Perform MC simulations using combinations of parameters sampled from the confidence intervals and apply the approximated curve to find the corresponding emissions for each realization.
-
6. Calculate the P5, P50, and P95 probability cases based on the predictions.
Figure 8 illustrates the P5, P50, and P95 probability scenarios calculated using the methodology described above. As it can be clearly depicted, the P5, P50, and P95 cases showcase a healthy deviation from the mean case; however, the deviation is not as extreme as predicted in either the IEA or Paccou et al. Our modeling does not prioritize an energy crisis scenario as the most probable outcome, though such risks cannot be ruled out. We expect a deviation from the mean scenario, but not an extreme one. The reason is that most of the emissions are expected to come from data centers, and the data center growth does not support such an extreme scenario. On the other hand, we do not expect an energy crisis scenario, as we have not seen such a one in the last 20 years (including the COVID-19 pandemic). In summary, while AI applications have clear benefits for environmental initiatives, it is challenging to translate these insights into actual carbon reduction efforts due to the time it takes for AI to have an impact on carbon reduction. Despite technical advances such as model optimizations (e.g., low-rank approximations, smaller and more efficient models), green AI hardware, and the use of renewable energy sources to power data centers, we anticipate that AI will have a net positive impact on carbon emissions in the near future. It will take several years, possibly beyond 2035, for AI to start having a net negative impact on carbon emissions due to technical advancements and penetration, which will be discussed in the next section.
The P5, P50, and P95 probability scenarios were generated based on the following assumptions: (a) The input variables listed in Supplementary Table 2 were assumed to follow a normal distribution. The ranges for these variables were selected within a 99% confidence interval around the mean scenario. (b) The scenarios presented in Paccou and Wijnhoven (Reference Paccou and Wijnhoven2024) were reproduced without considering the energy crisis scenario.

Figure 8. Long description
Two panels, (a) and (b), show Predicted C O sub 2 Emissions in M t per year on the Y-axis against Time in years on the X-axis from 2018 to 2036.
Both graphs share a common legend including:
- Low-Case Scenario P 5
- Mid-Case Scenario P 50
- High-Case Scenario P 95
- Observed C O sub 2 Emissions (black triangles)
- Abundance Without Boundaries A I (light blue dashed line)
- Limits To Growth A I (green dashed line)
- Sustainable A I (dark blue dashed line)
- Energy Crisis A I (red dashed line)
- Mean Scenario Data (black squares)
- Mean Scenario Model (yellow line)
In panel (a), all scenarios show a slow increase until 2024, followed by a steep rise. By 2030, the scenarios diverge. The High-Case P 95 and Mean Scenario plateau around 125 to 150 M t per year. The Energy Crisis A I scenario peaks at 2030 and then shows a sharp decline toward 40 M t per year by 2035. The Abundance Without Boundaries A I continues a steep linear increase, reaching nearly 250 M t per year by 2035.
In panel (b), the trends are similar but show higher variance in the upper-bound scenarios. The High-Case P 95 and Abundance Without Boundaries A I lines are closely grouped, both trending toward 240 M t per year by 2035. The Mid-Case P 50 scenario settles higher than in panel (a), reaching approximately 160 M t per year. The Energy Crisis A I scenario again shows a significant drop-off after 2030.
7. The long-term promise: AI as a net-zero enabler
7.1. The rebound effect and Jevons’ paradox
While AI offers significant potential for decarbonization, these benefits are not guaranteed. We must consider the “rebound effect” (or Jevons’ paradox), where efficiency gains enabled by AI lower the cost of energy or computing, paradoxically leading to increased total consumption. For example, while AI optimization may reduce the energy required to train a single model, this efficiency often incentivizes the training of larger, more complex models or the deployment of AI into new domains, potentially negating the initial savings. Consequently, the “Net-Zero” enabling potential of AI described in this section assumes a framework where efficiency gains are coupled with systemic decarbonization policies, rather than unchecked consumption growth.
The increasing presence of AI raises concerns about its energy consumption. However, it also has the potential to reduce emissions and help achieve climate targets. AI applications can optimize energy usage in sectors such as transportation, manufacturing, and agriculture. For example, AI-powered smart grids can enhance grid efficiency, minimize energy loss during transmission, and seamlessly integrate renewable energy sources. A study indicates that intelligent applications coupled with smart grids could reduce energy consumption by 15% (Jin et al., Reference Jin, Bao, Luo and Wang2024). AI-based applications are already enabling predictive maintenance, anticipating equipment failures, thereby reducing downtime and energy waste. Furthermore, AI can optimize supply chains, leading to decreased transportation emissions. AI can accelerate project delivery timelines for CCS through very fast surrogate-based modeling. It is difficult to gauge the overall impact of AI on CO2 reductions as there are many technological, socio-economic, and political factors influencing that journey. A recent study from Google and BCG suggests that implementing AI for corporate sustainability could result in a substantial 2.6–5.3 gigaton reduction in CO2 equivalent by 2030 if potential optimizations were to fully penetrate industry (Maher et al., Reference Maher, Meinecke, Gromier, Garcia-Novelli and Fortmann2022). Similarly, Energy and AI (2025) reported that AI applications in the energy sector could lead to a reduction of 1.4 gigatons of CO2 by 2035 in the Widespread Adoption Case. Construction of the energy system is shifting from large bespoke projects built in the field to modular units produced on assembly lines, for example, solar photovoltaic modules and grid batteries. Another example is small modular reactors (SMRs), which are a new generation of nuclear reactors designed to be smaller, more flexible, and more cost-effective than traditional large-scale reactors. SMRs can be manufactured in factories and transported to sites, which reduces construction time and costs. They offer enhanced safety features, such as passive cooling systems that do not require human intervention or external power sources. Additionally, SMRs can be deployed in remote locations or integrated into existing power grids, making them a versatile option for expanding nuclear energy capacity and reducing carbon emissions. Developments in a number of decarbonization and carbon removal technologies are crucial to lowering energy system emissions. AI has started to accelerate and increase the efficiency of such technologies.
7.1.1. Nuclear power
AI is aiding nuclear energy in reducing emissions through various applications. AI is being used to optimize the designs and operation of small SMRs and their integration into the energy grid. AI algorithms are finding ways to enhance the efficiency of SMRs by predicting the most effective operational parameters, thus maximizing energy output while minimizing waste. By optimizing reactor operations, AI enhances energy generation efficiency (Alatalo et al., Reference Alatalo, Heilimo, Rantonen, Väänänen and Sipola2025). Predictive maintenance powered by AI helps foresee equipment failures, reducing downtime and ensuring peak operational efficiency (Myers et al., Reference Myers, Panczyk, Chidige, Craig, Cooper, Joynt and Radaideh2025). Accurate energy demand forecasting allows for better planning, reducing reliance on backup fossil fuel plants (Alatalo et al., Reference Alatalo, Heilimo, Rantonen, Väänänen and Sipola2025). AI also enhances safety by monitoring reactor data in real-time to identify anomalies, thus preventing potential accidents (Myers et al., Reference Myers, Panczyk, Chidige, Craig, Cooper, Joynt and Radaideh2025). Additionally, AI improves grid management, ensuring efficient energy distribution and lowering fossil fuel dependence (Khym and Vasquez, Reference Khym and Vasquez2025).
7.1.2. Wind and Solar
AI is playing a transformative role in reducing emissions from wind and solar energy by optimizing various aspects of these renewable energy systems. In wind energy, AI enhances efficiency through precise weather forecasting and wind analysis, allowing for better planning and operational adjustments. AI-driven predictive maintenance helps identify potential issues before they become significant problems, reducing downtime and ensuring turbines operate at peak efficiency. Additionally, AI-powered tools for turbine monitoring and inspection improve safety and performance by detecting defects that might be missed by human inspectors (Dörterler et al., Reference Dörterler, Arslan and Özdemir2024; Morkos, Reference Morkos2025). In solar energy, AI maximizes energy output by analyzing data from various sources, such as weather conditions and system performance, to predict energy production and optimize energy storage. Predictive analytics and machine learning algorithms enhance the efficiency of solar panels by managing factors like shading and angle adjustments (Gul et al., Reference Gul, Baldinelli, Wang, Bartocci and Shamim2025; SolarAI, 2025). AI also plays a crucial role in improving grid management, ensuring that the energy generated from wind and solar sources is distributed efficiently, reducing reliance on fossil fuels and lowering overall emissions (Khym and Vasquez, Reference Khym and Vasquez2025).
7.1.3. Biofuels
By leveraging AI and machine learning algorithms, researchers can optimize the entire biofuel production process, from feedstock selection to final fuel production. AI helps in analyzing large datasets to identify the most efficient feedstocks and processing conditions, thereby maximizing yield and minimizing environmental impact. Predictive models developed using AI can forecast the performance of different biofuel production methods, allowing for better planning and resource allocation (Okolie, Reference Okolie2024). Additionally, AI-driven automation in bioprocessing can enhance the efficiency and consistency of biofuel production, reducing waste and emissions. AI also aids in the development of advanced catalysts and enzymes that can accelerate biofuel production while lowering energy consumption (Artificial Intelligence and Machine Learning for Bioenergy Research: Opportunities and Challenges, 2023; Salama, Reference Salama2025).
7.1.4. Hydrogen
Green hydrogen energy, produced through water electrolysis, has emerged as a crucial technology in this transition. Proton exchange membrane water electrolyzers (PEMWEs) have gained significant attention due to their efficiency and compatibility with renewable energy sources, positioning them as a frontrunner in green hydrogen production technologies. Challenges with PEMWEs include the need for innovative research to overcome existing limitations in key materials such as electrocatalysts, membranes, membrane electrode assemblies (MEAs), stacks, and systems. AI’s transformative potential in PEMWE research focuses on the discovery and optimization of key materials, as well as the design and management of MEAs, cells, and stacks (Wang et al., Reference Wang, Xiang, Meng, Tang, Dong, Yang, Du and Ye2025). AI-enabled simulations provide valuable insights during feasibility studies, helping to determine the optimal number of electrolyzers, capacity utilization, and energy demand for hydrogen production. These simulations also incorporate renewable energy models, weather forecasts, and electricity market prices to optimize the entire lifecycle of hydrogen projects. Furthermore, AI plays a vital role in managing energy grids, ensuring efficient integration of hydrogen energy, and reducing reliance on fossil fuels (Mullanu et al., Reference Mullanu, Chua, Molnar and Yavari2024).
7.1.5. Carbon Capture and Storage (CCS)
Several key technological advancements in CCS technologies are crucial for reducing the carbon footprint of energy-intensive industries, including AI. One significant advancement is the development of smaller, more efficient capture systems. These systems are designed to be more compact and cost-effective, making them suitable for a wider range of applications. For example, the use of modular capture units that can be easily integrated into existing industrial processes. These units are capable of capturing CO2 emissions at a lower cost and with higher efficiency compared to traditional systems. Another important development is the integration of CCS with renewable energy sources. This approach involves using renewable energy to power the capture and storage processes, thereby reducing the overall carbon footprint of the CCS operations. For instance, some CCS projects are now being powered by solar or wind energy, which not only reduces emissions but also enhances the sustainability of the entire process. New storage techniques, such as mineral carbonation and enhanced oil recovery (EOR), are being developed with the help of AI to improve the efficiency and safety of CO2 storage. Recent advances in operator learning are accelerating flow simulations conducted to quantify the CO2 plume migration by three to four orders of magnitude (Chandra et al., Reference Chandra, Koch, Pawar, Panda, Azizzadenesheli, Snippe, Alpak, Hariri, Etienam, Devarakota, Anandkumar and Hohl2024; Pawar et al., Reference Pawar, Chandra, Panda, Devarakota, Alpak, Snippe and Hohl2025). These technological advancements are crucial for reducing the carbon footprint of energy-intensive industries, including AI. By making CCS more efficient, cost-effective, and sustainable, these innovations help mitigate the environmental impact of AI and other advanced technologies, contributing to global climate goals (Global Status of CCS: Collaborating for a Net-Zero Future, 2024).
7.1.6. Quantum computing
Advances in quantum computing have the potential to significantly impact AI applications, reduce energy demand for data centers, and contribute to the reduction of overall GHG emissions. Quantum computing can enhance AI by providing unprecedented computational power, enabling more advanced models and algorithms, and optimizing AI processes for greater efficiency. This can lead to breakthroughs in natural language processing, optimization, and machine learning. In data centers, quantum computing can reduce energy consumption by performing calculations more efficiently and optimizing cooling processes through advanced quantum algorithms. This efficiency can lower operational costs and reduce the environmental impact of data centers. Additionally, quantum computing can aid in the development of innovative climate solutions, such as new materials and catalysts for CCS and more efficient renewable energy technologies. These advancements can play a crucial role in mitigating climate change and reducing GHG emissions, aligning with global sustainability goals. However, quantum computing is still in its nascent phases, and the realization of its promises is not expected anytime soon.
As part of the energy system decarbonization, AI can also transform transportation, a major source of emissions. Self-driving vehicles, optimized traffic systems, and improved logistics planning have the potential to significantly reduce our reliance on fossil fuels. By analyzing real-time data, AI can forecast traffic trends, streamline routes, and reduce congestion. Research on traffic prediction encompasses various models, with examples including feature-based models (Li et al., Reference Li, Cao, Guan, Zhou, Liang, So and Szczecinski2019), Gaussian process models (Salinas et al., Reference Salinas, Bohlke-Schneider, Callot, Medico, Gasthaus, Wallach, Larochelle, Beygelzimer, d’Alché-Buc, Fox and Garnett2019), state-space models (Duan et al., Reference Duan, Mao and LiangWand Zhang2019), and deep learning models (Yin et al., Reference Yin, Wu, Wei, Shen, Qi and Yin2022). Autonomous vehicle development is another nascent area for AI (Bojarski et al., Reference Bojarski, Testa, Dworakowski, Firner, Flepp, Goyal, Jackel, Monfort, Muller, Zhang, Zhang, Zhao and Zieba2016; Wu et al., Reference Wu, Kreidieh, Vinitsky, Bayen, Levine, Vanhoucke and Goldberg2017), predominantly targeting safety and energy efficiency. AI-driven smart mobility systems have the potential to improve the energy efficiency of public transportation through dynamic scheduling to guarantee timely arrivals and departures. Finally. AI can accelerate the discovery of sustainable materials for vehicles and associated manufacturing processes. Another important element of the energy system is the heating and cooling of buildings. AI models can process sensor data at the building and city levels to optimize heating and cooling systems, lighting, and energy consumption patterns (Qolomany et al., Reference Qolomany, Al-Fuqaha, Gupta, Benhaddou, Alwajidi, Qadir and Fong2019; Pham et al., Reference Pham, Ngo, Ha Truong, Huynh and Truong2020; Zekić-Sušac et al., Reference Zekić-Sušac, Mitrović and Has2021; Ghazal et al., Reference Ghazal, Hasan, Ahmad, AlshuridehM, Alshurideh, Al Kurdi, Masa’deh, Alzoubi and Salloum2023), leading to energy savings and a reduction in carbon emissions (Milojevic-DupontNand Creutzig, Reference Milojevic-DupontNand Creutzig2021; Zhang et al., Reference Zhang, Kafy, Xiao, Han, Zou, Saha, Zhang and Tan2023).
8. Mitigating AI’s energy impact: Strategies and solutions
Research in green AI hardware can transform the sustainability of AI by prioritizing energy efficiency and reducing environmental impact. Recent advancements include energy-efficient GPUs, TPUs, and neuromorphic chips, which consume significantly less power compared to traditional hardware (Clemm et al., Reference Clemm, Stobbe and WimalawarneKand Druschke2024; Tabbakh et al., Reference Tabbakh, Amin, Islam, Mahmud, Chowdhury and Mukta2024). Advances in hardware design are now targeting the creation of AI accelerators that combine high performance with environmental sustainability. This effort includes developing processors that can run AI algorithms with very low energy consumption (Rahmani et al., Reference Rahmani, Shetty, Wagih, Ghasempour, Palazzi, Carvalho, Correia, Costanzo, Vital, Alimenti, Kettle, Masotti, Mezzanotte, Roselli and Grosinger2023). Ongoing research aims to create AI devices capable of harvesting energy from their surroundings to power AI systems (Bolón-Canedo et al., Reference Bolón-Canedo, Morán-Fernández, Cancela and Alonso-Betanzos2024). Examples include utilizing ambient light, vibrations, and heat. By incorporating energy-harvesting features, these AI devices could become more self-sufficient, reducing reliance on external power sources and promoting a more sustainable deployment of AI (Divya et al., Reference Divya, Panda, Hajra, Jeyaraj, Paul, Park, Kim and Oh2023; Ali et al., Reference Ali, Shaukat, Bibi, Altabey, Noori and Kouritem2023). Neuromorphic computing represents a significant shift in computing technology, inspired by the architecture of the human brain to create more efficient and adaptive systems. The human brain’s remarkable energy efficiency allows it to perform complex tasks with far less energy than conventional computers. By emulating this efficiency, neuromorphic computing aims to reduce the energy consumption of computational processes to levels similar to those of biological brains. This is achieved through the use of spiking neural networks (SNNs), which mimic the behavior of biological neurons, leading to substantial energy savings and performance enhancements, especially in AI applications that require real-time processing and decision-making. Additionally, a sustainability proposal by Oh et al. (Reference Oh, Kim, Kim, Kim, Park and Lee2023) suggests creating biodegradable neural network hardware to mitigate the impact of technological waste. Powering data centers with renewable energy sources is a crucial step toward reducing the carbon footprint of the rapidly growing digital infrastructure. Integrating renewable energy, such as solar and wind power, into data center operations can help mitigate the environmental impact of these energy-intensive facilities (Brown and Gorham, Reference Brown and Gorham2014). However, the variability of renewable energy sources poses challenges, which can be addressed through innovative solutions like virtual batteries that shift computational demand to match power availability (Agarwal et al., Reference Agarwal, Sun, Noghabi, Iyengar, Badam, Chandra, Seshan and Kalyanaraman2021). Additionally, advancements in energy storage technologies and smart grid integration are essential for ensuring a stable and reliable power supply (Hussain, Reference Hussain2024). These efforts not only support sustainability goals but also align with the increasing corporate commitments to carbon neutrality (Agarwal et al., Reference Agarwal, Sun, Noghabi, Iyengar, Badam, Chandra, Seshan and Kalyanaraman2021). CCS is a versatile technology and can be an enabler for data center decarbonization, with the potential to capture 90–95+ % of a power generation facility’s CO2 emissions (Barlow and Kearns, Reference Barlow and Kearns2025). A business model is emerging that applies CCS to purpose-built power generation facilities “behind the meter” (not connected to municipal electric grids) to minimize data center carbon emissions while meeting their firm, high-reliability power demand. In this model, CO2 emissions from natural gas turbines are captured, transported, and permanently stored before they reach the atmosphere—significantly decarbonizing the data center power supply. Industry is responding to the data center decarbonization opportunity in the United States and other countries. Further details can be found in the Role of CCS in US Data Centre Decarbonisation (2025).
Recent advancements in deep learning have focused on reducing the size of neural networks to enhance computational efficiency and enable deployment in resource-constrained environments. One approach involves a pruning algorithm that retrains the smaller, pruned model at its faster, initial learning rate, resulting in models that are simpler and more accurate (Renda et al., Reference Renda, Frankle and Carbin2020). Another comprehensive review highlights techniques such as pruning, quantization, low-rank factorization, knowledge distillation, and transfer learning, all of which effectively reduce model size while retaining performance. A study on global weight compression demonstrates that deploying deep neural networks to devices requiring real-time processing can save memory, reduce storage size, and lower computational requirements (Dantas et al., Reference Dantas, Sabino da Silva, Cordeiro and Carvalho2024). An example advancement is the PocketNet paradigm, which aims to reduce the size of deep learning models used in medical image analysis. The authors propose a modification to existing convolutional neural network architectures that limits the growth of the number of channels, thereby significantly reducing the number of parameters. This approach maintains comparable performance to conventional neural networks while using up to 90% less GPU memory and speeding up training times by up to 40%. The paper demonstrates the effectiveness of PocketNet in various segmentation and classification tasks, highlighting its potential for deployment in resource-constrained settings (Celaya et al., Reference Celaya, Actor, Muthusivarajan, Gates, Chung, Schellingerhout, Riviere and Fuentes2023). DeepSeek, a Chinese AI model, has garnered significant attention for its energy-efficient approach to AI. Unlike traditional models, DeepSeek employs a “mixture of experts” technique during training, where only a portion of the model’s parameters are activated at any given time. This method, combined with improved reinforcement learning techniques, has led to more efficient training processes. However, while DeepSeek’s training phase is notably energy-efficient, its inference phase tends to be more energy-intensive. The model generates longer responses compared to similar models, which offsets some of the energy savings achieved during training (O’Donnell, Reference O’Donnell2025). Despite its energy-efficient training, DeepSeek’s overall impact on energy consumption remains complex. The model’s longer inference responses require substantial computational power, which can lead to higher energy usage in data centers. This phenomenon is consistent with the broader trend in AI development, where efficiency gains in training often result in increased overall energy consumption due to the expanded capabilities and applications of the models (O’Donnell, Reference O’Donnell2025). As companies strive to develop more intelligent systems, they tend to invest more in training, thereby using more energy. This dynamic underscores the importance of considering both training and inference phases when evaluating the energy efficiency of AI models. The introduction of DeepSeek has significant implications for the tech industry and energy sector. While its energy-efficient training methods offer a promising solution to the growing energy demands of AI, the model’s inference phase highlights the need for balanced approaches to AI development. The rapid adoption of DeepSeek-like models could strain power grids and challenge energy security. To ensure AI remains an environmentally friendly tool, several strategies are crucial: These include focusing on green AI hardware and powering data centers with renewable energy sources to reduce the environmental impact of AI operations. Research into model optimization techniques can also lead to more energy-efficient models, as discussed above. Furthermore, standardized environmental impact assessments and collaboration between AI developers and sustainability experts can promote transparency and responsible development throughout the AI lifecycle.
9. Scope and limitations
While this paper brings together diverse and credible data sources to project AI’s energy trajectory, several conceptual and methodological limitations must be clarified to appropriately interpret our conclusions regarding AI’s long-term emissions footprint and its capability as a decarbonization enabler:
-
• Analytical Separation of Footprint and Enablement: This study addresses two mathematically distinct phenomena: (1) the quantitative environmental footprint of AI infrastructure, including data center electricity demand, and (2) the potential emissions reductions enabled by AI applications across other economic sectors. Because our models are not dynamically coupled into a unified macroeconomic framework, we caution against synthesizing the footprint and enablement narratives into a singular “net impact.” Our quantitative risk evaluation is fundamentally isolated from our discussion on AI’s qualitative enabling potential. To state definitively whether the benefits mathematically offset the costs remains beyond our current methodology.
-
• Qualitative Assessment of Reductions: The potential benefits of AI across sectors (e.g., energy systems optimization, transport, and Carbon Capture, utilization and Storage (CCUS)) detailed in this paper are largely drawn from qualitative surveys of existing literature. We do not attempt to deterministically quantify the magnitude or probability of these reductions within our MC simulations. For example, applying a simple breakeven calculation to our P50 projections implies AI would need to catalyze systemic global emissions reductions on a massive scale merely to neutralize its own operational footprint.
-
• Reliance on Scenario Synthesis: Our MC probabilistic simulations layer mathematical uncertainty analysis over base scenarios derived from previously published studies, particularly the IEA Energy and AI report (Paccou and Wijnhoven, Reference Paccou and Wijnhoven2024). Consequently, our primary analytical contribution entails synthesizing, reframing, and probabilistically modeling the risk profiles of these external reference scenarios, rather than generating fundamentally new foundational empirical benchmarks.
-
• The Rebound Effect Remains Unmodeled: While we address Jevons’ paradox conceptually, dynamic rebound effects have not been mathematically integrated into our modeling architecture. Because improved computational efficiency conventionally induces disproportionately higher AI consumption, ignoring downstream rebound dynamics implies our infrastructure emission trajectories likely function as conservative, lower-bound estimates. Effectively analyzing Jevons’ paradox would necessitate computable general equilibrium (CGE) modeling, constituting an important frontier for future research.
10. Conclusions
In this paper, we analyzed the impact of the rise of AI, the demand for building data centers, electricity consumption, and demand patterns, and the subsequent effects on CO2 emissions and net-zero goals. Specifically, we presented a comprehensive scenario synthesis of various factors driving electricity consumption, outlining both near-term and long-term trajectory risk profiles. While the broader public discourse often frames AI’s environmental impact as a singular “net positive” or “net negative” equation, our probabilistic approach explicitly separates the quantitative assessment of infrastructure emissions from the qualitative synthesis of potential decarbonization benefits across various sectors. We provided a probabilistic assessment of CO2 emissions for the direct infrastructure footprint based on the mean scenario derived from recent projections by Energy and AI (2025) and Paccou and Wijnhoven (Reference Paccou and Wijnhoven2024), using the methodology presented in Shell Energy Security (Scenarios, 2025). Our P5, P50, and P95 cases indicate that while AI growth is expected to continue over the next 10 years, it is highly unlikely to reach the extreme infrastructure scenarios depicted in Energy and AI (2025) and Paccou and Wijnhoven (Reference Paccou and Wijnhoven2024). Instead, we anticipate deviations from the mean scenario, but are bounded by physical grid constraints and realistic data center expansion limits. Additionally, we do not foresee an energy crisis scenario, as there has been no significant precedent for such an event in the past 20 years.
In conclusion, although AI’s potential as a decarbonization enabler is profoundly promising in theory, it is heavily caveated by the uncertainty of macroeconomic feedback loops, such as Jevons’ paradox, and the reality that AI must offset a very large foundational footprint before achieving true “net-zero” enablement. Therefore, rather than assuming AI inherently guarantees a net positive emissions balance, this synthesis underscores that AI’s climate contribution will functionally depend on aggressive investments in both energy-efficient hardware and the massive scaling of zero-carbon grids. Focus must remain on responsible AI development and deployment, leveraging public and private partnerships to actively constrain the direct footprint while purposefully steering AI tools toward critical net-zero transition technologies.
Supplementary material
The supplementary material for this article can be found at http://doi.org/10.1017/dce.2026.10058.
Data availability statement
The data and models used to generate scenarios are confidential and cannot be made available.
Acknowledgments
The authors thank Shell Information Technology International Inc. and Shell International Exploration and Production Inc. for permission to publish this work. Additionally, we are grateful to our colleagues—including Juben Chheda, Mariela Araujo, Christian Davies, Pak Leung, and Albena Mateeva—for their meaningful discussions and valuable contributions that shaped the final paper.
Author contribution
Conceptualization: P.D., F.O.A., D.H.; Investigation: N.T., F.O.A., A.G.; Methodology: P.D., N.T., F.O.A.; Supervision: D.H.; Validation: A.G.; Writing—original draft: P.D., N.T., F.O.A.; Writing—review and editing: A.G.
Funding statement
This work was funded by Shell Information Technology International Inc.
Competing interests
The authors declare none.
Disclaimer
This document presents scenario-based analysis and projections related to AI, energy demand, and CO2 emissions. The findings and views expressed are exploratory and do not constitute forecasts, commitments, or guarantees by Shell or its affiliates. All forward-looking statements are subject to significant uncertainties and assumptions. Actual outcomes may differ materially. References to third-party data, technologies, or companies are for illustrative purposes only and do not imply endorsement or verification. This document should not be interpreted as a reflection of Shell’s current or future business strategy, investment decisions, or regulatory positions. The preprint version of the paper can be viewed here (Devarakota et al., Reference Devarakota, Tsesmetzis, Alpak, Gala and Hohl2025).
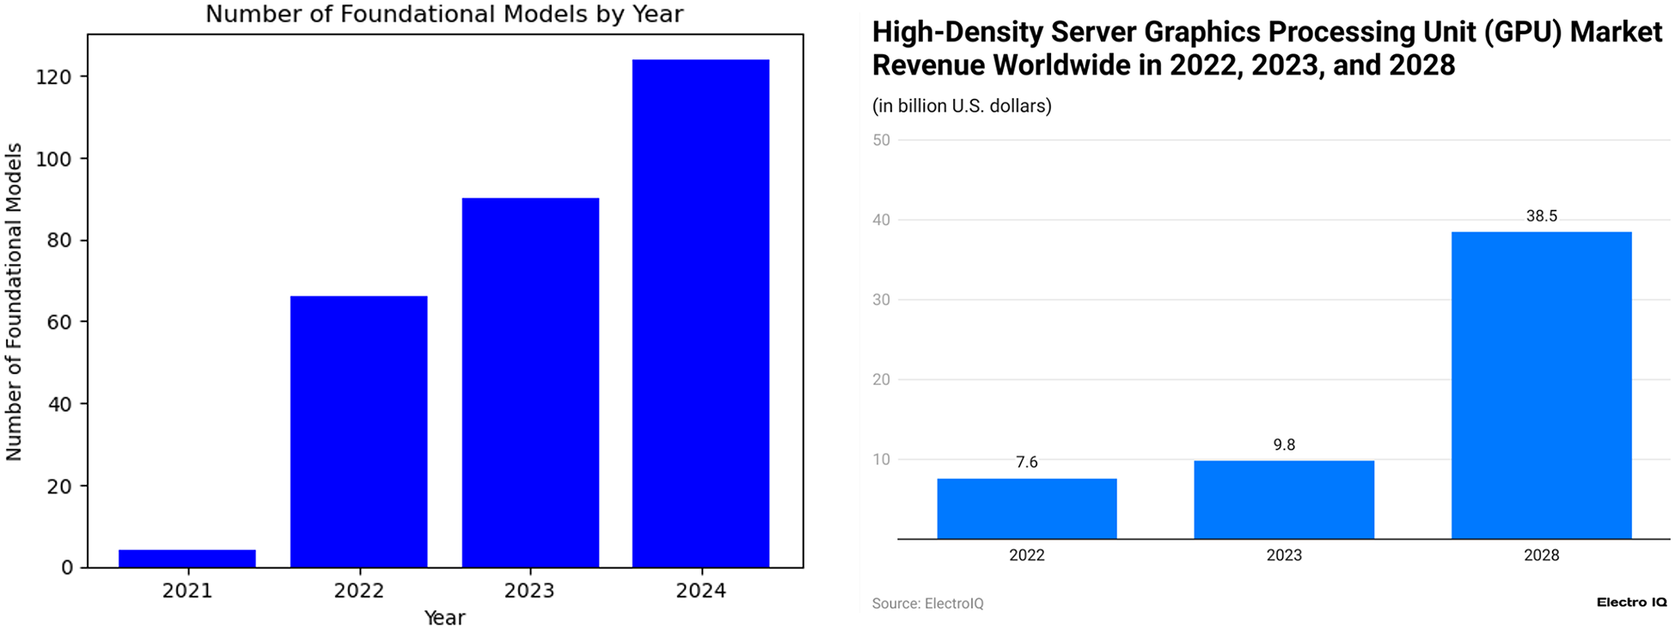
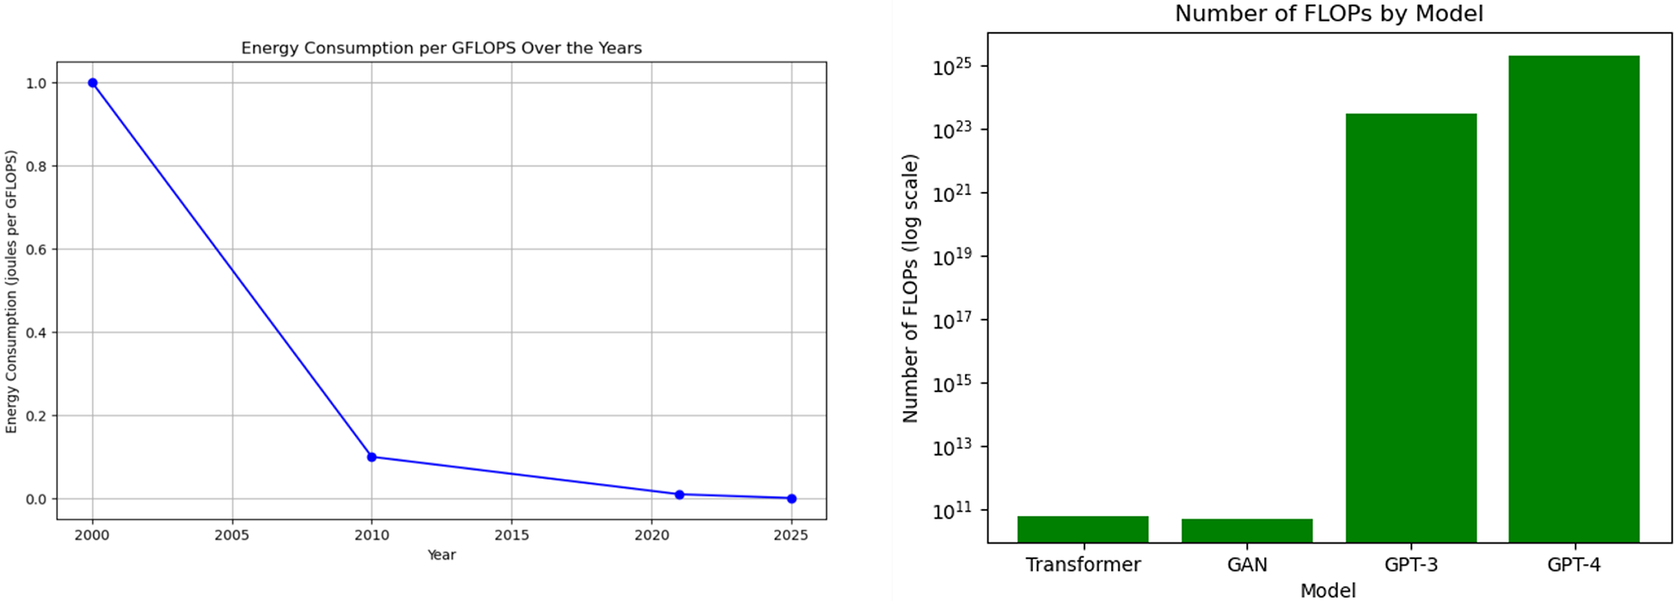


 Open access


Comments
No Comments have been published for this article.