Introduction
Solid oxide fuel cells (SOFC) are electrochemical devices that can efficiently convert fuels such as hydrogen and gaseous hydrocarbons into electricity [Reference Zhao, Xia, Jia, Wang, Li, Yu and Li1, Reference Kalra, Garg and Kumar2, Reference Ormerod, Singhal and Kendall3]. If operated in the electrolysis mode (SOEC), they can be used to produce hydrogen or syngas, which can be stored or converted into liquid fuels for transportation [Reference Nechache, Cassir and Ringuedé4, Reference Hauch, Ebbesen, Jensen and Mogensen5, Reference Ebbesen and Mogensen6, Reference Ruiz-Morales, Marrero-López, Canales-Vázquez and Irvine7]. To advance the commercialization of solid oxide cell (SOC) technology, production and material costs need to be further decreased and long-term stability/reliability demonstrated [Reference Tu and Stimming8].
Designing SOC stacks requires a careful selection of materials to provide the chemical and mechanical stability needed for several thousand hours of operation and to ensure robustness against thermal cycling. In this context, the sealings represent a critical issue, especially for planar SOC technology. Thermal mismatches between the sealing material and other stack components (e.g., interconnects and cells) can lead to delamination at the interfaces or formation of cracks inside the sealant, which may give rise to mixing of the fuel and the oxidant and, in worst case, lead to stack failure [Reference Boccaccini, Sevecek, Frandsen, Dlouhy, Molin, Charlas, Hjelm, Cannio and Hendriksen9, Reference Park, Yu, Bae, Kim and Ko10, Reference Klemensø, Boccaccini, Brodersen, Frandsen and Hendriksen11].
An ideal sealant for SOC stacks should adhere well to the joining components, remain chemically stable over time, provide high mechanical strength, have a low cost, provide electrical insulation, and have a coefficient of thermal expansion (CTE) that matches well with those of the other stack components [Reference Lessing12, Reference Chou, Thomsen, Williams, Choi, Canfield, Bonnett, Stevenson, Shyam and Lara-Curzio13, Reference Singh14]. Today, three main types of sealing materials are considered for SOC application: (i) compressive seals, typically based on mica, (ii) compliant seals, typically metal brazes and some glass-ceramics, and (iii) rigid seals, typically made of glasses or glass-ceramics [Reference Mahato, Banerjee, Gupta, Omar and Balani15, Reference Mahapatra and Lu16].
Compressive seals are deformable and thereby avoid the issue of stress build-up caused by thermal mismatches, but they contain cracks and pores and are therefore not as gastight as the other sealing types [Reference Simner and Stevenson17]. Compliant brazes are also deformable but consist generally of noble metals, which are typically more expensive than mica- and glasses-based sealants. Also, since metallic brazes are electrically conducting, additional insulating layers have to be introduced to avoid electrical short circuits between the electrodes [Reference Mahato, Banerjee, Gupta, Omar and Balani15]. Compliant glasses are known for being resistant against devitrification and having low glass transition temperature, which enable them to “self-heal” and release residual stresses [Reference Chou, Choi, Xu, Stephens, Koeppel, Stevenson and Lara-Curzio18].
Glass and glass-ceramic seals can be tuned in composition to reach the desired properties (e.g., CTE, melting point, degree of crystallization). The low viscosity, typically achieved during the sealing process, allows the seal to adapt to the surface of the joining components and thereby enables a hermetic seal [Reference Tulyaganov, Reddy, Kharton and Ferreira19, Reference Weil20]. For these reasons, glasses and glass-ceramics are the most popular sealing materials for SOC stacks, and many different compositions with relevant properties have been reported in the literature, among which alkaline-earth alumina silicate-based glasses are the most common [Reference Reddy, Tulyaganov, Kharton and Ferreira21, Reference Yang, Meinhardt and Stevenson22, Reference Smeacetto, Salvo, Ferraris, Cho and Boccaccini23, Reference Sabato, Cempura, Montinaro, Chrysanthou, Salvo, Bernardo, Secco and Smeacetto24, Reference Milhans, Khaleel, Sun, Tehrani, Al-Haik and Garmestani25, Reference Naylor, Jin, Shelby and Misture26, Reference Kiebach, Agersted, Zielke, Ritucci, Brock and Hendriksen27].
Despite many advantages, some critical challenges remain to be solved before glasses and glass-ceramic materials can be used as reliable sealants in SOC stacks. Some of the compositions have a low CTE compared to the structurally defining materials in the SOC stacks, which have CTE values in the range from 10.5 to 13.0 × 10⁻⁶ K−1 [Reference Mahapatra and Lu16]. In some cases, partial crystallization of the amorphous phase further decreases the CTE, with the consequence of crack formation due to the CTE mismatch [Reference Smeacetto, Salvo, Ferraris, Cho and Boccaccini23, Reference Sabato, Cempura, Montinaro, Chrysanthou, Salvo, Bernardo, Secco and Smeacetto24, Reference Misture, Naylor, Jin and Shelby28].
Addition of barium is a popular way of increasing the CTE as well as the sintering ability of the sealants [Reference Tulyaganov, Reddy, Kharton and Ferreira19]. However, the main disadvantage of Ba-containing systems is the high reactivity between the Ba in the sealant and Cr in the metallic interconnect. Reaction at the steel–glass interface may lead to the formation of chromates having a high CTE that eventually cause interface delamination [Reference Yang, Meinhardt and Stevenson22, Reference Chou, Stevenson, Xia and Yang29]. These reactions may be diminished by coating the interconnects, as explained later. However, undesired interactions that lead to weakening of the interface can also be a challenge between the barium-containing glass-ceramics and the YSZ electrolyte [Reference Yang, Meinhardt and Stevenson22, Reference Naylor, Jin, Shelby and Misture26, Reference Kiebach, Agersted, Zielke, Ritucci, Brock and Hendriksen27].
Addition of boron oxide (B2O3) is a common way to decrease the viscosity and crystallization rate of the glass. On the other hand, borates are very volatile and form compounds that can lead to degradation of the sealing area. The problem can be solved by only adding a small amount of B2O3 [Reference Mahato, Banerjee, Gupta, Omar and Balani15, Reference Mahapatra and Lu16, Reference Tulyaganov, Reddy, Kharton and Ferreira19, Reference Mouhib, Ouaomar, Lahlou and El Ghorba30, Reference Lahl, Singheiser and Hilpert31].
From these perspectives, a promising new sealant was recently developed and used in this work: the V11 glass-ceramic [Reference Ritucci, Agersted, Zielke, Wulff, Khajavi, Smeacetto, Sabato and Kiebach32]. The V11 glass-ceramic fulfills several of the requirements listed above. Its CTE (12.8 × 10⁻⁶ K−1) matches the CTEs of the other stack components such as YSZ 10.8 × 10⁻⁶ K−1 [Reference Mahato, Banerjee, Gupta, Omar and Balani15], Ni/YSZ 12.6 × 10⁻⁶ K−1 [Reference Sun, Rudkin and Atkinson33], and Crofer 22 APU 12.3 × 10⁻⁶ K−1 [34]. The V11 glass-ceramic adheres well to the joining components, results in a gastight sealing (leak rate of 1.2 × 10⁵ sccm/cm), and shows excellent long-term chemical stability [Reference Ritucci, Agersted, Zielke, Wulff, Khajavi, Smeacetto, Sabato and Kiebach32].
In the SOC stack, the glass will typically be in contact with steel components such as the interconnect. Surface modifications and coatings are applied to the interconnect steel to reduce corrosion rates, lower the resistance for current collection, and reduce Cr evaporation [Reference Talic, Falk-Windisch, Venkatachalam, Hendriksen, Wiik and Lein35, Reference Talic, Molin, Wiik, Hendriksen and Lein36, Reference Molin, Jasinski, Mikkelsen, Zhang, Chen and Hendriksen37, Reference Palcut, Mikkelsen, Neufeld, Chen, Knibbe and Hendriksen38]. The latter phenomenon will cause poisoning of the oxygen electrode and lead to local formation of chromates [Reference Bentzen, Høgh, Barfod and Hagen39, Reference Hilpert40, Reference Taniguchi, Kadowaki, Kawamura, Yasuo, Akiyama, Miyake and Saitoh41]. Chromate formation directly affects the mechanical performance of the sealing area, since these compounds are brittle and have high CTE values (∼18–20 × 10−6 K−1 Ref. Reference Zhang, Brow, Fahrenholtz and Reis42), which could lead to delamination [Reference Lin, Liu, Wu, Liu and Lee43, Reference Mahapatra and Lu44].
In this paper, the mechanical adherence of joints comprising the glass-ceramic sealant (V11) and Crofer 22 APU interconnects with three different coatings/surface treatments is investigated. The coating and surface treatments were chosen to represent interfaces that the sealing typically needs to adhere well to. They are: (i) preoxidized Crofer 22 APU; (ii) AlumiLok (Al2O3 coating, Nexceris, Fuelcellmaterials)-coated Crofer 22 APU; and (iii) MnCo2O4 (MCO)-coated Crofer 22 APU steel. (MCO coatings are commonly used to increase oxidation resistance and suppress Cr evaporation from interconnects.) [Reference Talic, Falk-Windisch, Venkatachalam, Hendriksen, Wiik and Lein35, Reference Trebbels, Markus and Singheiser45, Reference Kurokawa, Jacobson, DeJonghe and Visco46].
Here, we evaluate the adherence by measuring the so-called critical energy release rate, also known as the fracture energy. The critical energy release rate describes the amount of energy needed to generate additional surface area at the propagation of a crack and relates to the fracture toughness (described below). The critical energy release rate is an intrinsic property of the material, which is not related to the geometry or surface treatment of the sample. This is in contrast to the strength of brittle materials, which depends on flaws stemming from sample production [Reference Frandsen, Ramos, Faes, Pihlatie and Brodersen47] or flaws/surface variations in the actual SOC stack. Some researchers polish the edges of the samples for strength testing, which reduces the variation from sample to sample, as described in Ref. Reference Malzbender and Zhao48. Nevertheless, such measurements will not be representative of the strength variations in a typical stack, as making a sample that replicates the geometry and flaws of the SOC stack is very difficult. Another disadvantage of strength measurements is that a large set of samples (>30) is needed for a good description of the statistical variation (typically, Weibull variation) [Reference Khalili and Kromp49].
The steady-state critical energy release rate can be used as a criterion for failure. However, this parameter describes only the propagation of an already initiated crack, and not the critical energy for initiation of the crack. The energy release rate needed to initiate a crack is higher than the energy needed for steady-state propagation, as the initiated crack is sharp and the stress concentrations at the crack tip are correspondingly higher. Thus, using the steady-state critical energy release rate as a criterion for failure represents a conservative approach.
To measure the critical energy release rate, we here adopted a method in line with the one suggested by Charalambides and later modified by Hofinger for characterizing the glass–metal toughness. Charalambides proposed at first a simple design of a bilayered specimen to determine the energy release rate of a thin layer in a metal–ceramic interface using a four-point bending configuration [Reference Charalambides, Lund, Evans and McMeeking50]. This sample design was modified by Hofinger by adding a third stiffening layer on top of the thin layer, making it a trilayer [Reference Hofinger, Oechsner, Bahr and Swain51]. The addition of the third layer helps to prevent vertical cracking and segmentation of the thin ceramic layer, which results in an increase in the probability of delamination. Malzbender et al. [Reference Malzbender, Steinbrech and Singheiser52] used the same geometry and a similar method to that of Hofinger for calculating the critical energy release rate, but neglected the strain energy contribution from the thin sealant layer. For thin sealant layers, this is a good approximation, but for thicker sealing layers, the strain energy contributes significantly to the total energy release (as compared to the substrate and stiffener layers). The analysis was further refined by Malzbender to describe a multilayer breaking apart [Reference Malzbender, Steinbrech and Singheiser52]. As the samples in this study involve only a trilayer, we use the simpler formulation by Hofinger [Reference Hofinger, Oechsner, Bahr and Swain51].
To identify the crack path, scanning electron microscopy (SEM) and energy-dispersive X-ray spectroscopy (EDS) were conducted on the broken pieces of the samples to identify the failing interface or material in the multilayer samples. Based on the results, we identify and predict weak interfaces in the sealing area of SOC stacks. Furthermore, measures for increasing the interfacial energy release rate in this area are suggested.
Experimental
Sealing glass: preparation and properties
The chemical composition of the V11 glass used in this study is (in wt%) as follows: 46.4% SiO2, 13% MgO, 14.3% CaO, 9.3% Na2O, 8.3% Al2O3, 2.9% ZrO2, and 5.8% B2O3. The glass-ceramic sealant was produced by mixing and melting the precursors at 1350 °C, followed by quenching in water. The obtained glass was ball-milled to powder and transferred to a paste for screen printing. Further details on the glass powder fabrication can be found in our previous work, where thorough characterization is also reported [Reference Ritucci, Agersted, Zielke, Wulff, Khajavi, Smeacetto, Sabato and Kiebach32].
To summarize, the glass transition temperature (T g) is 635 °C, and the glass devitrifies and forms a glass-ceramic material when heat-treated above 800 °C [Reference Ritucci, Agersted, Zielke, Wulff, Khajavi, Smeacetto, Sabato and Kiebach32]. The glass-ceramic material is a composite material with an amorphous phase (64.3 wt%) and two crystalline phases: augite (28.5 wt%) and nepheline (7.2 wt%). The CTE of the glass-ceramic (after sintering at 800 °C) is 12.8 × 10⁻⁶ K−1 measured between 200 and 450 °C.
Metallic substrates and coatings: preparation and properties
Crofer 22 APU (ThyssenKrupp, Essen, Germany [34]), a high-temperature ferritic stainless steel designed for the application as SOC interconnects, was selected as the substrate material, as it is relatively widely used steel for SOC.
Here, we investigate how some commonly applied coatings/surface modifications [preoxidation, AlumiLok (Nexceris, Fuelcellmaterials), MCO coating] influence the adhesion between the interconnect and the seal.
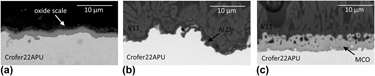
Preoxidation of the Crofer 22 APU was done by heat treatment in air at 900 °C for 50 h. The partial pressure of water vapor was not controlled during this preoxidation, but it is assumed to be in the range of 1–5% based on the typical humidity level and temperature of the laboratory. This preoxidation resulted in the formation of a dense 1.5- to 2-μm-thick oxide scale as shown in Fig. 1(a). This oxide scale is a combination of an inner layer consisting of Cr2O3 and an outer layer of columnar (Mn, Cr)3O4 spinel. This outer layer slightly reduces chromium evaporation from the steel compared to a surface of pure Cr2O3 [Reference Chou, Stevenson, Xia and Yang29, Reference Zhang, Brow, Fahrenholtz and Reis42, Reference Chou, Stevenson and Singh53, Reference Chou, Stevenson and Singh54, Reference Mahapatra and Lu55].
The micrographs show 3 cross-sections with the oxidations and coatings: (a) preoxidation, (b) AlumiLok, and (c) MCO coating.

AlumiLok™ is a commercial alumina coating (Al2O3) with a thickness of ∼0.7 μm supplied by Nexceris (Lewis Center, Ohio) [Fig. 1(b)]. Details about the coating process can be found in Refs. Reference Choi, Chou and Stevenson56 and Reference Kidner57.
The MCO coating was prepared by electrophoretic deposition. For this purpose, MnCo2O4 powder (Fuelcellmaterials) was mixed with isopropanol and ethanol (50:50 vol%) and iodine (0.5 g/L) to make a suspension. Deposition was carried out at 60 V for 1 min with 1 cm distance between the Crofer 22 APU substrate and the counter electrodes (stainless steel). The deposited coating was sintered in two steps: first in H2–N2 at 1000 °C for 2 h and then in air at 800 °C for 5 h. The final thickness of the coating is around 10 μm [Fig. 1(c)]. More details of the coating process are described in the literature [Reference Talic, Falk-Windisch, Venkatachalam, Hendriksen, Wiik and Lein35, Reference Talic, Molin, Wiik, Hendriksen and Lein36, Reference Bobruk, Molin, Chen, Brylewski and Hendriksen58].
Sample preparation and assembly
For the best possible replication of the actual geometry and possible manufacturing- and size-dependent effects, the sample design (materials and geometry) and processing were made to be comparable with the stack design and fabrication process at DTU Energy.
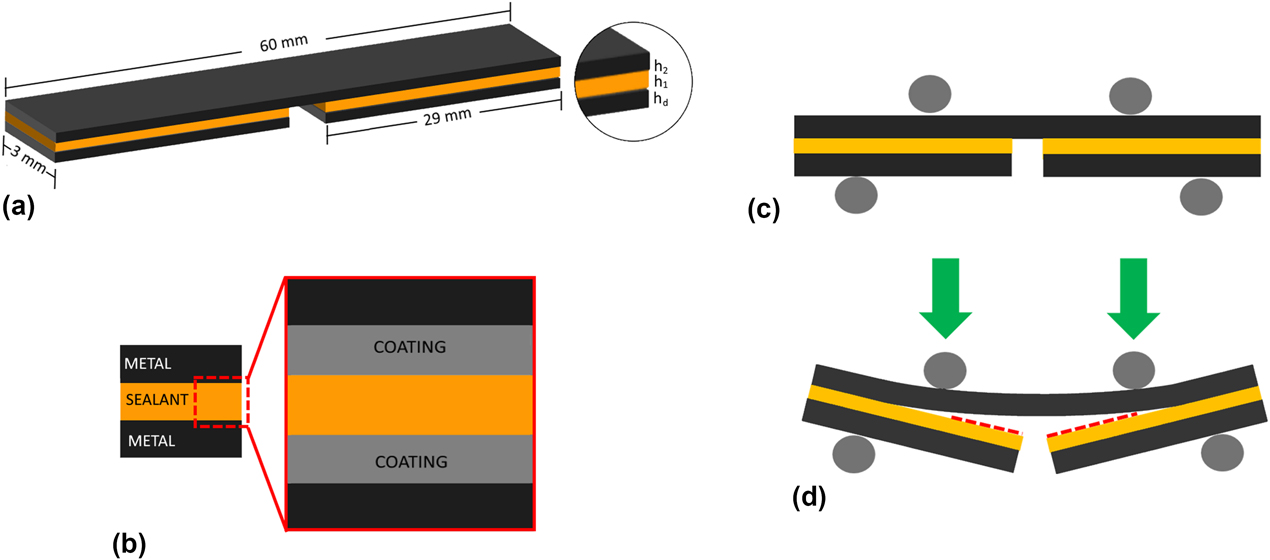
The samples fabricated for fracture energy measurement had a three-layered structure as shown in Figs. 2(a) and 2(b). This consists of two metallic layers (in black, Fig. 2, made of ∼300-μm-thick Crofer 22 APU) and one layer of sealant sandwiched in between (in yellow, Fig. 2, ∼50 μm thick). The first metallic layer, from the bottom, consists of two short “bars”/“strips” of Crofer 22 APU with dimensions of 3 × 29 × 0.3 mm3, and the second metallic layer, on the top, is one long slip (bar) of 3 × 60 × 0.3 mm3. All the components were cut from a larger sheet by laser cutting.
(a) 3D sketch of the full sample geometry, (b) layers in each sample, (c) four-point bending loading configuration, and (d) failure mechanism during loading.

After cutting, the metallic strips were polished with SiC paper (grid size #500) to obtain smooth edges and then cleaned in acetone and ethanol for 10 min each in an ultrasonic bath. The polishing and cleaning procedure will remove the debris from the edges but not the flaws introduced by the laser cutting. However, these flaws are placed along the perimeter of the sample and only constitute a very small fraction of the fracture zone, where a sharp crack is running over the full width of the sample.
The V11 glass paste was applied by screen printing on the shorter metallic bars (29 mm). This ensures an ∼2-mm opening notch in the middle of the sample, where the crack will initiate during the test. With this procedure, it is possible to avoid extra machining for making a notch through the metallic and the ceramic layer, with the risk of damaging the samples. Having glass in the notch can make it hard to initiate the crack without deforming the metal substrates plastically and should therefore be avoided.
The sandwiched samples were heat-treated (“sealed”) under a load of 16.7 N/cm2 applied by a hydraulic piston, with the sample placed between two alumina plates. The following heating profile was used: ramping from 20 to 600 °C at 100 °C/h, holding for 1 h, ramping from 600 to 700 °C at 100 °C/h, ramping from 700 to 800 °C at 50 °C/h, holding for 1 h, and then cooling down to room temperature. This heating profile was optimized according to the V11 glass-ceramic properties, obtained from thermal characterization, as described in Ref. Reference Ritucci, Agersted, Zielke, Wulff, Khajavi, Smeacetto, Sabato and Kiebach32. In this study, it was found that doubling the load level did not change the microstructure of the glass significantly, and the glass is thus relatively insensitive to load variations occurring over the stack height during sealing.
To ensure reproducibility and a representative value of the fracture energy, four samples of each type were tested.
Test method
Joint samples, as described in section “Sample preparation and assembly”., were tested at room temperature with a four-point bending fixture built in-house at DTU Energy [Reference Frandsen, Hendriksen and Johansen59, Reference Frandsen, Curran, Rasmussen and Hendriksen60]. The setup is similar to a four-point bending test, with the sample placed between four loading pins [see Fig. 2(c)], two inner and two outer. The two inner pins can be moved up and down by an actuator, while the force of the two outer pins is recorded by force sensors [Reference Frandsen, Hendriksen and Johansen59, Reference Frandsen, Curran, Rasmussen and Hendriksen60]. The distance is 25 and 50 mm between the inner and outer pins, respectively.
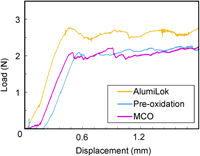
Before crack formation, the load increases linearly with displacement (constant stiffness). At crack initiation, there is a small drop in the load–displacement curve, as the resistance to crack propagation from a blunt (uninitiated crack) is higher than from a sharp (initiated crack). After crack formation, the two cracks propagate in a symmetrical manner (due to balancing of the two loads on the sample using a fulcrum [Reference Frandsen, Curran, Rasmussen and Hendriksen60]). When the crack length becomes larger than the thickness of the specimen, the energy release rate reaches a steady-state value [Reference Evans, Drory and Hu61].
During the steady-state stage, the displacement increases and the stiffness decreases, resulting in a constant loading plateau, P. In reality, the load varies slightly up and down according to variations at the interface and dynamics of the crack propagation, including friction between sample and supports, etc., as shown in Fig. 3.
Three typical examples of recorded load–displacement curves.

The plateau of the load is determined as an average of the recorded data after the initial crack initiation peak. The crack propagation occurs practically symmetrically to both sides of the initial notch and proceeds until it reaches the inner loading pins. The sample never reaches a complete failure, as the substrate (and stiffener) material here is made of Crofer 22 APU, which will deform plastically before failure. Here, we avoid plastic deformations, since the analyses presume that the stresses are in the elastic regime.
By ensuring crack propagation in the middle layer of a symmetric sandwich and having the glass adhering to a considerably stiffer substrate after failure, the release of residual stresses is negligible. This is further discussed in the discussion section.
Microstructural characterization
SEM and EDS (TM3000 Hitachi, Merlin ZEISS, Carl Zeiss AG, Oberkochen, Germany) were used to investigate the chemical compositions and the microstructures of the fracture surfaces.
Analysis
The load at the plateau, P, provides a constant bending moment, M b, between the inner pins in the four-point bending:
 $${M_{\rm{b}}} = {{Pl} \over {2b}}\quad ,$$
where P is the total applied force (on both inner pins), l is the distance between the outer and inner pins, and b is the sample width. In this specific setup, l is 12.5 mm and b is 3.0 mm (as shown in Fig. 2).
The critical energy release rate, G c, can then be estimated using the analysis made by Hofinger [Reference Hofinger, Oechsner, Bahr and Swain51]:
 $${G_{\rm{c}}} = {{M_{\rm{b}}^2\left( {1 - \nu _2^2} \right)} \over {2{E_2}}}\left( {{1 \over {{I_2}}} - {1 \over {{I_{\rm{c}}}}}} \right)\quad ,$$
where E 2, ν2, and I 2, are the Young’s modulus, Poisson’s ratio, and second moment of area of the through-going substrate of Crofer 22 APU [see Fig. 2(a)], respectively. I c is the combined second moment of area of the stiffeners [d in Fig. 2(a)] and the glass-ceramic. The indexes 2 and d here refer to the glass-ceramic layer (sealant) and the substrate (long metal slip), respectively.
The second moments of areas are calculated as:
 $${I_2} = {{h_2^3} \over {12}}\quad ,$$
where h 2 is the thickness of the substrate and I c is given by:
 $$\eqalign{{I_{\rm{c}}} = {{h_2^3} \over 3} + \kappa {{h_1^3} \over 3} + \mu \left( {{{h_{\rm{d}}^3} \over 3} + h_{\rm{d}}^3{h_1} + h_1^2{h_{\rm{d}}}} \right) \cr- {{{{\left[ {h_2^2 - \kappa h_1^2 - \mu \left( {h_{\rm{d}}^2 + 2{h_1}{h_{\rm{d}}}} \right)} \right]}^2}} \over {4\left( {{h_2} + \kappa {h_1} + \mu {h_{\rm{d}}}} \right)}}\quad ,$$
where the index 1 refers to the stiffener (the short metal strips). κ is the ratio between the stiffness of the substrate and the stiffener (which are identical here):
 $$\kappa = {{{E_1}\left( {1 - \nu _2^2} \right)} \over {{E_2}\left( {1 - \nu _1^2} \right)}}\quad ,$$
and µ is the ratio between the stiffness of the substrate and the glass-ceramic layer
 $$\mu = {{{E_{\rm{d}}}\left( {1 - \nu _2^2} \right)} \over {{E_2}\left( {1 - \nu _{\rm{d}}^2} \right)}}\quad .$$
Poisson’s ratios are specified as ν and they are assumed to be ν1 = 0.3, ν2 = 0.2. Values for the Poisson’s ratios of the glass c are scarce in the literature, but the results are practically insensitive to these values.
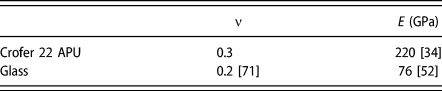
E is the Young’s modulus. Values used for the calculations were: E 2 = E d = 220 GPa [34] and E 1 = 76 GPa [Reference Malzbender, Steinbrech and Singheiser52]. The latter value is taken from the literature as a representative number for the stiffness of the glass-ceramic. The results are practically insensitive to variations in the Young’s modulus of the glass-ceramic with the chosen geometry, and, e.g., assuming that E d has doubled the energy release rate changes by 0.0007%.
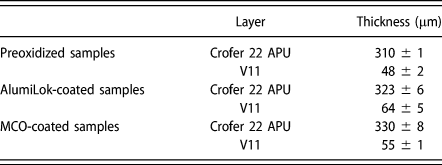
h represents the different layer thicknesses. To obtain the exact thickness of each layer, one sample of each type was cast in epoxy, polished, and inspected in a scanning electron microscope (see section “Micro-structural characterization”). The thicknesses were measured at 10 locations for each layer, and results are summarized in Table I.
Thickness values (mean ± standard deviation) of the Crofer 22 APU and the glass per each combination.

The critical energy release rate relates to the mode I fracture toughness, K Ic, in plane strain stress, as follows:
 $${K_{{\rm{Ic}}}} = \sqrt {{{G \cdot {E_{\rm{f}}}} / {}}\left( {1 - {\nu _{\rm{f}}}} \right)} \quad ,$$
where E f and v f are the elastic constants related to the failing material. If the failure occurs in the interface, then the approach by Hutchinson and Suo [Reference Hutchinson62] can be used:
 $${K_{{\rm{Ic}}}} = \sqrt {G \cdot {E^*}} \quad ,$$
where E* is defined as [Reference Hutchinson62]
 $${1 \over {{E^*}}} = {1 \over 2}\left( {{{1 - {v_{{\rm{f1}}}}} \over {{E_{{\rm{f}}1}}}} + {{1 - {v_{{\rm{f}}2}}} \over {{E_{{\rm{f}}2}}}}} \right)\quad ,$$
where E f1, v f1, E f2, and v f2 are the elastic constants related to the two materials along the failing interface.
The curvature of the substrate was measured after testing to verify that the substrate was thick enough to keep the stresses within the elastic regime to avoid plastic deformation during the experiments.
Results
The critical energy release rates (G c), here also referred to as fracture energy, for the different samples are reported in section “The fracture energy (G c)”. Complementary analysis of the fractured interfaces is reported in section “Fractography and microstructural analysis”. Considering the complexity of the investigated samples (five layers and four interfaces [Fig. 2(b)]), all results are discussed in context in section “Discussion”.
The fracture energy (G c)
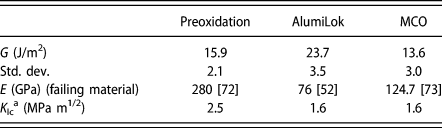
Examples of the load–displacement curves measured for the different samples are shown Fig. 3. The plateaus in these curves were estimated by taking the average of the recorded loads, and G c was calculated as described in section “Test method”. Four specimens were tested for each combination to ensure reproducibility and to exclude possible errors due to sample preparation. An overview of the measured fracture energies is presented in Table II.
Measured fracture energies and estimated fracture toughness for the three different interfaces with glass-ceramic and Crofer 22 APU with different coating/surface treatment solutions.

a Estimated based on Eq. (7) and literature values for E.
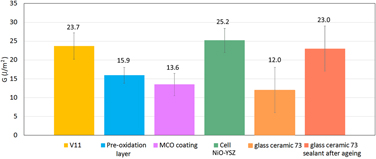
The fracture energy of the preoxidized Crofer 22 APU (15.9 J/m2) was comparable to the MCO-coated samples (13.6 J/m2). The highest G value (23.7 J/m2) was measured for the AlumiLok-coated sample, which is 74% higher than the preoxidized or MCO-coated samples.
Fractography and microstructural analysis
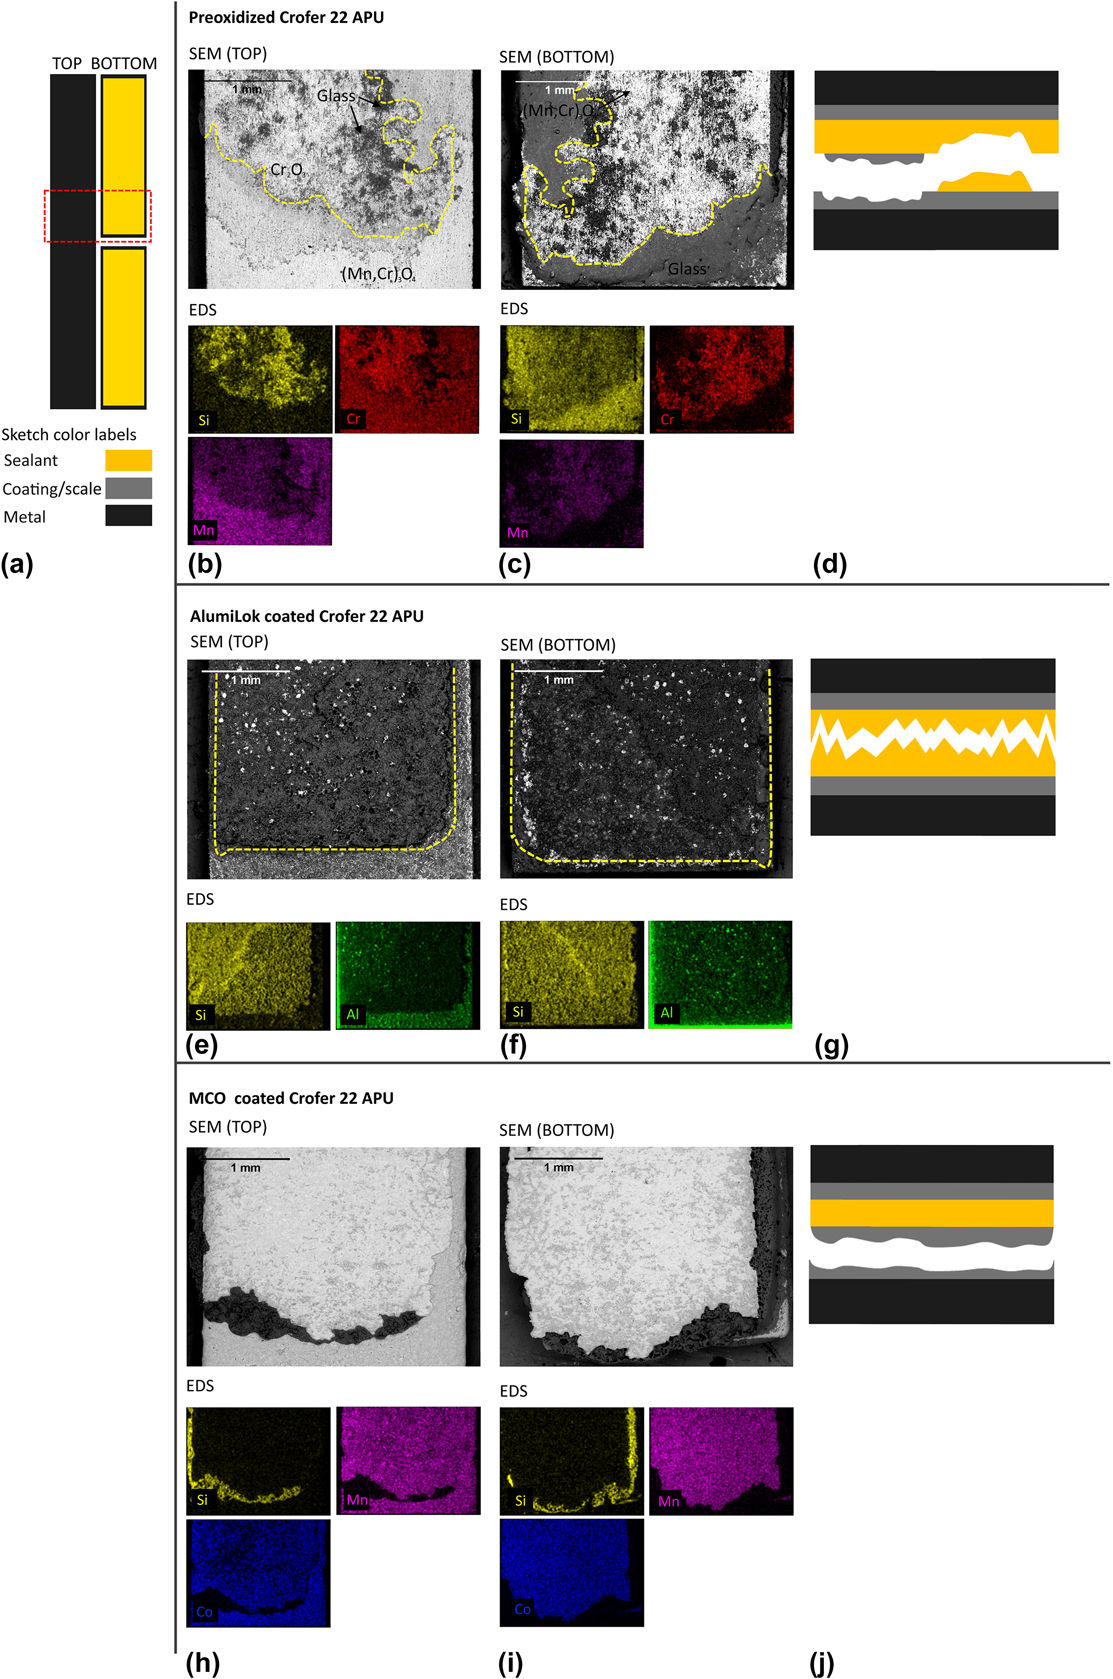
After mechanical testing, samples were manually taken apart to analyze the fractured surface, as shown in Fig. 4. The two fracture areas on either side of the tested sample (on the short and on the long bar), delimited by the red dashed lines in Fig. 4(a), were analyzed by SEM/EDS. Two samples of each type were analyzed to confirm that the results were consistent. Representative data from one of the samples is shown below in Fig. 4.
Overview of the SEM/EDS analysis of (a) sample sketch with highlighted analyzed area. V11 on preoxidized Crofer 22 APU (b) top bar SEM and EDS and (c) bottom bar SEM and EDS, and (d) sketch of the fracture mechanism. V11 on AlumiLok-coated Crofer 22 APU (e) top bar SEM and EDS and (f) bottom bar SEM and EDS (g) sketch of the fracture mechanism. V11 on MCO-coated Crofer 22 APU (h) top bar SEM and EDS and (i) bottom bar (l) sketch of the fracture mechanism.

The elements shown in the EDS maps in Fig. 4 (EDS) are mainly present in one specific layer. This makes it is possible to identify the interfaces or layers in which the crack propagation occurred. Si (yellow) represents the V11 glass-ceramic, a combined presence of Mn (purple) and Cr (red) the oxide scale of the (preoxidized) Crofer 22 APU, Al (green) the AlumiLok coating, and Co (blue) the MCO coating.
Figure 4(b) shows the fracture surface of the preoxidized Crofer 22 APU sample. On the surface of the long bar, mainly Cr and Si are found. Similar results were found on the short bar, as shown in Fig. 4(c). The two distinct areas are separated by the yellow dotted line in the SEM images [Figs. 4(a) and 4(b)].
Two observations regarding the chemical characteristic of the fracture surfaces can be made: First, areas that are rich in Si have lower/no concentration of Cr and Mn and vice versa. Second, areas with a high Cr content on the long bar typically have a low Cr concentration on the short bar. The same trend can be found for Si, although this is not as pronounced. Based on these results, it can be concluded that crack formation and propagation mainly occurred within the thermally grown oxide scale and, to a much lower extent, within the glass-ceramic, as illustrated in Fig. 4(d). Comparing EDS maps of Cr and Mn in the stippled area of Figs. 4(b) and 4(c), it can be seen that Cr is present on both sides of the sample, while Mn is only present on one side (“bottom”). This indicates that the fracture within the thermally grown oxide scale took place at the interface between the Cr2O3 and (Mn,Cr)3O4 layers of the scale.
Figures 4(e) and 4(f) show the fracture area of the AlumiLok-coated Crofer 22 APU sample. On both surfaces [long bar Fig. 4(e), short bar Fig. 4(f)], mainly Si and few spots that are Al rich were found. The yellow dashed line in Figs. 4(e) and 4(f) corresponds to the area in which the V11 glass was screen-printed.
As expected, the remaining area at the edge of sample corresponds to AlumiLok-coated Crofer 22 APU. Some iron-containing agglomerations are observed inside the yellow-line area, and those are visible on both sides. This may indicate that the crack propagates through the rough steel and coating surface. Overall, these results indicate that the fracture occurred in the middle of the glass-ceramic, as depicted in the sketch in Fig. 4(g).
The SEM/EDS images of the fracture area of the MCO-coated Crofer 22 APU sample are shown in Figs. 4(h) and 4(i). The center of the fracture area of the short bar [Fig. 4(i)] is rich in Mn and Co. A stripe of Si is found around this area, representing the glass layer underneath. Similar observations were made on the surface of the long bar [Fig. 4(h)]. In this case, the fracture occurred inside the MCO coating, part of the MCO remained attached on the glass-ceramic (short bar), while the other part remained attached on the steel (long bar).
Discussion
In this study, three different scenarios/assemblies of the SOC sealing areas were investigated. For all scenarios, the weakest interfaces were identified, and mechanisms of crack propagation postulated. Crack formation occurred in different layers or along interfaces in the investigated assemblies, underlining the importance of a complementary fractography analysis to supplement the mechanical measurements.
The weakest interface with the lowest energy release rate was found for the MCO-coated samples (13.6 ± 3.0 J/m2). From the EDS analysis [Figs. 4(h) and 4(i)], it can be concluded that the crack propagation for this type of sample occurs within the MCO layer, as Mn and Co are equally present in the sample pieces on either side of the crack. Accordingly, the critical energy release rate measured for this interface is characteristic of the MCO coating (and not for the glass-ceramic V11 sealant). This value is in reasonable agreement with the measurement by Akanda et al., who estimated a fracture energy of 10 J/m2 by bending and detecting spallation of the coating [Reference Akanda, Walter, Kidner and Seabaugh63]. As shown in Fig. 1(c), the glass partially penetrates the pores of the coating and probably enhances the energy release rate of the MCO.
The preoxidized samples showed a comparable, but slightly higher, critical energy release rate (15.9 ± 2.1 J/m2) than the MCO-coated sample. The elemental analysis of the interface [Figs. 4(b) and 4(c)] indicated that the fracture occurred between the Cr2O3 and the (Mn,Cr)3O4 layers of the oxide scale, thermally grown during preoxidation. Previous microstructural investigation of the oxide scale on Crofer 22 APU thermally grown in air at 900 °C has shown void formation between these two layers; thus, it seems plausible that this interface is the weakest region of the sample [Reference Talic, Molin, Wiik, Hendriksen and Lein36, Reference Huczkowski, Christiansen, Shemet, Piron-Abellan, Singheiser and Quadakkers64]. In conclusion, the critical energy release rate measured for this sample relates to the interface strength between the Cr2O3 and the (Mn,Cr)3O4 layers of the thermally grown oxide scale.
The preoxidation process of 50 h at 900 °C used for the sample preparation results in a relatively thick oxide scale of ∼1.5–2 μm. This is equivalent to the oxide scale thickness measured after 1000 h of aging at 800 °C [Reference Talic, Molin, Hendriksen and Lein65]. The oxide scale will grow below either of the coatings (MCO and AlumiLok) used in the study, and the oxide scale may end up being the weakest interface independent of the type of coating applied. However, it is expected that the corrosion rate in the sealing area (below the sealing) is well below that in the active area, as the sealing also prevents oxygen from diffusing to the steel surface. According to the literature, the composition of the oxide scale does not change even after 23,000 h of aging at 800 °C [Reference Fontana, Chevalier and Caboche66]. On the other hand, interactions between the oxide scale and V11 during aging might cause changes in the fracture toughness. This is ongoing research.
With increasing oxide scale thickness, the residual stresses in the oxide scale also increase. However, these residual stresses are concentrated in very thin layers having negligible stiffness compared to the remaining SOC stack. The residual stresses are thus not released during crack propagation (the coating does not change shape—it is “frozen” onto the substrate). Consequentially, increasing the oxide scale should not influence the integrity.
For the same reason, the residual stresses in the glass-ceramic layer do not influence the measurement significantly. The sandwich samples are symmetric with thick steel substrates as the stiffest layers. They contract equally, such that the only residual stresses being built up relate to the difference in thermal contractions between the steel and glass. Some of this residual stress is released as the crack grows (and the glass is primarily attached to one of the steel substrates). The most energy released is for the case where all the glass adheres to one of the metal substrates. In this case, ∼50 μm of glass with a far lower stiffness (∼76 GPa, see Table III) adheres to an ∼300-μm steel substrate (∼220 GPa, see Table III), with a stiffness ratio of ∼1:18. Thus, the glass does almost not change shape during the failure, as it is “frozen” onto the substrate. Using the classical laminate theory [Reference Sørensen, Sarraute, Jørgensen and Horsewell67], this residual stress release can be estimated to be ∼0.06 J/m2, which is well below the uncertainty of the experiments and the magnitude of the critical energy release rates of 13–24 J/m2.
Poisson’s ratio and Young’s modulus of the Crofer 22 APU and glass.

The highest energy release rate value (23.7 ± 3.5 J/m2) was found for samples with the AlumiLok coating. From the EDS analysis [Figs. 4(e) and 4(f)], it is clearly observed that the fracture in this case starts and develops inside the glass-ceramic layer. Taking into account that fracture occurs only in the glass-ceramic, the critical energy release rate measured for this interface reflects the mechanical properties of the V11 glass-ceramic.
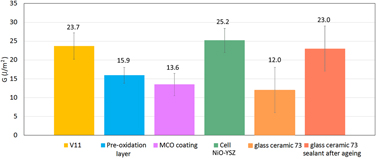
Based on these results, three points should be highlighted: First, it is important to accurately identify in which layer crack propagation occurs, to correctly correlate the measured values with the right material/interface. Second, the strong interface adhesion achieved with the Alumilok allows for a quantification of the fracture properties of the V11 glass-ceramic. Third, the strong adherence of the V11 glass-ceramic to coatings and thermally grown oxide scales along with its high inherent toughness opens up the possibility to accurately characterize the adherence of other, weaker interfaces as here exemplified for preoxidized and MCO-coated Crofer 22 APU (Fig. 5).
Fracture energy results of SOC stack components: V11, preoxidation, MCO coating, NiO/3YSZ [Reference Goutianos, Frandsen and Sørensen68], glass-ceramic 73 after sintering and after aging [Reference Malzbender, Steinbrech and Singheiser52].

The interface strength between the glass-ceramic/MCO coating and glass-ceramic/oxide scale is higher than one between the Crofer 22 APU/MCO coating/oxide scale, which were identified as the weakest interface in the sealing area. Consequently, to improve the overall strength in the sealing area, the stability of these interfaces must be improved (rather than the glass-ceramic itself). Our results show that this can be achieved by using the AlumiLok coating. The thin Al2O3 layer (with high roughness) adheres very well to the Crofer 22 APU and drastically improves the interface fracture energy. The presence of a MCO coating in the sealing area, on the other hand, reduces the maximum achievable toughness in the sealing zone.
The critical energy release rate obtained for the V11 glass-ceramic (23.7 ± 3.5 J/m2) is comparable to values reported in the literature by Malzbender et al. [Reference Malzbender, Steinbrech and Singheiser52]. In their work, an alumina silicate glass-ceramic sealant (glass 73) was tested with a comparable method, and an energy release rate of 12 ± 6 J/m2 and 23 ± 6 J/m2 before and after aging was found, respectively [Reference Malzbender, Steinbrech and Singheiser52]. In this context, it is noticeable that the V11 glass glass-ceramic develops a high fracture energy already directly after the sealing process (no need for aging). Nevertheless, the energy release rate of aged V11 sampled needs to be investigated in the near future for a fair comparison.
The values here obtained for the V11 glass-ceramic (23.7 ± 3.5 J/m2) are comparable to the energy release rate of NiO/3YSZ-based cells (25.2 ± 3.2 J/m2) [Reference Goutianos, Frandsen and Sørensen68]. The fracture energy thus balances well other brittle components of the stack, and there is no further need for optimizing the fracture energy of the glass-ceramic.
In literature, most studies on glass-ceramics are carried out with different materials at the interfaces. For example, Kuhn et al. [Reference Kuhn, Wetzel, Malzbender, Steinbrech and Singheiser69] and Malzbender at al. [Reference Malzbender, Steinbrech and Singheiser70] showed that sealants on steel with an interlayer of YSZ resulted in a fracture energy of 56 ± 3 J/m2 after 500 days of aging at 800 °C. This interface is thus not the weakest one in a stack, and it shows that glass-ceramics are capable of becoming rather robust.
Conclusions
To understand the failure mechanisms occurring in the sealing area of SOC stacks, the critical energy release rate of several relevant interfaces was measured by four-point bending of notched sandwiched samples with the glass-ceramic adhering two layers of surface-treated Crofer 22 APU.
A recently developed glass-ceramic sealant (SiO2–MgO–CaO–Na2O–Al2O3–ZrO2–B2O3) was joined to (i) preoxidized Crofer 22APU, (ii) Crofer 22 APU with an AlumiLok coating, and (iii) Crofer 22APU with a MnCo2O4 coating. The location of the fracture in the multilayer samples was determined by SEM and EDS.
It was found that the weakest interfaces are between the Crofer 22 APU and the oxide scale formed during preoxidation (15.9 J/m2) and between Crofer 22 APU and the MnCo2O4 coating (13.6 J/m2). Applying the AlumiLok coating to Crofer 22 APU significantly enhances the stability of the glass–interconnect interface such that the fracture occurred within the glass-ceramic. The critical energy release rate corresponding to the glass-ceramic was 23.7 J/m2. In absolute terms, the fracture energy characteristic of the V11 glass-ceramic is comparable to that of porous NiO/YSZ (∼25 J/m2) and the interface with the AlumiLok is even tougher, i.e., the joint is in this configuration no longer the “weakest link.”
For the case of Mn–Co-oxide-coated interconnects, the fracture energy of the interface is only half the value characteristic of the cell, which should be accounted for in stack designs. In the testing of the Mn–Co-oxide, V11 served as a “glue” between two coated metal bars to test the mechanical properties of the coating.
Acknowledgments
The DTU SOEC stack platform project is acknowledged for funding the research presented in this work. Moreover, the authors would like to thank E. Abdellahi and K. Andersen for the technical assistance.