Malnutrition remains a major public health concern and a leading cause of morbidity and mortality in children under 5 years of age worldwide. In 2025, an estimated 150·2 million children were stunted, 42·8 million were wasted, including 12·2 million with severe wasting, and 35·5 million were overweight or obese(1). Protein–energy malnutrition (PEM) is one of the most prevalent forms of nutritional deficiency, particularly in low- and middle-income countries. It represents a persistent and complex public health challenge that continues to hinder prevention and control efforts(Reference Zhang, Zhang and Pu2). PEM primarily results from insufficient intake or impaired utilisation of energy and protein and is further compounded by the bidirectional relationship between undernutrition and infectious diseases(Reference Zhang, Zhang and Pu2,Reference Scrimshaw, Taylor and Gordon3) .
The WHO South-East Asia Region (SEAR) comprises eleven predominantly low- and middle-income countries(4) and accounts for nearly one-quarter of the global population. The region overlaps substantially with the UN-defined Southern Asia and South-eastern Asia subregions, which together bear a disproportionate share of the global burden of child malnutrition. Although only about one-quarter of the world’s children under 5 years of age live in Southern Asia, this subregion is home to more than half of all children affected by wasting globally(1). Consistent with this, the Global Burden of Diseases (GBD) Study 2021 estimates report that the age-standardised incidence rate of PEM is highest in South Asia among all GBD regions, at 3185·45 per 100 000 population, markedly exceeding the global average(Reference Liu, Liu and Yang5). Within the South-eastern Asia subregion, the prevalence of childhood stunting was 27·4 %, wasting 8·2 %, and overweight 7.5%, with wasting and overweight exceeding the global averages of 6.7% and 5.7% respectively, reflecting the double burden of malnutrition(6). This heterogeneity is compounded at the country-level settings. India continues to report among the highest burdens of child wasting globally, while others, such as Thailand and Sri Lanka, are undergoing a nutrition transition, with declining undernutrition alongside rising childhood overweight. This underscores the wide variation in socio-economic development, healthcare infrastructure, food security and public health policy across SEAR member states, and the need for region-specific, country-disaggregated analysis rather than reliance on pooled global or low-middle-income country-wide estimates. Rapid urbanisation and changing lifestyles have influenced dietary patterns worldwide, with similar transitions observed in SEAR countries. The increased availability and aggressive marketing of low-cost, energy-dense, nutrient-poor foods and beverages targeted at young children have contributed to sub-optimal diets characterised by limited dietary diversity and inadequate nutrient intake. Such diets increase the risk of nutritional deficiencies and contribute directly or indirectly to morbidity and mortality among children under 5 years of age(Reference Hawkes, Ruel and Salm7). Despite regional and global commitments such as the WHO SEAR Regional Nutrition Strategy, the 2025 World Health Assembly global nutrition targets and Sustainable Development Goal 2.2, global progress remains lacking. Only about one-third of countries worldwide are ‘on track’ to halve the number of stunted children by 2030. Additionally, an assessment of progress towards the wasting target is currently unavailable for nearly half of the countries due to data gaps(1).
The GBD provides comprehensive and comparable estimates of incidence, prevalence and mortality of diseases using published, publicly available and contributed data sources. Unlike nationally produced surveys, which differ in survey timing, sampling methodology and case definitions across SEAR countries, GBD applies a standardised modelling framework across all locations and years. This permits direct cross-country comparison and trend analysis that national data sources lack. A SEAR-specific, country-disaggregated GBD analysis is therefore needed to capture the region’s marked internal heterogeneity. In this study, we aimed to quantify the burden of PEM among children under 5 years of age in WHO SEAR countries and to examine temporal trends and patterns in its prevalence using GBD data.
Methods
Data for this analysis were extracted from the GBD 2023 https://vizhub.healthdata.org/gbd-results/, which provides data on mortality and morbidity for 375 diseases and injuries and eighty-eight risk factors across 204 countries and territories. GBD estimates are derived from multiple data sources, including censuses, household surveys, vital statistics and other health-related data, which are systematically collected, compiled and modelled by the Institute for Health Metrics and Evaluation (IHME). This study followed the Guidelines for Accurate and Transparent Health Estimates Reporting (GATHER)(8). The current study focused on children under 5 years of age in the countries of the WHO SEAR, including Bangladesh, Bhutan, the Democratic People’s Republic of Korea, India, Indonesia, Maldives, Myanmar, Nepal, Sri Lanka, Thailand and Timor-Leste.
Estimates of prevalence, incidence, deaths and disability-adjusted life years (DALY) for PEM, defined according to the GBD cause hierarchy and corresponding to ICD-10 codes E40–E46(Reference Zhang, Zhang and Pu2), were extracted for the period 1990–2023. Prevalence, incidence, deaths and DALY were defined as the total number of cases, new cases, deaths and DALY, respectively, in the population. Corresponding rates for each measure were expressed per 100 000 population(9). Trends and patterns in prevalence rates were analysed by age group, sex and Socio-demographic Index (SDI). The age categories used in this analysis were those predefined in the GBD dataset. SDI is a composite indicator of development status, ranging from 0 to 1, calculated as the geometric mean of three components: total fertility rate among women under 25 years of age, mean education of individuals aged 15 years and older and lag-distributed income per capita(Reference Wang, Abbas and Abbasifard10).
Statistical analysis
In this analysis, the numbers of prevalent cases, deaths and DALY, as well as the incidence, prevalence and death and DALY rates for PEM among children under 5 years of age from 1990 to 2023, were extracted from the GBD 2023 database. All estimates are presented with 95 % uncertainty intervals (UI), calculated from the 2·5th- and 97·5th-ordered percentiles of 1000 draws from the posterior distribution.
Temporal trends in PEM prevalence were assessed using Joinpoint regression models implemented in the Joinpoint Regression Program (version 5.2.0, https://surveillance.cancer.gov/joinpoint/), with a significance threshold of p < 0·05(11). This method identifies joinpoints (time points) at which a statistically significant change in trend occurs, thereby segmenting the study period into intervals with distinct trends. The model was fitted assuming constant variance, with coefficients estimated by ordinary least squares, and the best-fitting model selected using the Weighted Bayesian Information Criterion (WBIC). For each identified segment, the annual percentage change (APC) reflecting the constant rate of change within that segment was calculated along with its 95 % CI. The average annual percentage change (AAPC), a weighted average of the segment-specific APC, was then computed to summarise the overall trend from 1990 to 2023. This differs from conventional trend analysis that assumes a single constant rate of change across the entire study period. The relationship between the SDI and prevalence was explored using locally estimated scatterplot smoothing to identify potential nonlinear trends(Reference Jacoby12). All statistical analyses and visualisations were conducted using RStudio (R 4.4.1).
Results
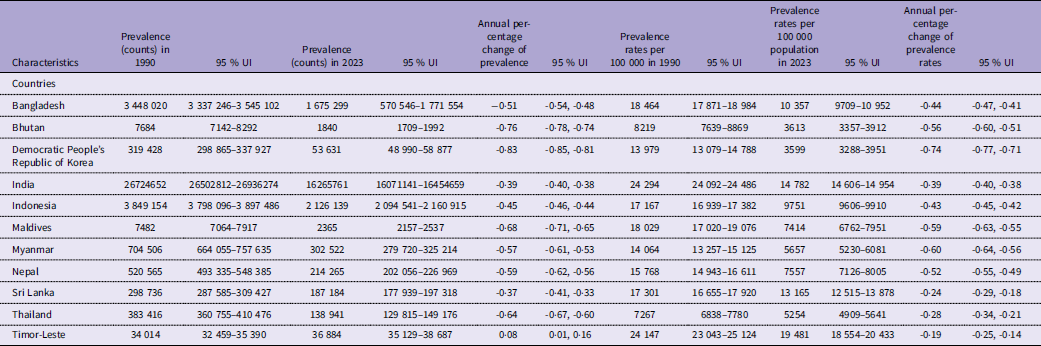
Marked reductions were observed across all epidemiological indicators considered in this analysis (incidence, prevalence, DALY and deaths) in Southeast Asian countries between 1990 and 2023 among children under 5 years of age. Overall, the number of prevalent cases in the SEAR declined from 32·4 million (95 % UI: 32·2–32·7 million) in 1990 to 18·9 million (95 % UI: 18·7–19·1 million) in 2023. The number of prevalent cases declined across most countries included in the analysis between 1990 and 2023 (Table 1). The highest number of prevalent cases was observed in India (26·7 million; 95 % UI: 26·5–26·9 million), followed by Bangladesh (3·4 million; 95 % UI: 3·3–3·5 million) in 1990. The APC in prevalent cases was negative in all countries except Timor-Leste, where a small increase was observed (0·08 %; 95 % UI: 0·01–0·16). The reduction in prevalent cases was more pronounced in the Democratic People’s Republic of Korea (-0·83 %; 95 % UI -0·85 to -0·81) and Bhutan (-0·76 %; 95 % UI -0·78 to -0·74), while Sri Lanka experienced a comparatively slower decline (-0·37 %; 95 % UI -0·41 to -0·33). Estimates of prevalent cases and associated APC from 1990 to 2023 are presented in Table 1 and Figure 2.
Prevalent cases and prevalence rates of protein–energy malnutrition (PEM) among children under 5 years in Southeast Asia in 1990 and 2023 and trends from 1990 to 2023

Table 1. Long description
The table presents data on the prevalence of protein-energy malnutrition (PEM) among children under 5 years in various Southeast Asian countries for the years 1990 and 2023. It includes columns for prevalence counts, annual percentage change of prevalence, and prevalence rates per 100,000 population. The table has 12 rows and 12 columns. Row 1: Bangladesh, 3448020, 3337246-3545102, 1675299, 570546-1771554, -0.51, 18464, 17871-18984, 10357, 9709-10952, -0.44. Row 2: Bhutan, 7684, 7142-8292, 1840, 1709-1992, -0.76, 8219, 7639-8869, 3613, 3357-3912, -0.56. Row 3: Democratic People’s Republic of Korea, 319428, 298865-337927, 53631, 48990-58877, -0.83, 13979, 13079-14788, 3599, 3288-3951, -0.74. Row 4: India, 26724652, 26502812-26936274, 16265761, 16071141-16454659, -0.39, 24294, 24092-24486, 14782, 14606-14954, -0.39. Row 5: Indonesia, 3849154, 3798096-3897486, 2126139, 2094541-2160915, -0.45, 17167, 16939-17382, 9751, 9606-9910, -0.43. Row 6: Maldives, 7482, 7064-7917, 2365, 2157-2537, -0.68, 18029, 17020-19076, 7414, 6762-7951, -0.59. Row 7: Myanmar, 704506, 664055-757635, 302522, 279720-325214, -0.57, 14064, 13257-15125, 5657, 5230-6081, -0.60. Row 8: Nepal, 520565, 493335-548385, 214265, 202056-226969, -0.59, 15768, 14943-16611, 7557, 7126-8005, -0.52. Row 9: Sri Lanka, 298736, 287585-309427, 187184, 177939-197318, -0.37, 17301, 16655-17920, 13165, 12515-13878, -0.24. Row 10: Thailand, 383416, 360755-410476, 138941, 129815-149176, -0.64, 7267, 6838-7780, 5254, 4909-5641, -0.28. Row 11: Timor-Leste, 34014, 32459-35390, 36884, 35129-38687, 0.08, 24147, 23043-25124, 19481, 18554-20433, 0.19.
UI, uncertainty intervals.
Trends in incidence, prevalence, mortality and DALY rates of PEM among children under 5 years in SEAR countries, 1990–2023, stratified by sex. The figure illustrates the prevalence, incidence, DALY and death rates of PEM per 100 000 population among children under 5 years in Southeast Asian countries from 1990 to 2023. A gradual decline was observed in prevalence and incidence rates, but the decline was more pronounced in death and DALY rates from 1990 to 2023. The figure also illustrates the overall trend and the trend across genders, which are roughly similar to the overall trend but with lower death and DALY rates in males compared to those of females in the late 1990s and early 2000s. DALY, disability-adjusted life years; PEM, protein–energy malnutrition; SEAR, South-East Asia Region.

Geographical distribution of prevalence rates of PEM among children under 5 years in SEAR countries, 1990 and 2023. This figure illustrates changes in the prevalence of PEM in the SEAR, expressed as percentages, from 1990 to 2023. India contributed the largest share in 1990, and the same was maintained in 2023 as well, even though rates declined throughout the year. PEM, protein–energy malnutrition; SEAR, South-East Asia Region.

Overall prevalence rate declined from 22 141 per 100 000 population in 1990 to around 13 463 per 100 000 in 2023, with a gradual decrease during the 1990s and 2000s (APC: 0·09 % and a steeper decline during 2010–2023 (APC: 0·3 %). Across the study period, males had higher rates than females for all indicators, while the burden of PEM decreased over time in both; the gap remained the same. Detailed sex-specific trends in incidence, DALY and mortality rates due to PEM over the study period are shown in Figure 1.
Prevalence rates declined from 1990 to 2023 across all age categories in all SEAR countries; however, the burden remained relatively high among older infants and young children. In 2023, the highest prevalence was observed among children aged 6–11 months, 12–23 months and 2–4 years across all countries. Timor-Leste had the highest prevalence rates in these age groups (19 313; 20 125·8; and 19 487·25 per 100 000, respectively), followed by India (17 819·99; 16 091·93; and 13 250·99 per 100 000). Indonesia (13 474·18; 11 177·09; and 8035·49 per 100 000) and Bangladesh (10 373·57; 10 459·96; and 10 347·07 per 100 000) also showed substantial burdens. In contrast, Bhutan, Thailand and the Democratic People’s Republic of Korea exhibited comparatively lower rates. Nepal (9566·24; 8481·38; and 6680·6 per 100 000) and Sri Lanka (12 190·1; 12 552·67; and 13 584·23 per 100 000) showed relatively comparable prevalence rates across the three age categories. Maldives exhibited a relatively higher prevalence in the 2–4-year age group (8183·66 per 100 000) compared with other age groups. Age-stratified prevalence rates across SEAR countries from 1990 to 2023 are illustrated in Figure 3.
Age-specific prevalence rates of PEM among children under 5 years in SEAR countries, 1990–2023. This figure illustrates trends in the prevalence of PEM across SEAR countries from 1990 to 2023 by age group. The highest prevalence was observed in the 6–11 months, 12–23 months and 2–4 years age groups in 2023. The youngest age group (0–6 days) contributed the least to the overall burden. PEM, protein–energy malnutrition; SEAR, South-East Asia Region.

Joinpoint regression analysis between 1990 and 2023 indicated a statistically significant overall decline in prevalence across SEAR countries (p < 0·01). The largest reduction was observed in the Democratic People’s Republic of Korea (AAPC -4·05 %; 95 % CI -4·08 to -4·01), with the steepest decline occurring during 2001–2009 (APC -8·18 %; 95 % CI: -8·37 to -7·96). Declines were also observed in Myanmar (AAPC -2·73 %; 95 % CI -2·74 to -2·72), the Maldives (AAPC -2·66 %, 95 % CI -2·69 to -2·63), Bhutan (AAPC -2·47 %, 95 % CI -2·50 to -2·44) and Nepal (AAPC -2·21 %; -2·23 to -2·19). Bangladesh (AAPC -1·75 %; -1·78 to -1·72), Indonesia (AAPC -1·66 %, 95 % CI: -1·69 to -1·64) and India (AAPC -1·46 %; 95 % CI -1·49 to -1·44) also showed consistent downward trends across the years. However, Bangladesh exhibited a plateau during 2002–2010 (APC -0·01 %, 95 % CI -0·13 to 0·26, p = 0·927), which was not statistically significant, while Indonesia showed a slower decline during 2020–2023 (APC -0·33 %, 95 % CI (-0·77 to -0·03 p = 0·041). In contrast, Thailand (AAPC -0·97 %; 95 % CI -0·98 to -0·96), Sri Lanka (AAPC -0·82 %; 95 % CI -0·84 to -0·80) and Timor-Leste (AAPC -0·66 %; 95 % CI -0·67 to -0·65) showed comparatively smaller overall declines. APC and AAPC estimates from the Joinpoint analysis are presented in Figure 4 and Supplementary Table 1.
Joinpoint regression analysis of PEM prevalence rates among children under 5 years in SEAR countries, 1990–2023. The figure illustrates trends in PEM prevalence across SEAR countries from 1990 to 2023. A significant change in prevalence rates was observed across countries from 1990 to 2023 (AAPC, p-value < 0.05). The plot also shows years in which countries have shown no changes or changes that are not statistically significant. P-values corresponding to the changes are detailed in Supplementary Table 1. PEM, protein–energy malnutrition; SEAR, South-East Asia Region; AAPC, average annual percentage change.

Figure 4. Long description
The image contains twelve line graphs, each representing a different country in the South-East Asia Region. Each graph shows the trend in the prevalence of protein-energy malnutrition (PEM) among children under 5 years from 1990 to 2023. The countries represented are Bangladesh, Bhutan, Democratic People’s Republic of Korea, India, Indonesia, Maldives, Myanmar, Nepal, Sri Lanka, Thailand, and Timor-Leste. Each graph has the year on the horizontal axis and the prevalence rate per 100,000 population on the vertical axis. The red dotted lines indicate the trends over the years. The graphs show a general decline in PEM prevalence across all countries, with varying rates of change. Some countries, such as India and Indonesia, show a significant decrease, while others, like Bhutan and Timor-Leste, show a more gradual decline. The graphs also indicate years where changes are not statistically significant. The overall trend suggests improvements in combating PEM in the region, though the rate of progress varies by country.
Figure 5 and Supplementary Table 2 present the ecological association between the SDI and prevalence rates of PEM in SEAR countries from 1990 to 2023. Across countries, SDI increased over the study period, accompanied by a decline in PEM prevalence. However, the strength and direction of this relationship varied across counties, as reflected by differences in the slopes of country-specific trajectories, indicating heterogeneity in the association between SDI and PEM prevalence.
Ecological association between the Socio-demographic Index (SDI) and prevalence rates of PEM among children under 5 years of age in SEAR countries, 1990–2023. The figure illustrates trends in PEM prevalence per 100 000 population and its association with the SDI index. Each colour on the map represents a country in the SEAR, and the symbol’s location indicates the year. The black line in the centre represents the overall trend, and the grey area shows the 95 % CI across all SEAR countries. PEM, protein–energy malnutrition; SEAR, South-East Asia Region.

Discussion
This study provides a comprehensive assessment of the prevalence and temporal trends of PEM among children under 5 years of age in WHO SEAR countries using data from the Global Burden of Disease Study 2023. Our findings demonstrate a substantial overall decline in prevalence, incidence, deaths and DALY count between 1990 and 2023. Despite these encouraging regional improvements, the burden of PEM remains considerable in several countries, with substantial variation in prevalence levels and temporal trends across nations. In addition, the prevalence rates of PEM remain disproportionately high among older infants and young children, highlighting important age-related disparities in PEM prevalence.
The reduction in prevalence counts and prevalence rates per 100 000 population across countries over the years indicates a genuine improvement in the burden rather than merely a demographic artefact of changes in population size or age structure. This is particularly relevant given that several SEAR countries have experienced substantial declines in total fertility rates over the past three decades, which could otherwise account for part of the reduction in absolute case counts alone. The steady decline in PEM prevalence across SEAR over the past three decades may be associated with broader improvements in socio-economic conditions, maternal education, child survival programmes and expanded access to primary healthcare. Global analyses have consistently shown that improvements in education and income, along with reductions in fertility, are associated with declines in child undernutrition(Reference Headey, Hoddinott and Park13). The sharper decline observed after 2010 may partly reflect the cumulative impact of strengthened nutrition-specific and nutrition-sensitive interventions implemented across the region, alongside global initiatives such as the Scaling Up Nutrition (SUN) movement and Sustainable Development Goals (SDG)(14).
The observed ecological association between an increase in the SDI and a decline in PEM prevalence reinforces the importance of broader development factors in shaping child nutrition outcomes. Previous GBD analyses have similarly demonstrated strong inverse relationships between SDI and DALY attributable to child undernutrition. However, the variability in slopes across countries suggests that economic growth alone is insufficient to reduce PEM; governance quality, equity in service delivery and health system performance likely play important mediating roles(Reference Zhang, Zhang and Pu2,Reference Nallari and Griffith15) . In addition to socio-economic and health system factors, improvements in environmental conditions across the region, including expanded access to safe drinking water, improved sanitation facilities and reduced open defecation, likely contributed to the observed decline in PEM prevalence. Improved water, sanitation and hygiene (WASH) help reduce enteric infections, thereby improving nutrient absorption in young children. However, as an ecological analysis, this study cannot establish causal relationships between these factors and the observed decline in PEM prevalence; the associations described here should be interpreted as plausible contributors rather than confirmed determinants.
Although all countries experienced an overall decline in PEM burden, the magnitude and pace of reduction varied substantially across SEAR. This pattern is consistent with other global trends, where mortality and DALY have declined since 1990, but the burden remains higher. Similar heterogeneity has been documented in global undernutrition trends, where neighbouring countries with comparable income levels show markedly different trajectories due to differences in policy prioritisation and implementation capacity(Reference Zhou, Li and Cai16). India and Bangladesh continue to contribute the largest absolute number of cases due to their large population sizes. Despite sustained reductions, India accounts for a substantial share of the global burden of child undernutrition(1,Reference Headey, Hoddinott and Park13) . This underscores the need for intensified, equity-focused strategies targeting high-risk districts and marginalised populations. In contrast, Timor-Leste’s slower progress may reflect persistent food insecurity, fragile health systems and heightened vulnerability to economic and climatic shocks, factors recognised as important drivers of undernutrition globally(17). The plateau observed in Bangladesh during 2002–2010 and the slower decline in Indonesia in recent years mirror findings from other low-middle-income country settings, where economic transitions do not always translate immediately into improvements in child nutrition outcomes without nutrition-sensitive interventions(Reference Ruel and Alderman18).
The highest prevalence observed among children aged 6–23 months aligns with well-established evidence identifying the complementary feeding period as the most critical window for growth faltering(Reference Dewey and Adu-Afarwuah19). During this stage, children experience increased nutritional requirements while also facing greater exposure to contaminated complementary foods and heightened susceptibility to infections, which interact bidirectionally with undernutrition(Reference Scrimshaw, Taylor and Gordon3,Reference Dewey and Adu-Afarwuah19) . Growth faltering often begins in utero and accelerates during the first 2 years of life, with long-term consequences for cognitive development, educational attainment and adult productivity(Reference Hoddinott, Behrman and Maluccio20). The persistent burden observed among children aged 2–4 years in some countries may reflect cumulative nutritional deficits and continued exposure to adverse environmental exposures.
SEAR countries have undergone rapid urbanisation and dietary transitions over the past three decades. While reductions in severe wasting have been observed, shifts towards energy-dense, nutrient-poor diets have contributed to the emerging double burden of malnutrition(Reference Popkin, Corvalan and Grummer-Strawn21). The coexistence of persistent undernutrition and rising childhood overweight highlights the complexity of ongoing food system transitions in the region. The slower decline observed during 2020–2023 may partly reflect the indirect effects of the COVID-19 pandemic. Global modelling studies have suggested substantial increases in child wasting and disruptions in essential nutrition services during the pandemic period(Reference Headey, Heidkamp and Osendarp22). Disruptions in food supply chains, economic contraction and reduced utilisation of health services may therefore have slowed progress in several SEAR countries.
The main strength of this study is the use of standardised and comparable estimates from GBD 2023, enabling long-term and cross-country comparisons of the burden of PEM. In addition, the use of Joinpoint regression allowed the identification of inflection points in temporal trends, providing insights into changes in the pace of decline over time. However, several limitations should be acknowledged. GBD estimates rely on modelling techniques that integrate heterogeneous data sources, which may introduce uncertainty, particularly in data-sparse settings and countries with limited vital registration and surveillance systems. Furthermore, the use of ICD-based definitions for PEM may underestimate subclinical or community-level undernutrition. Finally, the ecological associations observed between SDI and PEM prevalence should not be interpreted as causal, and SDI may not fully reflect within-country equality, as it is an aggregate developmental index.
Our findings highlight the need to sustain and strengthen integrated nutrition strategies across SEAR countries. Expanding nutrition-specific interventions, including promoting exclusive breast-feeding, complementary feeding counselling, micronutrient supplementation and community-based management of acute malnutrition, remains essential(Reference Dewey and Adu-Afarwuah19). At the same time, scaling up nutrition-sensitive interventions such as improvements in sanitation, women’s education, poverty reduction and food security programmes will be critical to address the underlying determinants of child undernutrition(14). Targeting high-burden districts and vulnerable groups may help reduce persistent inequities. Strengthening nutrition surveillance and the resilience of health systems, particularly during public health emergencies, will also be important to sustain progress(Reference Headey, Heidkamp and Osendarp22). Lessons from countries that have achieved more rapid declines in PEM may help inform effective policy implementation across the region.
Conclusion
Our study examined the prevalence and temporal trends of PEM among children under 5 years of age in the WHO SEAR and found a significant decline in the burden between 1990 and 2023. Despite this progress, PEM remains a significant public health concern in several countries across the region. Further research should explore subnational disparities, sex-specific differences and the interactions between childhood undernutrition, climate-related food insecurity and infectious diseases. In addition, evaluating the effectiveness of national nutrition programmes and social protection initiatives may help accelerate progress towards global nutrition targets and SDG 2 (Zero Hunger).
Supplementary material
For supplementary material/s referred to in this article, please visit https://doi.org/10.1017/S0007114526108538
Data availability statement
The data used in the analysis are available from the Global Burden of Disease Study 2023 (GBD 2023) https://vizhub.healthdata.org/gbd-results/ or from the corresponding author on request.
Acknowledgement
The authors would like to thank the GBD – 2023 and its collaborators. Also, the authors would like to acknowledge the use of ChatGPT to refine the R code for generating the plots and Grammarly to correct and format the grammar and sentence structure. The authors would also like to acknowledge Dr Mahendra Singh for his guidance and contributions to the analysis.
M.S.: Conceptualisation-Equal, Data curation-Lead, Formal analysis-Lead, Methodology-Equal, Software-Lead, Visualisation-Lead, Writing – original draft-Equal; K.M.: Conceptualisation-Equal, Supervision-Equal, Validation-Equal, Writing – original draft-Equal, Writing – review and editing-Equal; T.J.: Methodology-Equal, Writing – review and editing-Equal; S.K.: Methodology-Equal, Visualisation-Supporting, Writing – review and editing-Equal; M.R.F.: Methodology-Equal, Writing – review and editing-Equal; S.M.D.: Conceptualisation-Equal, Methodology-Equal, Supervision-Equal, Validation-Equal, Writing – review and editing-Equal.
No financial support.
The authors disclose no conflicts of interest.