


Introduction
The development of rural factor markets in north-western Europe during the transition from the Middle Ages to the early modern period, while not necessarily leading to sustained economic growth, has increasingly been considered of crucial importance for the region's economic development (Van Zanden, Reference Van Zanden2009: 19–31; Van Bavel, Reference Van Bavel2008). The ability to exchange means of production through markets fundamentally altered the social, political and economic structure of rural societies in western Europe (Devos, Lambrecht and Paping, Reference Devos, Lambrecht, Paping, Vanhaute, Devos and Lambrecht2011: 178–80; Thoen, Van Bavel and van Cruyningen, Reference Thoen, van Bavel, van Cruyningen, van Bavel, Hoyle and Brakensiek2010: 182–93). The development of land markets enabled peasants and manorial lords alike to transfer property through channels other than custom, inheritance or coercion (Van Bavel, Reference Van Bavel2004; Van Bavel, Reference Van Bavel2008). Furthermore, it facilitated market participation as part of a risk-coping strategy (Razi, Reference Razi1980: 92–8; Van Onacker, Reference Van Onacker2013). In turn, market participation led to a redistribution of property between social groups. Through the credit market, funds could be obtained that allowed individuals to accumulate land (Soens and Thoen, Reference Soens, Thoen and Cavaciocchi2004: 714–20). Any agricultural surpluses, as well as proto-industrial products, would be sold at the surrounding urban markets, creating interdependence between town and countryside in the process (Limberger, Reference Limberger2008; Limberger, Reference Limberger, Van Cruyningen and Thoen2012; Vermoesen, Reference Vermoesen2010; Vermoesen, Reference Vermoesen2011). As these additional plots could not be tilled singlehandedly, their purchasers hired an additional workforce on the labour market. This allowed young men and women to save much needed capital, which in due time would enable them to start a farm of their own.
Although a certain degree of commodification was present throughout the West European countryside by 1500, this process showed vast regional differences in speed as well as in effect, as the recent volumes of ‘Rural Economy and Society in North-Western Europe’ show.Footnote 1 While the intricacies of the economic structure of the Low Countries between 1400 and 1800 are well researched, the role of factor markets as determinants of this economic structure has long been overlooked, especially with regards to the southern Low Countries. Yet the large agricultural productivity that supported the early urbanisation of Flanders and Brabant, the differences in ecological and economic structure between regions, and the abundance of source material make the former duchy of Brabant and county of Flanders an interesting case study to assess how and to what extent the commodification of land, capital and labour shaped early modern society.
During the past decade our understanding of the labour and credit markets in the southern Low Countries has been extensively advanced (Soens and Thoen, Reference Soens, Thoen and Cavaciocchi2004; Thoen and Soens, Reference Soens, Thoen, Lambrecht and Schofield2009; Lambrecht, Reference Lambrecht2003; Lambrecht, Reference Lambrecht and Fertig2015; Devos, Vanhaute and Lambrecht, Reference Devos, Lambrecht, Paping, Vanhaute, Devos and Lambrecht2011). The role played by the development of the land market in the commercialisation of the countryside is well known. As the influence of both common land and lords diminished over the course of the fourteenth century, this enabled the transfer of land among peasants as well as opened up the possibility to experiment with new cultivation techniques (Van Bavel, Reference Van Bavel2002: 15–21). Whereas yield ratios in much of Europe hardly surpassed a 4:1 ratio by the start of the seventeenth century, in both England and the Low Countries it had far surpassed the 6:1 ratio by 1600. By the final decades of the Ancien Régime, yield ratios in the southern Low Countries were averaging 10:1, mainly achieved by the combination of high labour input on small well-fertilised plots (De Vries, Reference De Vries1984; Schneider, Reference Schneider2011; Tits-Dieuaide, Reference Tits-Dieuaide1975; Dejongh and Thoen, Reference Dejongh, Thoen, van Bavel and Thoen2011). This increase in arable productivity coincided with a significant population increase, driving up competition for land and diminishing farm sizes in the process (Thoen, Reference Thoen, Hoppenbrouwers, Thoen and van Bavel2004).
While the market for land in the southern Low Countries has been rigorously studied, most research is limited in both temporal and geographical scope (Scholliers and Daelemans, Reference Daelemans and Scholliers1981; Scheelings, Reference Scheelings, Craeybeckxs and Daelemans1988; Van Onacker, Reference Van Onacker2013; De Wever Reference De Wever1976; Limberger, Reference Limberger, Schofield and Lambrecht2009; Thoen, Reference Thoen1978; Vande Walle, Reference Vande Walle, Dorban and Servais1994; Curtis, Reference Curtis2013: 71). Hence, with regards to the southern Low Countries, our knowledge of the rural land market and its relationship to the socio-economic change that occurred during the early modern period is fragmentary. This article seeks to address this issue by presenting time-series data on the rural land market in the two most densely populated parts of the southern Low Countries (that is, Inland Flanders and Brabant) between the fourteenth and eighteenth centuries. The objective is to assess how the rural land market can be considered as a catalyst of socio-economic change in its own right. The remainder of this article is structured as follows: in the second and third sections the case studies and the sources used to construct the time-series are presented. The fourth section sets forth a general overview of market activity. In the fifth section I investigate the changing composition of the rural land market as well as the size of the transferred plots. The sixth and final section provides some tentative conclusions as well as topics for further research.
Sources
Historians have used a wide variety of sources to study both the structure of landholding and the transfer of property. These can be divided into two categories: legal documents on the one hand and quantitative sources on the other. The former encompasses aldermen registers, manorial court rolls, cartularies and notarial records and stem from the desire of the contracting parties to officialise (in one way or another) the transfer of a particular bundle of usage rights. The type of material used in historiography largely depends on the institutional context. For example, notarial records are predominantly used in southern Europe whereas in north-western Europe manorial accounts, manorial court rolls or aldermen registers make up the majority of the sources used by historians. English research on the peasant land market, for example, is highly dependent on the use of legal documents (manorial court rolls) to track land sales (Schofield, Reference Schofield, Feller and Wickham2005; Dribe, Olsson, and Svensson, Reference Dribe, Olsson and Svensson2012; Goodyear-Garrett, Reference Goodyear-Garrett and Whittle2014; Campbell, Reference Campbell2009; Davies and Kissock, Reference Davies and Kissock2004). Recently, Margret Yates has convincingly managed to use feet of fines as the starting point for her analysis of the late medieval rural land market in south-west England (Yates, Reference Yates2013a; Yates, Reference Yates2013b). The latter were not designed to serve as a legal document but were registered either because taxes were due on the transfer or for accounting purposes. In Central Europe, the available source material to study the rural economy is minimal compared to the British Isles and the North Sea area. As a consequence, historians studying Central Europe have to rely on alternative sources such as forfeiture and confiscation records (Congost and Santos, Reference Congost, Santos, Congost and Santos2010).
With regards to the land market of the early modern Low Countries, most research uses aldermen records and registers to asses market activity (Vande Walle, Reference Vande Walle, Dorban and Servais1994; De Wever, Reference De Wever1972; Daelemans, Reference Daelemans1986; De Wever, Reference De Wever and Van Der Wee1978; Van Onacker, Reference Van Onacker2013). As two contracting parties wanted to ensure the legal enforceability of the arrangement, they sought to officialise their contract before the local aldermen's bench. As the members of the bench formalised their arrangement, a scribe would write down the contract in triplicate: one for each of the contracting parties and a third to be kept within the registers of the aldermen's bench. While initially this process was voluntary, registration of contracts involving credit and land transactions became mandatory with the implementation of the ‘Eeuwig Edict’ from 1611 onwards (Dambruyne, Reference Dambruyne1988: 166–7). Hence, these sources contain a wealth of information about a vast array of legal transactions and contracts between individuals. However, aldermen registers also have a number of significant drawbacks. Since all voluntary jurisprudence was recorded in the registers, only a small proportion of the records actually deal with the transfer of land. The majority of the minutes refer to minor disputes, small legal claims or rent transactions. Furthermore, while the aldermen's registers of major cities in the southern Low Countries are available from as early as the fourteenth century, this is not the case for localities in their hinterlands (Soly, Reference Soly1974). In rural Flanders, Brabant and Hainaut, most aldermen registers are only fragmentarily preserved from the mid-sixteenth century on. Consequently, reconstructing market activity to gauge long-term economic processes is time consuming at best and unfeasible at worst. Hence, a year-on-year analysis of the rural land market would only be possible from the start of the seventeenth century onwards. Finally, whenever a piece of rural property was conveyed between townsmen, these acts would be executed before the aldermen's bench of their respective towns and not necessarily the aldermen's bench of the parish where the plot was located. Hence, urban activity on the rural land market is underrepresented in rural aldermen registers (Thoen, Reference Thoen1988).
As opposed to southern Europe, where notaries were strongly developed in both the urban and rural sphere, notarial archives for the southern Low Countries are scarce before the late eighteenth century (Van Bavel, Reference Van Bavel2008). As local aldermen's benches had managed to formalise their own authority from very early on, the institutional development of notaries in the early modern Low Countries was severely curtailed (Murray, Reference Murray1986; Prevenier, Murray and Oosterbosch, Reference Prevenier, Murray and Oosterbosch1995). It was only during the late eighteenth century that local notaries managed to carve out a niche for themselves within the urban and rural sphere, either as proctors for urban investors in the countryside or as financial intermediaries for the affluent bourgeoisie (Degryse, Reference Degryse2001; De Reu, Reference De Reu2012; De Reu and De Vijlder, Reference De Reu and De Vijlder2014).
While the predominant use of aldermen registers in Flemish historiography would suggest the absence of viable alternatives, this is not the case. Manorial accounts, for example, offer significant benefits over the traditionally used aldermen registers. First and foremost, they are well preserved for rural manors scattered across Flanders and Brabant form the early fifteenth century onwards. Second, the revenues from seigniorial rights, pontgeld (in the duchy of Brabant) or markgeld (in the county of Flanders), provide direct insight into the transfer of property within a specific manor. These manorial rights were conveyance taxes (generally between 5 per cent and 6.25 per cent of the transaction price) payable by the buyer either when real estate was sold or when rents were issued on property.Footnote 2 Thus, this particular revenue entry gives an instant overview of market activity in a single year. Unlike aldermen registers, all relevant transactions of a single year are bundled, facilitating the construction of time-series data for an extended period. Similarly, the non-registration of rural land transfers conducted between burghers is excluded. Note that these taxes were not due in every manor and not due on all types of property. For example, in the south of Flanders and the centre of Brabant on the contrary, the markgeld was only payable when cijnsgoederen were being transferred.Footnote 3 In the south-west of Brabant as well as in the hinterland north-west of Ghent, conveyance taxes were due on both allodial and cijnsgoederen (Thoen, Reference Thoen1988; Scheelings, Reference Scheelings, Craeybeckxs and Scheelings1990b; Daelemans and Scholliers, Reference Daelemans and Scholliers1981; De Vijlder, Reference De Vijlder2013). The local bailiff or steward (depending on local customs or ad hoc arrangements) was responsible for the collection of the aforementioned tax. Hence, the individual transactions on which pont- or markgeld was due were listed in either the manorial or bailiff accounts. In order to avoid fraudulent behaviour and safeguard the proper registration of the revenues, a serious problem for the mostly absent lords of the manor, the local steward or bailiff was frequently granted a percentage of the revenues of the pontgeld as part of his remuneration (Scheelings, Reference Scheelings, Craeybeckxs and Scheelings1990b). Nonetheless, the information contained within the records of these transactions could differ quite markedly, depending on the diligence of whoever was responsible.
Some fundamentals could nevertheless always be extracted, regardless of the case study. This comprises the surface area of the transferred plot, the type of plot, the locality, the sale price, if and to what amount rents were established on the plot and the names and surnames of both contracting parties. In the case of Overzenne, the local steward always indicated whether the sale of land occurred as a result of a death.Footnote 4 In the county of Evergem (in the surroundings of Ghent) the bailiff (or his scribe) even distinguished between the owner of the usufruct and the owner of the freehold. Moreover, the amount of detail provided improved substantially as time progressed. In fifteenth-century manorial accounts the description of the transferred property was often limited to the type of land (arable, woodland, meadow or farmstead), without any indication of the acreage other than a diminutive term, for example, ‘een plek(sken)’ – a (small) parcel – or ‘een block(sken)’ – a (small) patch – providing only a rough indication of the size of the plot. Note that for the description of the type of property itself a variety of concepts were used. This depended on local custom and toponyms (for example, brembosch, kouterveld or vitseroelveld) and the need to be able to convey subtle differences in intrinsic soil or land use (for example, beemd, weide, hooiweide, meersch). Up until the middle of the sixteenth century, on average 30 per cent of all transactions in the domain of Kruikenburg and up to 16 per cent of the transactions in the duchy of Evergem were recorded without any information on the acreage of the property. On the contrary, in the parish of Eke where aldermen registers rather than manorial accounts were used, few or no sales were recorded during the eighteenth century that did not specify the surface area.
As the sales in the manorial accounts were recorded for accounting purposes rather than out of legal enforceability, the type and amount transferred were of lesser importance than the transaction price (on which the tax was due). From the late sixteenth century onwards, however, the detail in which the transactions were recorded in the manorial accounts improved significantly. By the middle of the seventeenth century, less than one in every ten transactions recorded in the manorial accounts were without any indication of the surface area. Specifically with regards to the transfer of farmsteads the quality and detail of the descriptions had greatly improved. During the fifteenth and early sixteenth centuries, the transfer of a complex holding (for example, farm, multiple plots of land, etc.) was often recorded without any explicit indication of the total size of the holding, let alone any breakdown of its constituent parts. Starting from the late sixteenth century manorial accounts became increasingly detailed and provided – at the very least – an indication of the general build quality of the structure, the number of outbuildings, the types of land incorporated in the sale and whether any movable goods were included in the sale. From the early seventeenth century onwards, the description of the transactions distinctly improved, not only with regards to the transferred acreage, but also with respect to the location of the plot(s), whether or not they were mortgaged, the neighbouring landowners and to what extent feudal dues and rents were due. This significant improvement in bookkeeping practices by the local stewards has to be seen in relationship to the increasing emergence of local rural aldermen's benches (Soly, Reference Soly1974). Consequently the quality of manorial accounts came close to the detail provided within the aldermen's registers and are highly comparable to the English manor court rolls and feet of fines (Yates, Reference Yates2013b; Yates, Reference Yates2013a; Goodyear-Garrett, Reference Goodyear-Garrett and Whittle2014; Schofield, Reference Schofield, Feller and Wickham2005). In both the duchy of Evergem and the domain of Kruikenbrug the owners of the surrounding plots were referred to as well, consequently, effectively chronicling the property's geographical as well as social embeddedness in a fashion similar to collective memory as has been argued by Ian Blanchard (Blanchard, Reference Blanchard and Smith1984).
To date, historians of the southern Low Countries have hardly ever used manorial accounts as their sources. Both Eddy Van Cauwenberghe and Mina Martens did not discuss the revenues of the conveyance tax in their works on the administration of the ducal domain in Brabant (Martens, Reference Martens1954; Cauwenberghe, Reference Cauwenberghe1975). Etienne Scholliers and Frank Daelemans only used them to construct a small time-series (from 1450 until 1560) of land prices for a small manor in the south-east of Flanders (Scholliers and Daelemans, Reference Daelemans and Scholliers1981). Erik Thoen used a largely similar approach in his analysis of the transition of the socio-economic structure of Inland Flanders between the late Middle Ages and the early modern period, yet data were too fragmentary to construct meaningful time-series (Thoen, Reference Thoen1988). The time-series data presented in this article were constructed using original research as well as earlier-published material.Footnote 5
Case studies
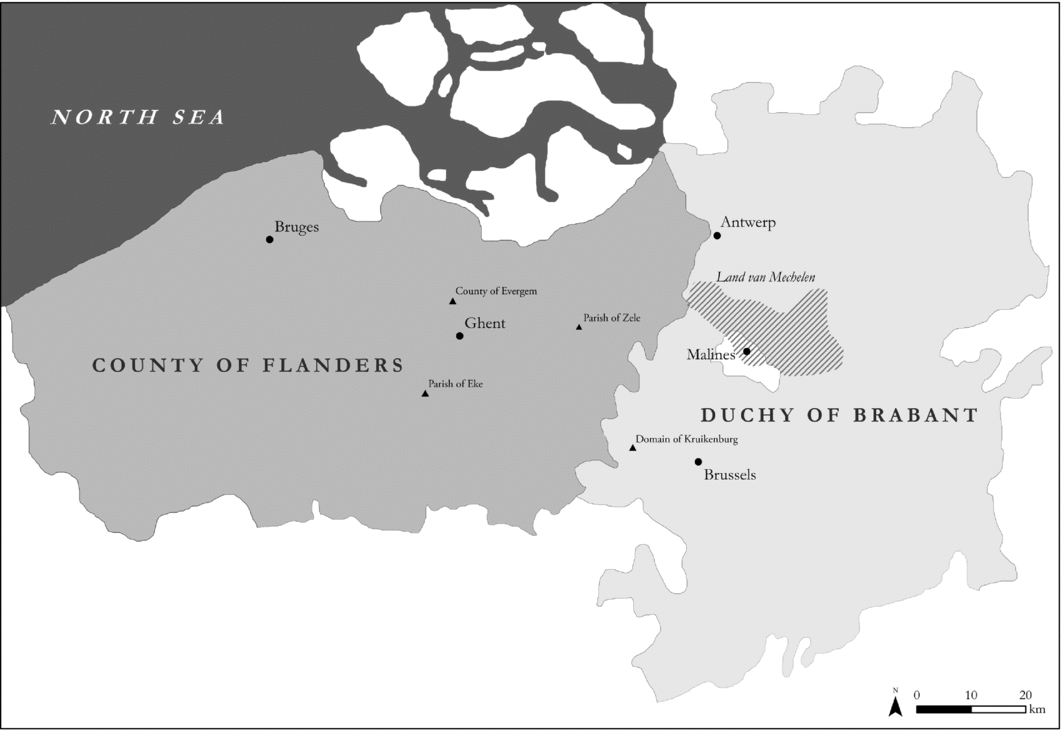
As opposed to most of Europe, where produce for the market consisted of irregular surpluses, by the late Middle Ages agriculture in the southern Low Countries had become quite specialised and oriented towards the urban market (de Vries, Reference De Vries1976; Van Bavel, Reference Van Bavel2001). Limited institutional barriers, high labour input on small acreages and close proximity to urban centres are considered to be the defining features of the social-agrosystem of Inland Flanders (Thoen, Reference Thoen, Hoppenbrouwers and Van Zanden2001: 111). The localities presented in this study were specifically selected to reflect these attributes. All localities are situated between 10 and 20 kilometres from large towns. Three of them are located in the sandy region of Inland Flanders, whereas one is situated in the sandy-loamy region of the duchy of Brabant, west of Brussels.
Flanders and Brabant.

The first case study in the county of Flanders is Eke, a small parish in the region het Scheldeveldt – a reference to the River Scheldt that traverses the locality – situated approximately 10 kilometers to the south of Ghent (Van den Abeele, Reference Van den Abeele1971). During the Middle Ages and early modern period, it was situated within the castellany of Oudburg in the county of Flanders. The seigniory of Eke consisted of the parish of Eke and a small district called de Splete van Eke in present-day Nazareth. The data presented on the land market of Eke only refer to the parish of Eke and were compiled using the ‘traditional’ aldermens's registers and wettelijke passeringen. Due to the unavailability of sufficient source material, the dataset for Eke only concerns the eighteenth century. During this period, the parish was confronted with striking population growth, from 800 inhabitants around 1710 to about 1,500 inhabitants in 1795 (Coppieters, Reference Coppieters1991). This evolution – in line with the general trend for Inland Flanders during this period – resulted in high population density, which in turn put a significant amount of stress upon the traditional socio-economic structure. This ‘shock’ was absorbed through both farm subdivision and the commodification of excess labour.
The second case study in the county of Flanders, the parish of Zele, is located in the Land van Dendermonde, an administrative unit comprising some twenty-four villages between the Rivers Scheldt and Dender. The locality is located on the west bank of the River Scheldt, about 20 kilometers downstream from Ghent and next to the medieval market town of Dendermonde. Zele was a substantial locality, comprising approximately 2,769 hectares by the middle of the sixteenth century. With about 3,000 inhabitants, the village was already densely populated by 1572. Similar to the other case studies, the military operations by Spanish and Dutch troops wreaked havoc on the local economy as the population declined by around 1,100 souls (Pée, Reference Pée1971; De Wever, Reference De Wever and Van Der Wee1978). During the course of the seventeenth and eighteenth centuries the population in Zele rose steadily from about 1,900 in 1605 to 4,200 around 1700 and 7,000 inhabitants by the start of the Brabant Revolution, despite several outbreaks of The Black Death (1645–50, 1665–70 and 1675–80) and the frequent passages of foreign troops. This population growth resulted in a substantially higher population density than was the case in the other three localities, which could only be sustained through a combination of market-oriented farming (especially flax cultivation) and proto-industrial activity (linen-weaving) (Michem, Reference Michem1957).
The third case study, the county of Evergem, consists of two parishes (Sleidinge and Evergem) situated approximately 10 kilometres to the north-west of Ghent. The origins and development of Sleidinge and Evergem cannot be seen apart from the development of the abbey of Saint Bavo, that led the cultivation of this region from the tenth century onwards (Verhulst, Reference Verhulst1958). When the abbey of Saint Bavo was dissolved by Charles V's royal decree in 1540, its properties were transferred to the diocese of Ghent and the entity was renamed the county of Evergem (Werkgroep Achiel De Vos, 1994). The designations ‘the manor of Saint Bavo’, ‘Sleidinge-Saint Bavo’ and ‘Evergem Saint Bavo’, however, remained in use throughout the sources.Footnote 6 By the middle of the sixteenth century, the feudal structure of both parishes was as follows. Sleidinge could roughly be subdivided into two large parts, Sleidinge-St Bavo (approximately 1,220 ha) and Sleidinge-Keure (comprising 801 ha).Footnote 7 The former was part of the old manor of Saint Bavo, while the latter was part of the Keure of Desteldonk, belonging to the domain of the count of Flanders (Notteboom et al., Reference Notteboom, Notteboom, Neyt and De Wildeman2006). Evergem can be divided in three main parts. The hamlet of Belsele, to the west of the village centre, was part of the manor of Vinderhaute. This area was originally part of the estate of Saint Bavo, but was abandoned during the invasion of the Normans. When the possessions of the abbey were reinstated in 966, not all land could be recovered (Notteboom, Reference Notteboom, Notteboom, Neyt and De Wildeman2006; Werkgroep Achiel De Vos, 1994). To the north-east of the centre lay the neighbourhood Doornzele that, like Sleidinge-Keure, belonged to the Keure of Desteldonk (Werkgroep Achiel De Vos, 1994). The remainder, Evergem, comprising 2,550 hectares or about three quarters of the parish, was part of the county of Evergem. Thus, the surface area of this second case study amounts to approximately 3,770 hectares. Here, markgeld to the amount of 6.25 per cent was owed to the secular lords – first the abbot of Saint Bavo and from 1541 the bishops of Ghent – on the transfer of both customary and freehold property within the county of Evergem.
The Brabant case study – the domain of Kruikenbrug – concerns three parishes (Wambeek, Saint-Katherina Lombeek and Ternat) in South Brabant, approximately 15 kilometres west of Brussels. Neatly girded by the Dender to the west and the Senne in the east, the domain of Kruikenburg was situated in a rolling landscape (Vermeulen and Bleys, Reference Vermeulen and Bleys2011). The loamy soil, thanks to its high propensity to retain water and nutrients, in combination with good drainage through a vast network of brooks and creeks traversing the localities, made the land highly fertile and very suitable for arable farming. ‘Wet’ meadows, suitable for keeping livestock on the other hand, were in short supply. During the early Middle Ages the three parishes belonged to the domain of the Saint Gertrude abbey in Ninove. During the high Middle Ages the manor was sold to the Van Wezemaals who constructed the first castle Kruikenburg in Ternat. Henceforward, the manor would be known as the manor of Kruikenburg (Ockeley, Reference Ockeley2010). By the end of the fourteenth century, the Van Wezemaals had run into financial trouble and were forced to relinquish their rights and sell the property to the ‘t Serclaes family, prominent burghers from nearby Brussels (Erpelinck, 1999). By this time, the domain had a surface area of 2,750 hectares of which 680 hectares were heath and woodland (Verbesselt Reference Verbesselt1986; Verbesselt Reference Verbesselt1995). Well into the sixteenth century the manor changed hands once more, this time through marriage. In 1562 Charles de Fourneau, son of Simon de Fourneau, the former chamberlain of Charles V, married Maria van Ghijn, lady of Kruikenburg (Scheelings, Reference Scheelings1982: 44). The remainder of the Ancien Régime, the manor of Kruikenburg remained in the hands of the de Fourneau family. As the result of an interesting institutional arrangement between the first secular lords of the aforementioned parishes and the duke of Brabant, the revenues of the pontgeld, while being collected by the ducal administration, had to be split with the local lord. Thus, the revenues recorded in the manorial accounts only accounted for 2.5 per cent of the total price (Scheelings, Reference Scheelings1990a).
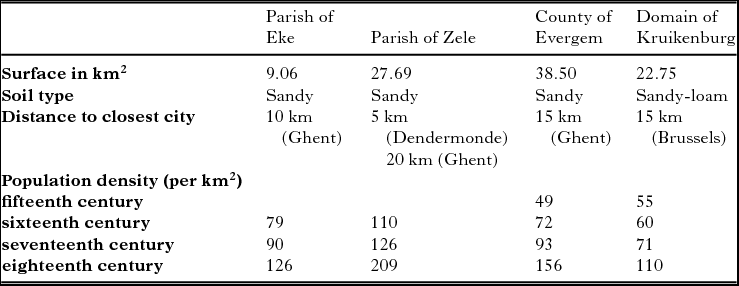
As can be seen in Table 1, population pressure in Inland Flanders was already at substantial levels by the fifteenth through to the mid-sixteenth centuries (De Vos, Reference De Vos1960; Parys, Reference Parys1982; Martens, Reference Martens2005). However, especially in the late seventeenth and eighteenth centuries, the rural population rose exponentially as Flemish husbandry came to its full development within the socio-agrosystem of Inland Flanders and South Brabant (Thoen, Reference Thoen, Hoppenbrouwers, Thoen and van Bavel2004; Dejongh and Thoen, Reference Dejongh, Thoen, van Bavel and Thoen2011; Thoen, Vanslembrouck and Lehouck, Reference Thoen, Vanslembrouck and Lehouck2006; Vanhaute, Reference Vanhaute1993; Thoen and Vanhaute, Reference Thoen and Vanhaute2000; Vanhaute, Reference Vanhaute2001). Compared to the case studies in Inland Flanders, the population pressure in the domain of Kruikenburg remains rather limited between the fifteenth and the seventeenth centuries. Only by the middle of the eighteenth century did a considerable rise in the number of inhabitants occur. The evolution has to be considered in relation to the strong economic development of Brussels as the capital of the Austrian Netherlands (Blondé, Reference Blondé1999; Daelemans, Reference Daelemans, Janssens, Janssens, Scholliers, Van den Wijngaert, Van Hemelryck and Peeters1989). As will be shown in the following sections, socio-economic processes within the rural land market were closely intertwined with the establishment of Flemish husbandry and the gradual pauperisation of rural Flanders and Brabant during the seventeenth and eighteenth centuries.
Overview of case studies.

Market activity
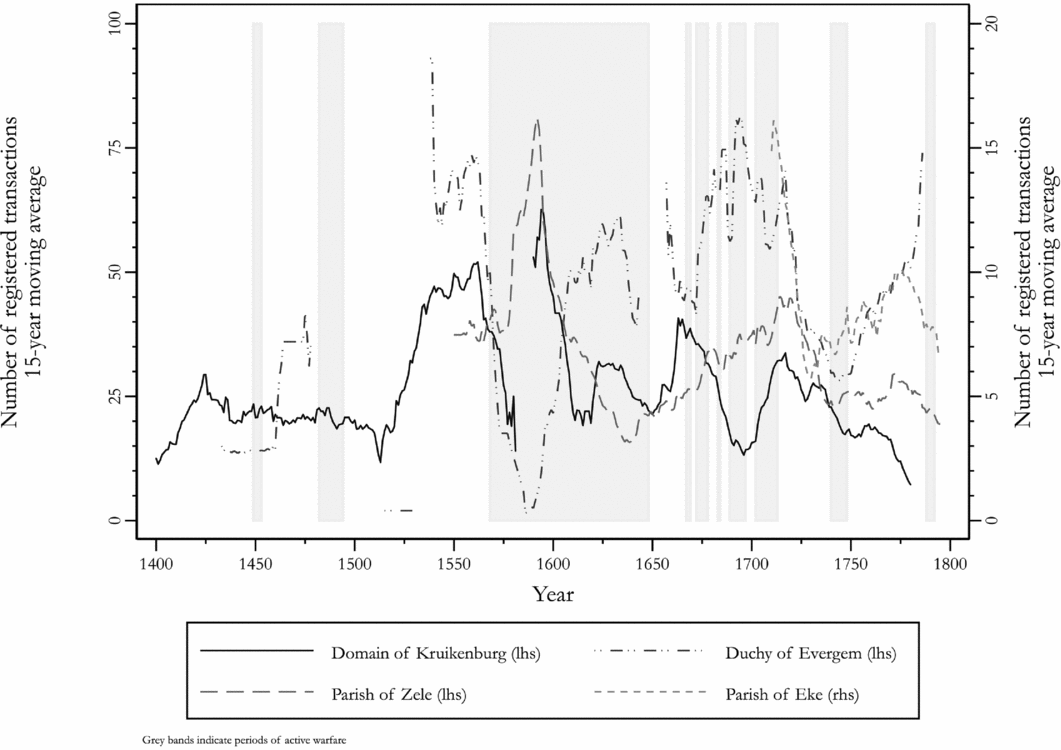
The number of registered land sales per year, collected through using either aldermen registers or manorial accounts, provides a good insight into general market activity. Rather than achieving a stable equilibrium general market activity (expressed in the number of sales per capita), composition of the type of plots sold or the transferred acreage, the early modern rural land market in the southern Low Countries did anything but that. As will be shown, market activity could differ substantially from year to year throughout the period under examination. On the one hand, this volatility might be partly explained by the nature of the sources used to compile these time-series data, as some under and over-registration from one year to the next cannot be excluded. On the other hand, as the ten-year moving average of the number of transferred plots suggests (Figure 2), the variability in the number of transactions reflects the fragile nature of the rural economy during the early modern period, wherein dearth, debt and death were just a failed harvest away.
Market activity in selected case studies.

Focusing on the number of registered land sales can serve to identify the key drivers of changing market activity. Three determinants will be examined more closely: economic growth and population pressure, the interplay between town and countryside and, finally, the impact of warfare. The four case studies point to three periods of lower or declining market activity throughout the early modern period: the fifteenth century, the first half of the seventeenth century, and the better part of the eighteenth century (1730–80) – for which the county of Evergem serves as an interesting exception. These three periods were bracketed by two periods of higher market activity, roughly from 1500 up until 1600 and from 1660 to about 1710, the latter corresponding to the economic revival of the sixteenth century and former to the French wars at the end of the seventeenth century, starting with the War of Devolution (1667–8) and ending with the War of the Spanish Succession (1702–13). The high market volatility, as indicated by the stark year-on-year changes in market activity, reflects the higher economic and social uncertainty during this period of sustained warfare.
Within the historiography of the Low Countries the second half of the fifteenth century is usually considered a period of economic downturn, marked by political strife and civil unrest. As a consequence of the process of state formation, the established relationship between city and the nascent state came under considerable pressure during this period particularly in the cities of Ghent, Bruges and Brussels (Haemers, Reference Haemers2009; Dumolyn, Reference Dumolyn2010; Dumolyn and Haemers, Reference Dumolyn and Haemers2005; Ryckbosch, Reference Ryckbosch2007). In both Flanders and Brabant, uprisings by specific interest groups were a common occurrence with severe clashes between opposing factions in 1449, 1459, 1467, 1477 and 1488. This coincided with a changing (economic) centre of gravity in the southern Low Countries – from Bruges to Antwerp – as the major European trade flows shifted from the south-west to the north-east. Both evolutions resulted in an unstable political and economic climate.
The first half of the sixteenth century stood in stark contrast with the second half of the fifteenth century. Fuelled by the political and economic privileges that Antwerp gained in the 1480s, Brabantine towns managed to develop spectacularly during the first half of the sixteenth century. As Antwerp's population tripled to approximately 90,000 souls in 1565 (Klep, Reference Klep1976: 154), a substantial regional network of market towns developed in Brabant during the fifteenth century. This urban growth had a profound impact on the surrounding countryside due to an expanding demand for agricultural produce as well as supply of (urban) capital. Hence the development of Antwerp and – albeit to a lesser extent – Brussels during the sixteenth century accelerated the commodification of land, labour and capital of the countryside in the western part of the southern Low Countries (Blondé, Reference Blondé1999; Ballaux and Blondé, Reference Ballaux and Blondé2007; Limberger, Reference Limberger, Schofield and Lambrecht2009; Limberger, Reference Limberger2008).
Corresponding to this general economic trend, market activity during the fifteenth century was rather low in the sample studied. In the domain of Kruikenbrug, on average twenty plots were sold around the middle of the fifteenth century. Towards the end of the century activity levels further dwindled, despite a modest population growth during the same period. This contrasts sharply with the sixteenth century, as activity levels peaked around the middle of the century with approximately fifty-five sales per annum. A similar picture emerges from the other localities. In the county of Evergem, on average fifteen plots were sold around the middle of the fifteenth century, as opposed to an average of seventy a century later. In the Land van Mechelen, the region nestled between Mechelen and Antwerp, a similar picture of low activity levels during the fifteenth century (approximately fifteen transactions during the final quarter of the fifteenth century) was followed by an sustained growth of sales (averaging forty-five sales a year) during the first half of the sixteenth century (De Vijlder, Reference De Vijlder2012).
As would be expected, warfare and military operations had a detrimental impact on market activity. Over time, a recurring pattern developed. At the first hint of looming trouble, transfers of land would cease to occur. As soon as the initial ‘shock’ had subsided, some three to four years after the first military actions in the region had taken place, renewed activity on the land market was visible. As a result, in most cases the long-term effect of warfare on the land market was rather limited. During the initial recovery phase a catch-up effect occurred, marked by significantly higher volumes combined with relatively stable prices (De Wever, Reference De Wever and Van Der Wee1978; De Reu et. al., Reference De Reu and De Vijlder2014). Before long, however, market activity reverted to its previous levels. Consequently, opportunities for large landowners to enlarge their holdings at bargain prices at the expense of smallholders or cottars were limited and the redistribution-effect of military unrest was small. Inequality indices for Evergem and Eke for example, showed little change before and after the consecutive military campaigns that swept through Ghent's countryside in the seventeenth and eighteenth century.Footnote 8 Neither the Revolt of Ghent (1449–53), the Flemish revolts against Maximilian of Austria, the Spanish-French conflicts during the late seventeenth century, nor the Spanish or Austrian wars of succession significantly altered the nature of the land market.
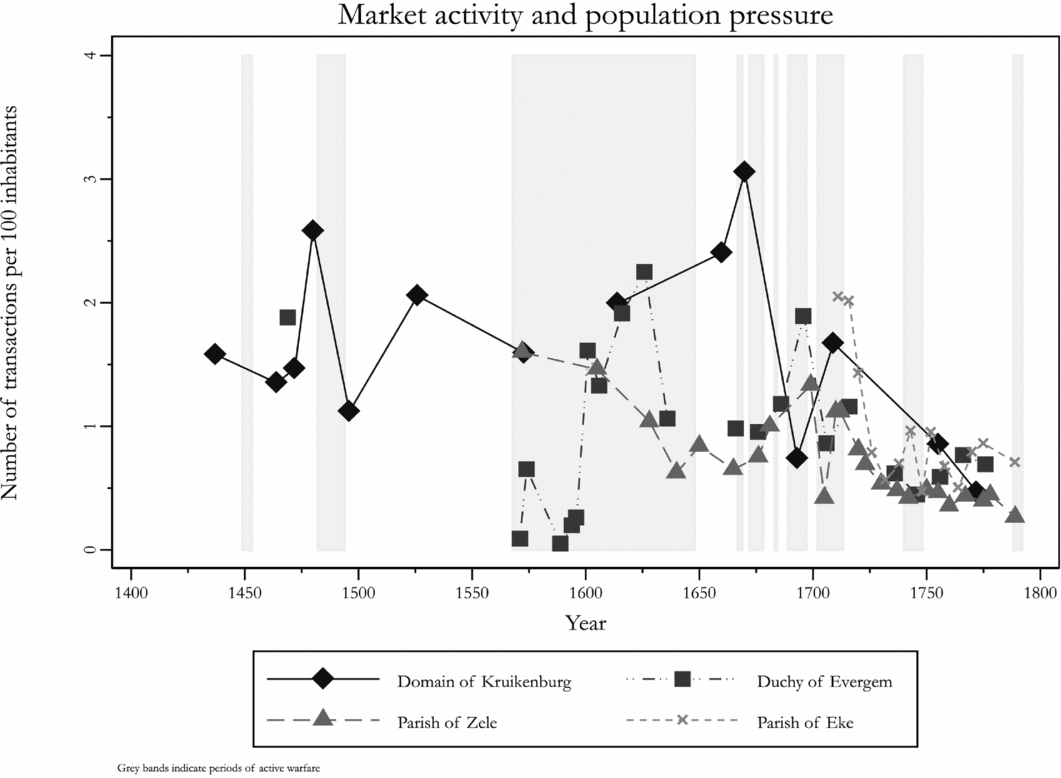
While in general the land markets in the southern Low Countries were quick to rebound even if armed operations persisted in the region, the first phase of the Eighty Years’ War as well as the French Revolutionary Wars are two notable exceptions to the rule. Due to the prolonged nature of the military activity during the first phase of the Eighty Years’ War (from 1568 up until the Twelve Years’ Truce in 1609), the initial phase of declining market activity was followed by a period of limited local demand due to the depopulation of the Flemish and Brabantine countryside. In the domain of Kruikenbrug, overall market activity was 32 per cent lower between 1566 and 1576 than during the preceding decade. In the parish of Zele, a similar market contraction (-35 per cent) was present during the first phase of the Dutch Revolt. However, depending on local circumstances the severity of the crisis could be substantially worse. The countryside to the north-west of Ghent had suffered greatly during the first phase of the Eighty Years’ War. Poaching raids by both Spanish and Flemish troops between 1570 and 1575 as well as frequent incursions by Geuzen into the north-west of the county of Flanders had a devastating effect on the socio-economic fabric of the countryside (Thoen, Reference Thoen1978; De Kraker, Reference de Kraker2006; Vermeir and Prevenier, Reference Prevenier, Vermeir, Prevenier and Van Eenoo2003). Farms were burned to the ground, harvests were requisitioned and the population declined steadily (Piceu, 2008). Unsurprisingly, the market activity in the county of Evergem declined by over 75 per cent during the first decade of the Revolt. Only by the end of the sixteenth century market activity was again on a par with previous levels (Figure 2). However, this rebound materialised in a very different demographic setting. As people had left and land was abundantly available, activity levels per capita spiked (Figure 3). During this period, a significant influx of urban capital to the surrounding countryside can be noted. In South Brabant for example, noblemen, burghers and artisans from Brussels bought up substantial amounts of land (Daelemans, Reference Daelemans, Janssens, Janssens, Scholliers, Van den Wijngaert, Van Hemelryck and Peeters1989). For example, in 1586 Karel Fourneau, lord of Kruikenburg since 1562 though permanently resident in Brussels, bought 1.4 hectares of wet meadows in Ternat from the Brussels’ hospice (Scheelings, Reference Scheelings, Craeybeckxs and Daelemans1988).
Market activity per capita.

As a result of the persistent guerrilla tactics of the Geuzen and the military retribution of the Spanish troops overall activity levels slumped even lower, to ten sales per year (as opposed to an average of sixty-seven half a century earlier). Consequently, the market for rural property in the surroundings of Ghent did not fully recuperate from the sixteenth-century crisis until the first decade of the seventeenth century. Whereas the number of transactions remained fairly stable in the county of Evergem and the domain of Kruikenburg, the number of sales in Zele declined steadily during the first half of the seventeenth century. Here, contrary to Evergem and Kruikenburg, as a consequence of the take-off of local flax cultivation the rural population expanded from 2,000 to 3,000 inhabitants during the first half of the seventeenth century (De Wever, Reference De Wever and Van Der Wee1978). As land became increasingly scarce, fewer plots were transferred through the market, to the benefit of alternative inter-family land transfers (for example, inheritance).
The start of the War of Devolution (1667) heralded a new period of political and economic uncertainty. As consecutive wars demanded more taxes and the troops of Louis XIV plundered and ransacked Flemish and Brabantine villages, the rising economic and demographic trend of the first half of the seventeenth century levelled off. Yet the overall impact on market activity was not as marked as during the sixteenth-century crisis. Unlike the first decades of the Eighty Years’ War, when the land market came to a complete halt across Flanders and Brabant, the market in Flanders quickly rebounded in the periods between the subsequent military conflicts. In the domain of Kruikenburg, however, a consistently downward trend can be discerned. The number of transactions bottomed out around the end of the seventeenth century. As Marshal Villeroy reduced Brussels to ashes during the bombardment of August 1695 and pillaged the Brabantine countryside during the final stages of the Nine Years’ War, harvests were ruined and land was abandoned altogether, resulting in a standstill in the rural land market. The latter also explains the sharp rise in activity levels in the domain of Kruikenburg around the start of the eighteenth century, as a stock of unsold and abandoned property found its way to the market. By the mid-eighteenth century the Southern Netherlands provided the backdrop to several military operations part of the War of the Austrian Succession (1740–8). As an alliance of Dutch, Austrian and English troops tried to curb the expansionist tendencies of the French Crown, the countryside had once more to support increased fiscal pressure as well as military requisitions of food, equipment and services. However, the impact is strongly differentiated across the four localities. Those situated nearest to substantial cities (Eke, Evergem and the domain of Kruikenburg) suffered noticeably more from the French invasion than the parish of Zele, which was located further away from strategically important towns. In the latter, the impact was virtually non-existent. In the former localities, however, sale volumes declined between 20 and 50 per cent. In the localities surrounding Ghent, the years 1745 and 1747 proved especially detrimental as these years can be associated with the start of the French occupation (Ghent fell into French hands during the spring of 1745) and the allied counteroffensive (Janssens, Reference Janssens, Blom and Lamberts2006: 231). For the land market in South Brabant, the low point was 1746 when, during the French Siege of Brussels, only seven plots changed hands.
Notwithstanding the odd temporary divergence, between the fifteenth and middle of the eighteenth centuries the general trend in market activity was comparable across Flanders and Brabant. The economic boom of the sixteenth century pushed market activity to new heights, followed by a sharp decline as the Eighty Years’ War broke out. The seventeenth century was characterised by a marked rebound in activity levels as a stock of unsold land found its way to the market, followed by a generally upward movement in activity levels during the late seventeenth century. Exception to this general trend is southern Brabant, which suffered significant hardship because of the French invasion, with a detrimental impact on the land market. From the middle of the eighteenth century, however, a disparity in market activity emerges between Evergem, Eke and Zele and Kruikenburg. In Eke and Zele land sales stagnated, despite very substantial population growth in both localities, implying declining per capita market participation (Figure 3). Both localities were located in the heartland of Flemish husbandry, whereby an increasingly larger rural population could only be sustained by the high arable yields as a result of increasing labour input on progressively smaller plots of land. Within such a socio-economic environment, scarcity would drive up prices while the acreage of the average functional farm declined. As a consequence, land would increasingly be transferred through channels such as inheritance and inter-vivos endowment and thus excluded from the sources. A short- to mid-term surplus of land within the farm was leased out rather than sold, since the availability of suitable plots in the future was uncertain. Likewise, after an inheritance the possibility to ‘trade up’ – for example, buy a better plot of land in the near future – was limited. In the aftermath of the War of the Austrian Succession, as soon as the land market had compensated for the postponement of land transfers during the war, land sales in the domain of Kruikenburg continued the downward trend that started around the end of the Spanish War of Succession, despite a modest population growth. In the duchy of Brabant, unlike in Flanders, the ‘agricultural revolution’ was less notable. It only started in the final quarter of the eighteenth century and was subdued relatively quickly as a consequence of renewed political unrest in the final decade of the Ancien Régime. Consequently, agricultural rents as well as market participation in Brabant had limited upward tendencies during the eighteenth century. Despite the rich loamy soil in South Brabant being ideally suited for hops (Blondé, Reference Blondé1999), the ensuing boom in hop cultivation did not translate into an increased market activity. Due to the capital-intensive nature of this crop (stakes, fertilisation, etc.), these plots were almost never transferred through the market; rather they were considered the cornerstone of the family's holdings and thus primarily transferred through inheritance (De Vijlder, Reference De Vijlder2012). Finally, in Evergem, the number of annual transactions followed a strong upward trend from the mid-eighteenth century onwards. Despite the positive trend, per capita activity levels declined. One of the main drivers of the increased number of transactions was the locality's proximity to Ghent. As urban investment opportunities became scarcer, certainly after Ghent's default in the 1750s, burghers again looked to the surrounding countryside for potential investments (Coppejans-Desmedt, Reference Coppejans-Desmedt1952; Lenders, Reference Lenders and De Smedt1988). As rural population growth in Flanders drove up agricultural rents combined with potentially higher future land prices arising from increasing population pressure, land became increasingly interesting from an investment perspective.
Between the early fifteenth and late eighteenth centuries, general activity on the land market in Flanders and Brabant fluctuated significantly. The general economic climate, intermittent military activity and demographic pressures were key drivers of the rural land market. The first half of the seventeenth century can be considered a tipping point. As Flemish husbandry developed, per capita activity levels dwindled across all four case studies. Given the rising demand and constrained supply, a self-sustaining process of declining market participation developed. Owners would only be inclined to part with their land in exceptional circumstances as it was uncertain whether an adequate type of property would be available for sale in the future. Consequently, the question arises to what extent the ‘nature’ of the land market was altered.
Composition and size of transferred land
Our attention now turns to the characteristics of the properties that were being transferred on the market. Was some property more or less likely to be transferred through the market and how did the changing socio-economic structure impact the nature of the land market? Finally, to what extent was the land market itself a driver for socio-economic change? The domain of Kruikenburg, the county of Evergem and the parish of Eke will serve as case studies. From as early as the fifteenth century, the rural land market in the southern Low Countries was fully developed; most plots were sold through the market and the price differentials between types of property reflected the quality of the land being transferred. As the number of transactions per capita declined, the role and position of the land market itself transformed. As will be shown below, up until the middle of the sixteenth century, the land market was dominated by the transmission of small single plots (relative to the average farm size) in response to short-to-medium term abundance/shortage of land. As the per capita available stock of land diminished, short-term shocks in the demand for land at the farm level were absorbed by an increasingly well-developed lease market. Within this context, the transmission of ‘complex holdings’ (for example, multiple plots of land and/or complete farms) came to the fore.
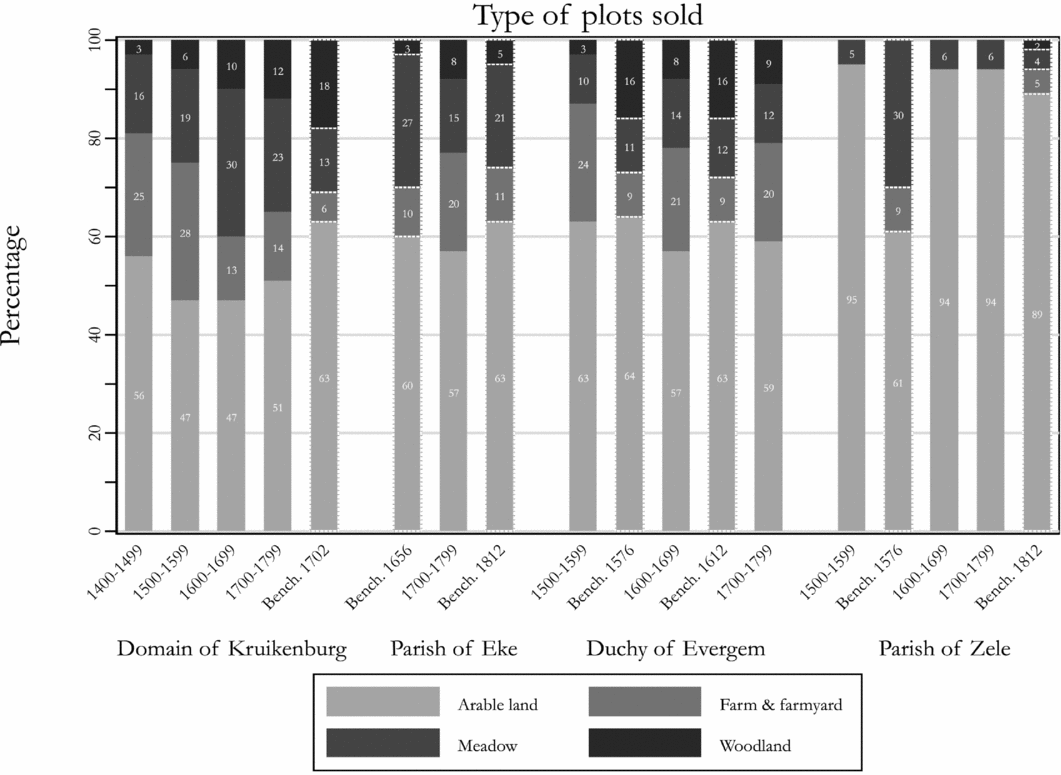
A breakdown of the types of plots transferred through the market as well as a cross-sectional view of land usage at specific moments in time within each locality is presented in Figure 4. In a market with an elastic supply curve that is unconstrained by market participants’ preferences (for example, no preferences of both buyers and sellers for specific types of property and no income constraints), the number of transactions of each type of property should reflect their relative prevalence within each locality. Likewise, a deviation thereof implies the opposite; either a purchaser preference, an inelastic supply curve or a combination thereof. Note that these percentages reflect the number of sales related to a specific type of property rather than the relative acreage that was being transferred (as a result of source limitations for the earlier periods). Given the parallels in socio-economic structure as well as population pressure (see supra), land usage across the case studies is quite similar.
Types of plots sold.

Throughout the early modern period, at any one time at least 60 per cent of each locality was covered in arable land. Buildings (farms and others) as well as farmyards occupied between 6 and 10 per cent of the surface. The remainder was split between woodland and meadow, ranging respectively from 1–18 and 11–30 per cent of the surface. While the ratio between meadow and arable land was initially dependent on geographical factors, its subsequent evolution was largely driven by socio-economic (demographic) factors. Due to its location (no major waterways traversed the domain), ‘wet’ meadows suitable for arable farming were limited in Kruikenburg, certainly in contrast with Zele and Eke, both situated along the banks of the River Scheldt in the flatlands of Inland Flanders. However, especially during the eighteenth century meadows in both Eke and Zele were converted into arable land in order to sustain the significant increase in population. The limited presence of woodland is not at all surprising since by the end of the sixteenth century the southern Low Countries were, with an average coverage ratio of 10 per cent, among the least forested regions in Europe (Warde, Reference Warde2006; Berghmans and De Vijlder, Reference Berghmans and De Vijlder2014). As a whole, the findings of the case studies corroborate the general trend. While Zele, as the most densely populated of the case studies, had virtually no woodland by the middle of the sixteenth century, Eke and the county of Evergem did not fare much better, with woodland reduced to a few scattered parcels. By the mid-eighteenth century, Sleidinge-St Bavo had approximately seventy-one plots of woodland, representing 83.82 hectares (Notteboom, Reference Notteboom, Notteboom, Neyt and De Wildeman2006). The domain of Kruikenburg, on the other hand, was substantially forested, though nearly half of it was an integral part of the manorial domain (Verbesselt, Reference Verbesselt1986; Van Eeckhoudt, 1981; Vermeulen and Blys, Reference Vermeulen and Bleys2011).Footnote 9
As a result of relatively high population pressure from as early as 1400, farm sales were very prevalent on the rural land market, making up between an eighth and a quarter of all transactions. Especially during the fifteenth and sixteenth centuries, the high number of transfers of farms can be related to the high degree of social mobility that characterised the countryside of Brabant and Flanders (Dombrecht, Reference Dombrecht2014). During the seventeenth and eighteenth centuries, a noticeable decline in transferred farms can be recorded for Kruikenburg, an evolution that did not occur in Evergem or Eke. While all three localities were confronted with significant population growth and a corresponding decline in per capita land transfers, this divergence is remarkable. While the supply and demand for farms remained constant relative to other types of property in Inland Flanders, this was not the case in Brabant. Here, supply decreased relative to arable land and meadows. Further research, in particular into family structure and the role of the nuclear family in both regions, is necessary to explain these variances. A possible explanation could be found in a differentiated response to the increasing population pressure. Whereas in Inland Flanders the traditional nuclear family persisted, and the increased demand was met by further subdividing the existing farms, other processes might have developed in South Brabant.
With respect to meadows a mixed picture emerges, largely depending on its relative prevalence within the respective case studies. In Kruikenburg and Evergem, despite their relative scarcity, meadows frequently changed hands, especially during the seventeenth century. As the average sale of meadow was not substantially smaller than arable land (Figure 5) this suggests that meadows were (as a result of their relative scarcity) being used as (speculative) investments that changed hands regularly. In Zele and Eke, on the other hand, meadows were relatively abundant yet hardly found their way to the land market. As a result of the higher population pressure, meadows were increasingly converted into arable land for the better part of the seventeenth and eighteenth centuries. Much like meadows, woodlands served as a store of wealth. During the eighteenth century, the occurrence of woodland sales surpassed their weight in terms of land usages within the case study of Eke. In Evergem and Kruikenburg, a similar increase in the number of transactions during the seventeenth and eighteenth centuries can be noted. In the Brussels countryside, woodland sales doubled between the sixteenth and the eighteenth centuries. Discounting for the manorial ownership of half of the wooded area (which was hardly ever sold) the increase in woodland-related sales is impressive. In Evergem, likewise, sales related to forests tripled during the same period.
Distribution plot of transferred acreage per sale.

Commercialisation rate.

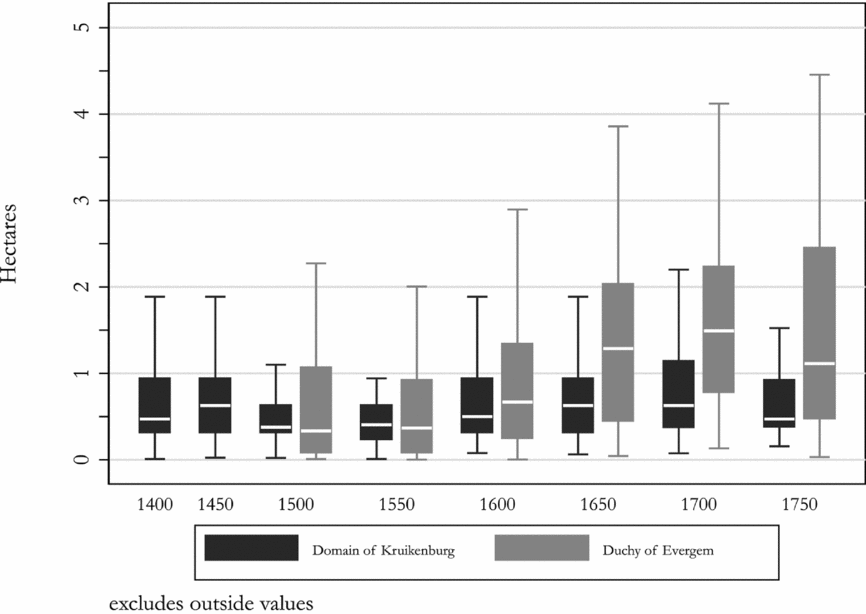
The receipts of conveyance tax not only gave qualitative information on the land that was sold, but also specified the acreage of the plot. By analysing the breakdown of the transferred acreage throughout the sixteenth and eighteenth centuries, the gradually changing nature of the land market in Brabant and Inland Flanders once again comes to the fore. As can be seen in Figure 5 the average acreage of land transferred within a single sale was substantially smaller in Kruikenburg than in Evergem, especially from the seventeenth century onwards. Comparing the fifteenth and sixteenth centuries in the domain of Kruikenburg, shows the impact of renewed rural prosperity after the political unrest of the late fifteenth century. As the population gradually recovered, the growing demand for land was met by a steady increase in market activity and by splitting up existing plots. Consequently, the size of the average sale declined by 20 per cent from 0.81 to 0.66 hectares. Other areas of the southern Low Countries show a similar trend in response to the late fifteenth and early sixteenth centuries’ population growth. In the Campine area west of Antwerp (Gierle) the average acreage transferred declined by about 50 per cent, from 1.6 ha in the final quarter of the fifteenth century to 0.8 ha by 1550 (Van Onacker, Reference Van Onacker2013: 51).
As the market recovered from the socio-economic and political crisis of the final quarter of the sixteenth century its dynamics had changed profoundly. The dynamic between population growth and an increased frequency of gradually smaller plots being transferred on the land market stalls. As highlighted earlier, activity levels on the land market did not keep pace with population growth, nor can a continuing decline in transferred acreage be observed. As can be seen in Figure 5, the overall distribution as well as the average transferred acreage per sale gradually increases as of the sixteenth century, especially in the duchy of Evergem. This evolution is driven by the significant increase in complex, multi-plot transactions. Whereas the average transaction of arable land during the sixteenth century fluctuated between 0.67 and 0.97 hectares in Kruikenburg and Evergem respectively, by the eighteenth century, these averages had risen by 46 and 57 per cent to 0.98 and 1.53 hectares. The sales of meadows and woodland were especially characterised by a strong increase in the average transaction size. As the seventeenth-century timber shortage drove up prices for building and for firewood across Europe, the impact could be felt immediately on the land market (Coppieters, Reference Coppieters1991; Vandenbroeke, Reference Van den Broecke1995; Warde, Reference Warde2006; Berghmans and De Vijlder, Reference Berghmans and De Vijlder2014). Transfers of woodland, traditionally larger than other land types, significantly increased in square footage towards the end of the early modern period. Given their relative scarcity in the overall forest-poor Flanders and Brabant, these plots became prized possessions for those seeking to invest money in the rural land market. By the middle of the eighteenth century, burghers from nearby Ghent owned most of the woodland in the county of Evergem.Footnote 10 Furthermore, data for the parish of Eke show that predominantly older buyers (>50 years) bought woodland as a store of wealth for future generations and a means to enlarge the family's patrimony (Wieme, Reference Wieme2005). In Kruikenburg, the average transferred surface of meadow increased by 62 per cent between the fourteenth and eighteenth centuries, while in Evergem the average transferred acreage increased fourfold.
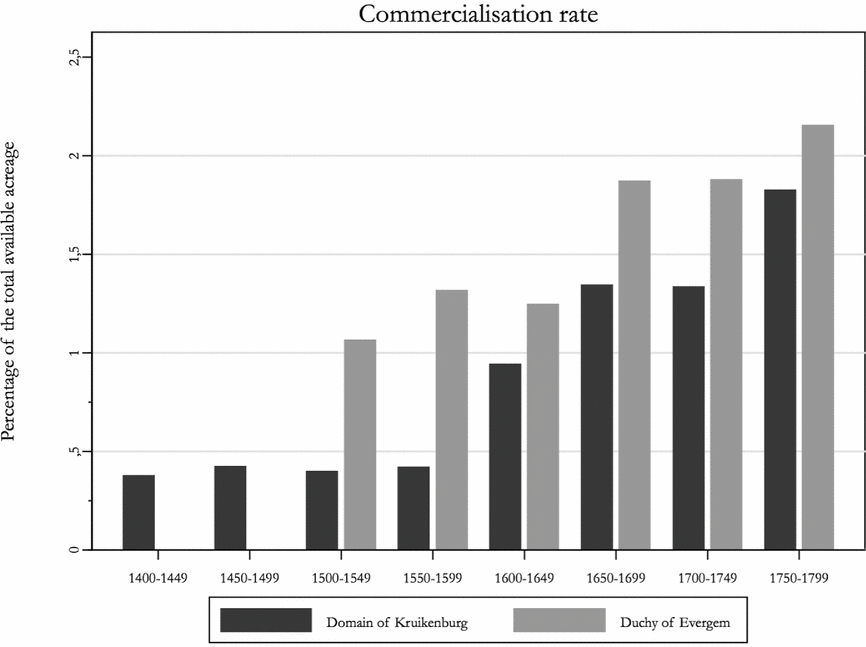
Gradually, changes in demand for land at the level of the farm were being met through a mature lease market rather than the land market. This development fundamentally changed the nature of the rural land market. The increase in the number of transactions pertaining to multiple plots of land illustrates this transition. Both in Evergem and Kruikenburg, sales comprising multiple plots, either a combination of arable land and meadows or completely functional entities (including farm buildings), accounted for no more than 5 per cent of the transactions during the fourteenth and fifteenth centuries. By the middle of the eighteenth century, 29 and 53 per cent of all transactions in Kruikenburg and Evergem, respectively, concerned more than one property. Similarly, in nearby Eke just over 39 per cent of all registered sales between 1740–60 involved multiple parcels.Footnote 11 As the total number of recorded sales did not decline substantially, the rise in multiple plot transactions was the result of an absolute rather than a relative rise in multi-plot transfers. This transition from a ‘peasant’ land market defined by a limited yearly turnover of predominately small single plots (Van Onacker, Reference Van Onacker2013) to a commercially oriented land market is illustrated by the evolution of the commercialisation rate. This measure expresses the acreage sold in a single year as a percentage of the total available acreage. During the fifteenth century and early sixteenth century, approximately 0.4 per cent of total available acreage changed hands on a yearly basis in Kruikenburg. This is substantially lower than in Evergem, which by the middle of the sixteenth century was already confronted with much higher turnover rates, probably as a result of the vicinity to Ghent. During the seventeenth and eighteenth centuries, as a result of the aforementioned shift between single and multi-plot sales, the level of commercialisation in both regions sored. Not the least in Kruikenburg, which reached levels at par with Evergem thanks to the influx of capital from the Brussels bourgeoisie. By means of comparison: by the middle of the sixteenth century the highly commercialised Gelderland region in the Northern Low Countries had a commercialisation rate of about 2 per cent (Van Bavel, Reference Van Bavel2004) as opposed to a turnover ratio of 0.9 per cent in the (peasant-dominated) Campine area to the south-east of Antwerp (Van Onacker, Reference Van Onacker2013).
As the proportion of cottars and smallholdings (farms smaller than three hectares) in Inland Flanders and Brabant rose considerably between 1400 and 1800 (in Evergem, for example, from 24.8 per cent in 1587 to 76.26 per cent in 1790) a substantial share of the rural society was a priori excluded from the rural land market. Therefore, the traditional role of the rural land market had been altered. Whereas market structures of the fifteenth and sixteenth centuries enabled the transfer of single plots of land in response to the changing supply of labour within the family, these single-plot transactions became less frequent during the seventeenth and, especially, eighteenth centuries. As competition grew, the availability of the smallest plots declined. Thus, the lease market increasingly catered to the previously lower echelons of the land market. Consequently, an increasing part of the rural population was much more exposed to the forces of supply and demand. When real lease prices rose, a detrimental process of increased labour input on ever-decreasing parcels ensued (Thoen, Reference Thoen, Hoppenbrouwers, Thoen and van Bavel2004). Furthermore, as multi-plot transfers increasingly dominated the land market – transactions frequently entailing completely functioning entities comprising farm buildings, meadows and arable land – it became increasingly difficult to establish new farms without seed capital due to the high initial purchase costs. Consequently, aspiring farmers postponed their decisions and worked as day-labourers or farmhands before establishing a household (Lambrecht, Reference Lambrecht2003; Lambrecht, 2015). Furthermore, part of the parents’ farm was often split up among the children to enable them to start their own households. In the long run these two processes facilitated a pauperisation process already established by massive population growth in combination with the continuing dependence on a fixed amount of arable land.
Conclusion
My findings show that between 1400 and 1800 the nature of the rural land market in Inland Flanders and Brabant changed dramatically. Across the different case studies, two distinct periods of accelerated activity on the land market could be observed: the sixteenth century up until the outbreak of the Eighty Years’ War and from the end of the Eighty Years’ War to the end of the seventeenth century. During these periods, more land was being transferred through the market. However, when discounting for the increased population pressure, I observed that per capita land sales showed a declining trend, an evolution that found its parallel in the declining average farm size. In the county of Evergem, for example, the percentage of cottars rose from 50 to 80 per cent between the mid-sixteenth and late eighteenth centuries. In contrast to the average farm size and the declining per capita activity levels, the average transaction size increased significantly within this timeframe. In both the county of Evergem and the domain of Kruikenburg, the average transaction of arable land increased by 70 and 34 per cent, respectively, between 1500 and 1800.
Three possible drivers for these changes were highlighted: demographic evolutions, urban demand (both for investment and foodstuffs) and warfare. Research shows that, ultimately, population density can be considered the main driver of market activity. Already by the fifteenth and sixteenth centuries, the population density in rural Flanders and Brabant was substantial compared to other regions in continental Europe. During the late seventeenth and eighteenth centuries, especially in Inland Flanders and to a lesser extent in Brabant (bar the Campine region), the number of inhabitants rose even further, significantly decreasing average farm sizes. As a result hereof, the role of the land market within the rural economy changed dramatically. Increasingly, it was used to transfer substantial amounts of property (often comprising multiple plots and farm buildings) whereas the transmission of smaller plots declined in importance. Over the course of the early modern period, incremental changes in the supply of and demand for land at the farm level (that is, increased demand for a single plot) were increasingly absorbed by the strongly developing leasehold market. The tendency towards larger entities being transferred on the land market, furthermore, accelerated a process of rising inequality and pauperisation. As it became more difficult/expensive for would-be farmers to lay their hands on a suitable property, many postponed their intentions and worked as farmhands or maids to save up. The relative lack of small plots being transferred also worked as a substantial barrier, prohibiting smallholders from increasing their holdings and pushing them towards the lease market.
Throughout the early modern period, the rural population frequently had to cope with military operations, looting and crop destruction. In reconstructing market activity, remarkably similarities across the case studies can be observed. During the initial phase of each military conflict transactions ground to a halt. Purchases were postponed until the uncertainty was over. Usually, within four to five years after the outbreak of disturbances, sales rebounded with an initial phase of extraordinary activity, during which an unsold stock of land found its way to the market, followed by a return to the previous equilibrium. The prolonged military activity of the Eighty Years’ War was the only exception to this rule.
On the local level, the impact of urban demand and growth on their immediate surroundings was impressive. Besides the growing importance of urban landownership in the countryside either as a store of value, outright investment or an inclination to aspire a nobler status, urban consumer demand also helped to shape the structure of the countryside. For example, throughout the fifteenth and early sixteenth centuries, the types of holdings that were transferred in the domain of Kruikenburg differed. Around the start of the fifteenth century, plain arable land and farmsteads were the two most frequently sold assets. Three quarters of all transactions entailed the sale of these types of property. By the middle of the sixteenth century, however, ‘plain’ land and farmsteads declined in relative importance, to the benefit of farmyards, woodland, heath, wet meadows, orchards and even one or two hop-gardens, each having substantially different price points. This differentiation in the land market hints at a diversification of the agricultural uses of land, in tandem with a growing demand for foodstuffs, construction and firewood from nearby Brussels. Moreover, the more expensive plots, hop-gardens and (wet) meadows, were less prone to changing hands through market-exchange, indicating the crucial role these plots played in the transmission of wealth down through the generations. Similarly, an upsurge in the transfer of woodland can be seen in the late seventeenth and eighteenth centuries as a consequence of the ‘timber famine’.
To conclude, both endogenous and exogenous shocks (that is, rural and urban population pressure, fluctuating urban demand, and political and military unrest) had a profound impact on the land market in Brabant and Inland Flanders. Rural demographic growth and the following increase in labour supply pushed up the demand for farms and farmland. Demand from urban investors (and their increased sophistication) led to an upsurge in multi-plot transactions, crowding out small farmers in the process. The lease market served as an escape valve but exposed them to significant price fluctuations. While these changes manifested themselves very slowly on the rural land market, in the long run they fundamentally altered rural socio-economic practice as the so-called Flemish husbandry came into development. Whereas during the fifteenth and sixteenth centuries participation in the rural land market was used as a mechanism to absorb short-term fluctuations in demand for land at the farm level, this role was taken over by the strong development of the leasehold market. By the eighteenth century, the land market was increasingly used to transfer completely functional entities. As a consequence, the increased demand and limited stock of land created an increasingly illiquid market dominated by bigger and more expensive transactions. This accelerated a process of pauperisation and inequality. Aspiring farmers postponed their decisions and worked as farmhands or maids for longer periods of time than previously. Fewer and fewer farmers were able to buy land, making them dependent on leasing to enlarge their holdings. Whereas in the long run the nature and role of the land market changed as a result of increased population pressure, by the late seventeenth century a feedback loop had been created, intensifying the general trend towards pauperisation in Inland Flanders during the eighteenth century.
Acknowledgements
The author would like to thank Michael Limberger for support and guidance in writing the article, as well as the anonymous referees for their comments, which greatly improved the manuscript.