Introduction
Odonatoptera is one of the oldest groups of winged insects, with a very diverse record that includes several orders, four of them appearing in the lower Carboniferous (325 Ma, Petrulevičius and Gutiérrez, Reference Petrulevičius and Gutiérrez2016). Odonata is the only order of Odonatoptera that persists today and represents one of the most charismatic groups of insects. It has an estimated 6,042 living species and some 608 extinct species (Zhang, Reference Zhang and Zhang2013).
The odonatans are insects linked to the aquatic environment, where their immature stages develop. At the time of reproduction, sexually active Odonata gather in or around water bodies to mate and lay their eggs. There are two oviposition strategies in this group: endophytic and exophytic (Corbet, Reference Corbet1980). The endophytic behavior occurs in species with well-developed ovipositors with which they insert their eggs inside the plant tissues. This strategy occurs in all extant families of Zygoptera, in Epiophlebioptera, Epiophlebiidae, and in some families of Anisoptera such as Aeshnidae (Lucas, Reference Lucas1900; Asahina, Reference Asahina1934; Corbet, Reference Corbet1962). It also occurs among other modern insect groups such as Orthoptera, Hemiptera, Coleoptera, Lepidoptera, and Hymenoptera (Wesenberg-Lund, Reference Wesenberg-Lund1913, Reference Wesenberg-Lund1943; Hinton, Reference Hinton1981; Zeh et al., Reference Zeh, Zeh and Smith1989; Zherikhin, Reference Zherikhin, Rasnitsyn and Quicke2002; Krassilov et al., Reference Krassilov, Silantieva, Hellmund and Hellmund2007). Among the extinct odonatopterans with this strategy, we can cite Argentinoptera (Petrulevičius and Gutiérrez, Reference Petrulevičius and Gutiérrez2016). The rest of the Odonata lay eggs by exophytic behavior, in which the females lack a well-developed ovipositor and release the eggs in the water or deposit them on the surface of periaquatic objects. The females that have an exophytic behavior produce ovoid-rounded eggs while the eggs of the endophytic females are elliptical-elongated.
After mating, females with an endophytic behavior, sometimes in tandem with the male, select a plant substrate to place their eggs. For this, the female contacts the substrate with its ovipositor, located at the end of the abdomen. The ovipositor has cutting shells to lacerate the plant tissue, generating a cavity where the egg is inserted. Between each egg deposition, the female can rotate the abdomen and relocate the ovipositor to a new site, repeating the process. In addition, females may walk a few steps on the substrate to reach different sectors and repeat the process systematically until the egg deposition is finished (Matushkina and Lambret, Reference Matushkina and Lambret2011). At the time of piercing, the female can bend the abdomen so that the tip of the ovipositor rests between its middle and hind legs (Matushkina and Gorb, Reference Matushkina and Gorb2000). Endophytic oviposition may take place in live or dead plant substrates (Martens, Reference Martens2001; Petrulevičius et al., Reference Petrulevičius, Wappler, Nel and Rust2011). Fossil leaves that show tissue reactions associated with the lesions are interpreted to be alive at the time of oviposition (Pott et al., Reference Pott, Labandeira, Krings and Kerp2008; Sarzetti et al., Reference Sarzetti, Labandeira, Muzón, Wilf, Cúneo, Johnson and Genise2009; Petrulevičius, Reference Petrulevičius2013). The findings of fossil endophytic eggs since the Cenozoic are relatively frequent, being the most revealing vestiges of plant–insect associations in the paleontological record (Petrulevičius et al., Reference Petrulevičius, Wappler, Nel and Rust2011).
Evidence of oviposition in fossil leaves is known from the Paleozoic (e.g., Adami-Rodrigues et al., Reference Adami-Rodrigues, Iannuzzi and Pinto2004; Béthoux et al., Reference Béthoux, Galtier and Nel2004; Laaß and Hoff, Reference Laaß and Hoff2015) to the Cenozoic. Fossil traces of egg insertion in leaf tissues are externally manifested by the presence of scars generated in response to the injury produced by the ovipositor apparatus (e.g., Peñalver and Delclòs, Reference Peñalver and Delclòs2004; Vasilenko, Reference Vasilenko2005; Sarzetti et al., Reference Sarzetti, Labandeira, Muzón, Wilf, Cúneo, Johnson and Genise2009; Petrulevičius et al., Reference Petrulevičius, Wappler, Nel and Rust2011; Moisan et al., Reference Moisan, Labandeira, Matushkina, Wappler, Voigt and Kerp2012), and fossilized eggs are only rarely preserved (Pott et al., Reference Pott, Labandeira, Krings and Kerp2008). These scars are generally oval (Labandeira et al., Reference Labandeira, Johnson and Lang2002; Zherikhin, Reference Zherikhin, Rasnitsyn and Quicke2002; Béthoux et al., Reference Béthoux, Galtier and Nel2004; Moisan et al., Reference Moisan, Labandeira, Matushkina, Wappler, Voigt and Kerp2012; Petrulevičius, Reference Petrulevičius2013) and are commonly arranged on the leaf following a certain pattern.
Vasilenko (Reference Vasilenko2005) proposed an ichnotaxonomic record to include traces of oviposition, establishing the ichnogenus Paleoovoidus. The Paleoovoidus ichnogenus is characterized by having medium-sized, elongated, narrow, ovoid or lens-shaped structures, with a regular arrangement in the leaf lamina. These structures, defined by dark, surrounding reaction tissue, are narrow at one end, and each often bears a dark spot (definition proposed by Vasilenko, Reference Vasilenko2005 and redefined by Sarzetti et al., Reference Sarzetti, Labandeira, Muzón, Wilf, Cúneo, Johnson and Genise2009). This ichnogenus currently has more than a dozen species (Gnaedinger et al., Reference Gnaedinger, Adami-Rodrigues and Gallego2014). Depending on the oviposition pattern followed by the traces, they are classified among others in Paleoovoidus rectus Vasilenko, Reference Vasilenko2005 (if the traces follow a linear pattern) and Paleoovoidus arcuatus (Krassilov, Reference Krassilov, Silantieva, Krassilov and Rasnitsyn2008) (if they follow a curved or zigzag pattern).
The quantification of the shape is an important aspect in many of the paleontological studies. The first approaches to the study of forms were developed from indices derived from simple linear measurements as length and width of structures, which give a relationship between linear dimensions, providing a reference of the proportions although not of the shape. Traditional morphometrics relied on measures of linear distances such as length and width, and sometimes ratios and angles, and patterns of shape variation can be described by using multivariate statistical tools. However, one of the main disadvantages of this approach is that different shapes can produce equal results because no information is included on the relative locations of the measurements. By contrast, geometric morphometrics captures the geometry of the organism (Adams et al., Reference Adams, Rohlf and Slice2004).
Geometric morphometrics analyzes changes in shape as a function of the relative positions of a series of homologous morphometrics points (landmarks). There are different approaches, which can be generally grouped as based on landmarks or based on boundaries. In cases where it is difficult to establish homologous points (as would be the case with egg traces), the shape of a structure can be captured by means of the coordinates of the sequence of points that define its contour. There are different methods to adjust a mathematical function to the sequence of points that define an outline and then to use the parameters of the adjustment function as descriptive variables in multivariate analysis. Although there are numerous techniques for describing closed contours (for a review of them, see Rohlf, Reference Rohlf, Rohlf and Bookstein1990; Crampton, Reference Crampton1995; Swiderski et al., Reference Swiderski, Zelditch, Fink, MacLeod and Forey2002), usually some of the variants of Fourier analysis are used. In general, this technique consists of analyzing the contribution of the coefficients of a trigonometric function that reproduces a certain curve as accurately as possible. The more terms (harmonics) are added to the function, the better is the adjustment of the curve. Then the Fourier analysis coefficients become descriptors of the shape of said curve that can be compared with the corresponding coefficients of other curves by means of several multivariate statistics techniques. There are different methods to analyze the variation in the shape of the contours using the Fourier technique (Rohlf and Archie, Reference Rohlf and Archie1984; Foote, Reference Foote1989; Rohlf, Reference Rohlf, Rohlf and Bookstein1990; Temple, Reference Temple1992), but among them, the most used are the Fourier analysis expressed in polar coordinates and the elliptical Fourier analysis.
The Fourier shape analysis has been used in studies where it was applied to several groups of extant and fossil plant and animal organisms (e.g., Christopher and Waters, Reference Christopher and Waters1974; Rohlf and Archie, Reference Rohlf and Archie1984; White et al., Reference White, Prentice and Verwijst1988; Renaud et al., Reference Renaud, Michaux, Jaeger and Auffray1996). While in paleontology numerous works have contributed data on traces, to the best of our knowledge no previous studies have used the method of Fourier analysis to describe egg fossil traces. In most cases, traces reports have been qualitative descriptions based on linear dimensions (length and width) or using geometric morphometrics with landmarks (e.g., coleopteran fossil pupation chambers; Guerrero-Arenas et al., Reference Guerrero-Arenas, Zúñiga-Marroquin and Jiménez-Hidalgo2018).
Sarzetti et al. (Reference Sarzetti, Labandeira, Muzón, Wilf, Cúneo, Johnson and Genise2009) described several traces of Odonata's endophytic eggs present in an angiosperm leaf from Laguna del Hunco (early Eocene). The authors indicated that in a leaf of Eucalyptus chubutensis (Berry) González (in part), González, Reference González2009 two ichnospecies are present; the first set of traces found in the apex of the leaf were classified as Paleoovoidus rectus and the successive traces as Paleoovoidus arcuatus. In this context, an opportunity was presented to evaluate whether geometric morphometrics allows expressing variability of shape in Odonata's egg traces, to evaluate whether this variability is consistent with the ichnotaxonomic attribution, and to investigate whether the methodology may provide additional information or insight on the behavior of the female at the time of oviposition.
Materials and methods
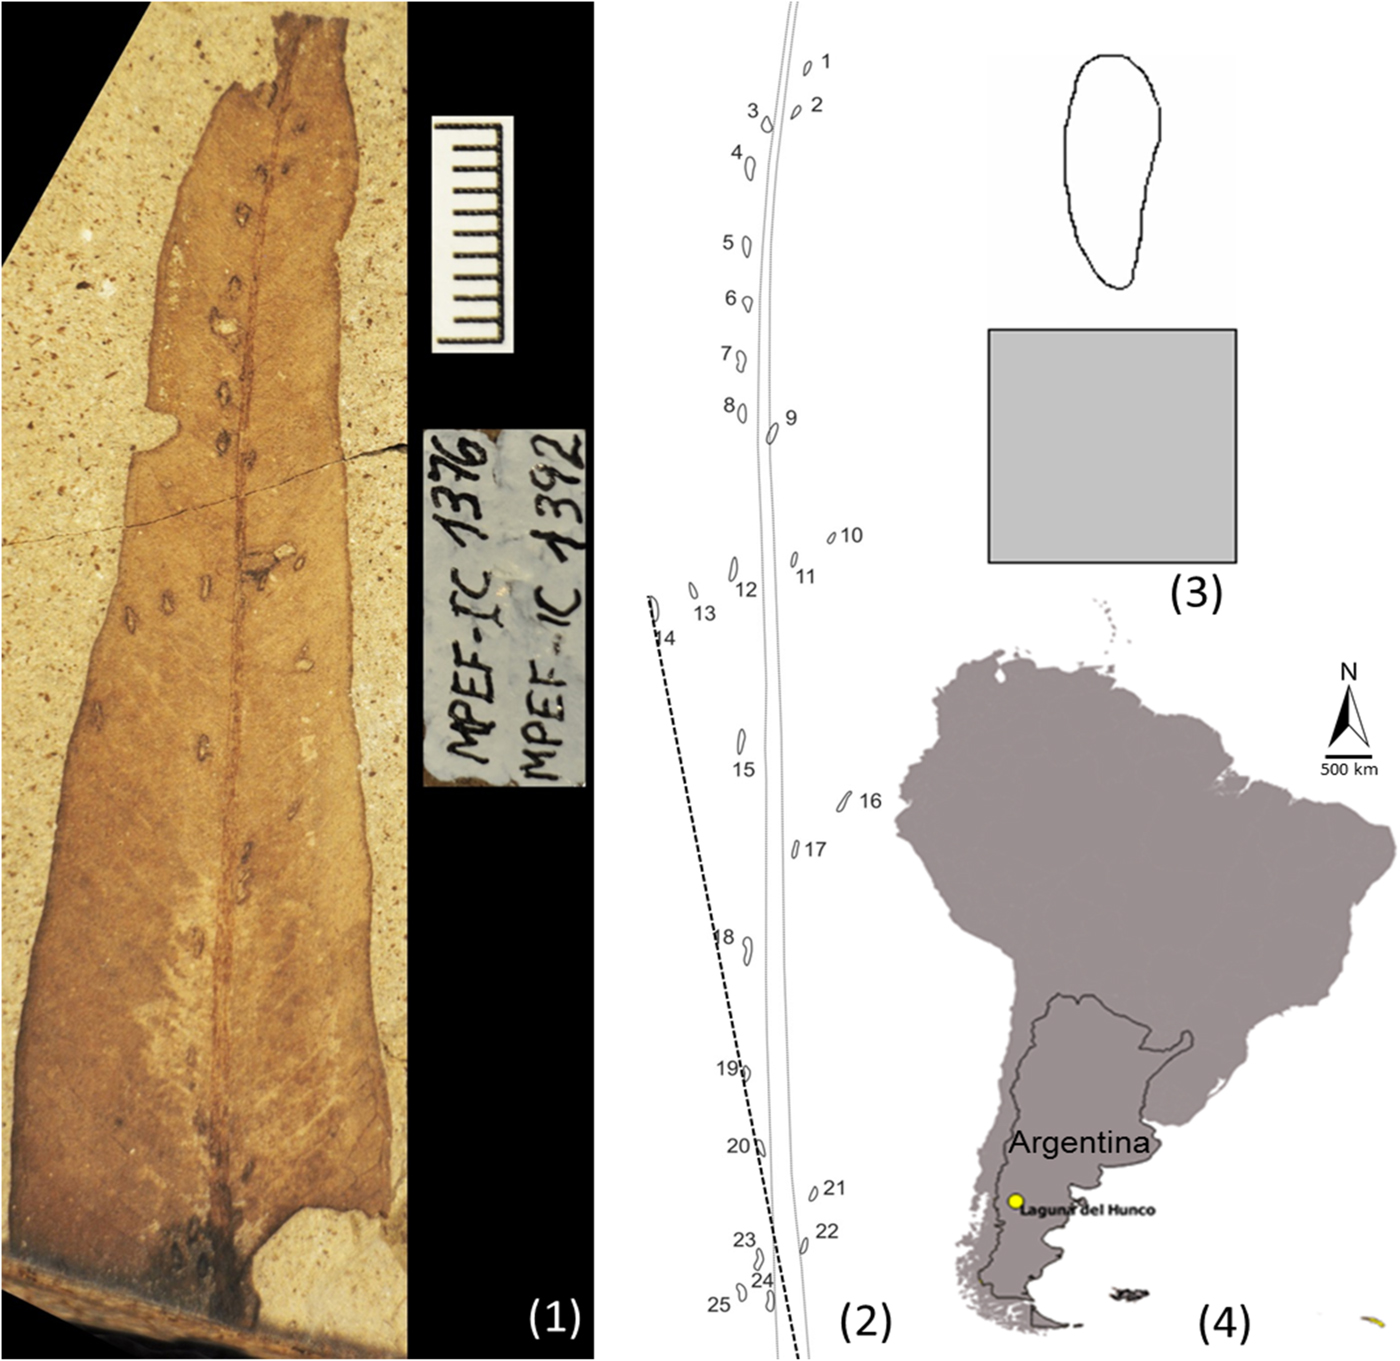
We worked with a fossil leaf of Eucalyptus chubutensis (Myrtaceae), which shows 25 traces of Odonata's endophytic eggs located along the entire leaf surface (Fig. 1.1). Only those traces of eggs that were well defined and had complete contours were considered. The leaf comes from the locality of Laguna del Hunco, Chubut, Argentina (Fig. 1.4) (LH13-1269, morphotype TY21; Wilf et al., Reference Wilf, Cúneo, Johnson, Hicks, Wing and Obradovich2003), belonging to the early Eocene (51.91 ± 0.22 Ma.). The material was observed with a Nikon Magnifier SMZ1000 with a built-in Nikon DS-Fi1-L2 camera. The fossil leaf was placed on a support in a horizontal position perpendicular to the charge-coupled device (CCD) of the camera. The distance used between the objective lens of the camera and the sample to be photographed was constant to avoid deformation of the microphotographs. These photographs were obtained at a size of 2,560 × 1,920 pixels in TIF format. The images were edited so that all the partial photos completed the leaf in its entirety. We digitally placed a superimposed inserter in which the contours of each trace and midrib were marked in detail (Fig. 1.2). Classical and geometric morphometrics were performed using that inserter. Drawing on the definition proposed by Vasilenko (Reference Vasilenko2005) and redefined by Sarzetti et al. (Reference Sarzetti, Labandeira, Muzón, Wilf, Cúneo, Johnson and Genise2009) that considers the tissue reaction, the present work includes the dark reaction mark of the leaf.
(1) Image of the leaf of Eucalyptus chubutensis (Myrtaceae) with traces of endophytic egg insertion of Odonata located along the entire leaf surface (MPEF-Pb-2216 - MPEF-IC 1376 / MPEF-IC 1392); scale bar = 1 cm. (2) Layer overlay to the main photograph of the leaf in which the contours of each trace and rib were marked in detail; the dashed line represents distance measured between a point at the base of the leaf to the apex of each of the traces of the eggs. (3) Detail of an egg trace with the scale (square 1 x 1 mm) in the lower margin. (4) Map of Patagonia, Argentina showing the locality of Laguna del Hunco, Chubut.

Classical morphometrics
In each trace of an egg, the following measurements were made: length (the longest part of the trace), width (the widest part of the trace), distance to the closest trace (from apex to apex), distance from the apex of the trace to the leaf rib, angle of the trace with respect to the rib, area, and perimeter. The program ImageJ 1.51n was used for such measurements. In addition, the distance between a fixed point at the base of the leaf to the apex of each of the traces of the eggs was measured (Fig. 1.2). The distance obtained was transformed to logarithmic scale. Spearman correlation analyses were performed between that distance and the trace length or width to observe whether these metrics of the trace vary with respect to its location on the leaf.
Geometric morphometrics
The separation of shape and size is a critical problem in morphometrics studies because both variables are commonly related and the independent measurement of one of them is difficult due to its covariation with the other. However, when trying to describe the morphological variation of an object, the metric variation between the different units of size needs to be standardized to reduce the effects of the variance in the analysis.
The Fourier shape analysis allows us to explore small differences in shapes (Kuhl and Giardina, Reference Kuhl and Giardina1982; Ferson et al., Reference Ferson, Rohlf and Koehn1985; Hammer and Harper, Reference Hammer, Harper, Hammer and Harper2006), defined from the characterization of a contour registered by a certain number of points (Williams, Reference Williams1981; Hammer and Harper, Reference Hammer, Harper, Hammer and Harper2006). From the definition of this contour, the Fourier analysis is based on the reduction or transformation of a series of bidimensional coordinates (x, y) to shape parameters (Hammer and Harper, Reference Hammer, Harper, Hammer and Harper2006) that will be expressed as harmonics and analyzed by multivariate analysis (Williams, Reference Williams1981; Rohlf and Archie, Reference Rohlf and Archie1984; Lestrel, Reference Lestrel, Dixon, Hoyte and Rönning1997).
There are two types of Fourier analysis: polar analysis (or radial) and the elliptic functions analysis. The fundamental differences are established in the type of coordinates (Hammer and Harper, Reference Hammer, Harper, Hammer and Harper2006). The elliptical Fourier analysis represents a formulation where the coordinates x and y are established in the plane, point by point, around the contour as a third periodic function (Kuhl and Giardina, Reference Kuhl and Giardina1982). As a result, four coefficients are generated (cosine [cos] and sine [sin] of the x-axis [cosx-sinx] and y-axis [cosy-siny]) for each harmonic, unlike the two (cos-sin) generated from polar-type coordinates (Rohlf and Archie, Reference Rohlf and Archie1984; Ferrario et al., Reference Ferrario, Sforza, Tartaglia, Colombo and Serrao1999; Navarro et al., Reference Navarro, Zatarain and Montuire2004; Sheets et al., Reference Sheets, Covino, Panasiewicz and Morris2006). The elliptical method allows definition of more complex shapes with better detail than polar analysis (Hammer and Harper, Reference Hammer, Harper, Hammer and Harper2006); for this reason, in the present work the contour analyses were performed by elliptical Fourier analysis.
The Fourier method involves the digitalization or delimitation of a contour from a number of points, generally using a photographic support (Hammer and Harper, Reference Hammer, Harper, Hammer and Harper2006). In general, as many parameters as necessary for a correct representation of the shape must be defined. The greater the number of parameters used, the more accurately the contour is captured. The functions adjusted to the contours are called harmonics (Rohlf, Reference Rohlf, Rohlf and Bookstein1990; Monteiro and Reis, Reference Monteiro and Reis1999), curves that are added in descending order to describe the contour, so that the first harmonics describe the contour in a general way, while the last ones represent small-scale variation, which, when the number of harmonics is excessive, tends to pick up noises (Rohlf, Reference Rohlf, Rohlf and Bookstein1990; Haines and Crampton, Reference Haines and Crampton2000; Ubukata, Reference Ubukata2004). It has been described that around 20–30 harmonics are usually sufficient to define complex shape, although this varies with the shape, and sometimes a smaller number is adequate (Williams, Reference Williams1981; Lestrel, Reference Lestrel, Dixon, Hoyte and Rönning1997; Hammer and Harper, Reference Hammer, Harper, Hammer and Harper2006).
For geometric morphometrics, we worked with individual images of the contour of each of the traces (Fig. 1.3). For the calculation of the Fourier coefficients, the free distribution statistical package SHAPE 1.3 (Iwata and Ukai, Reference Iwata and Ukai2002) was used. The coefficients of the Fourier transformations were calculated through the normalization method based on the first harmonic. Twenty harmonics were taken (Hammer and Harper, Reference Hammer, Harper, Hammer and Harper2006) (we tested with a lower number of harmonics; 20 harmonics were better adjusted to the reference shape). With the numerous variables produced (four coefficients for each harmonic), a principal component analysis (PCA) was performed using the covariance matrices, which reduced the dimensionality, and new derived variables were created. They order the traces according to their shapes in a canonical space. For this, the PAST 3.15 free distribution statistical package (Hammer et al., Reference Hammer, Harper and Ryan2001) was used. Finally, the PrinPrint (SHAPE 1.3 subprogram) was used to visualize the variation of shape represented by each main component.
The base of the leaf hardens more quickly than the tip of the leaf (Choong, Reference Choong1996; Teaford et al., Reference Teaford, Lucas, Ungar and Glander2006), so a regression analysis was performed between the variables PC 1 and distance of each of the traces to a fixed point located at the base of the leaf (Fig. 1.2) to observe whether the changes in the shape of the trace would be linearly related to the hardness changes of the leaf at the time of egg insertion. The same procedure was followed with PC 2 and PC 3.
Interaction of ichnotaxonomy with classical and geometric morphometrics
A comparison was made by classical morphometrics between the groups interpreted from geometric morphometrics (apical, middle, and basal) and between the ichnotaxonomic classification proposed by Sarzetti et al. (Reference Sarzetti, Labandeira, Muzón, Wilf, Cúneo, Johnson and Genise2009; P. rectus and P. arcuatus) to observe whether classical morphometrics is sufficient to differentiate egg traces between these classifications. The parameters to be compared were length, width, distance between successive traces, distance to the rib, angle to the rib, and area and perimeter of the trace by means of ANOVA followed by Tukey tests, where significant differences (p < .05) were found. Principal component scores of the three groups, based on geometric morphometrics, were also compared using ANOVA followed by Tukey tests.
Repository and institutional abbreviation
The specimen examined in this study is deposited in the Egidio Feruglio Paleontological Museum (M.E.F.), Trelew, Province of Chubut, Argentina, with two collection numbers, one paleobotany (MPEF-Pb-2216) and another ichnological (MPEF-IC 1376 and MPEF-IC 1392).
Results
Classical morphometrics
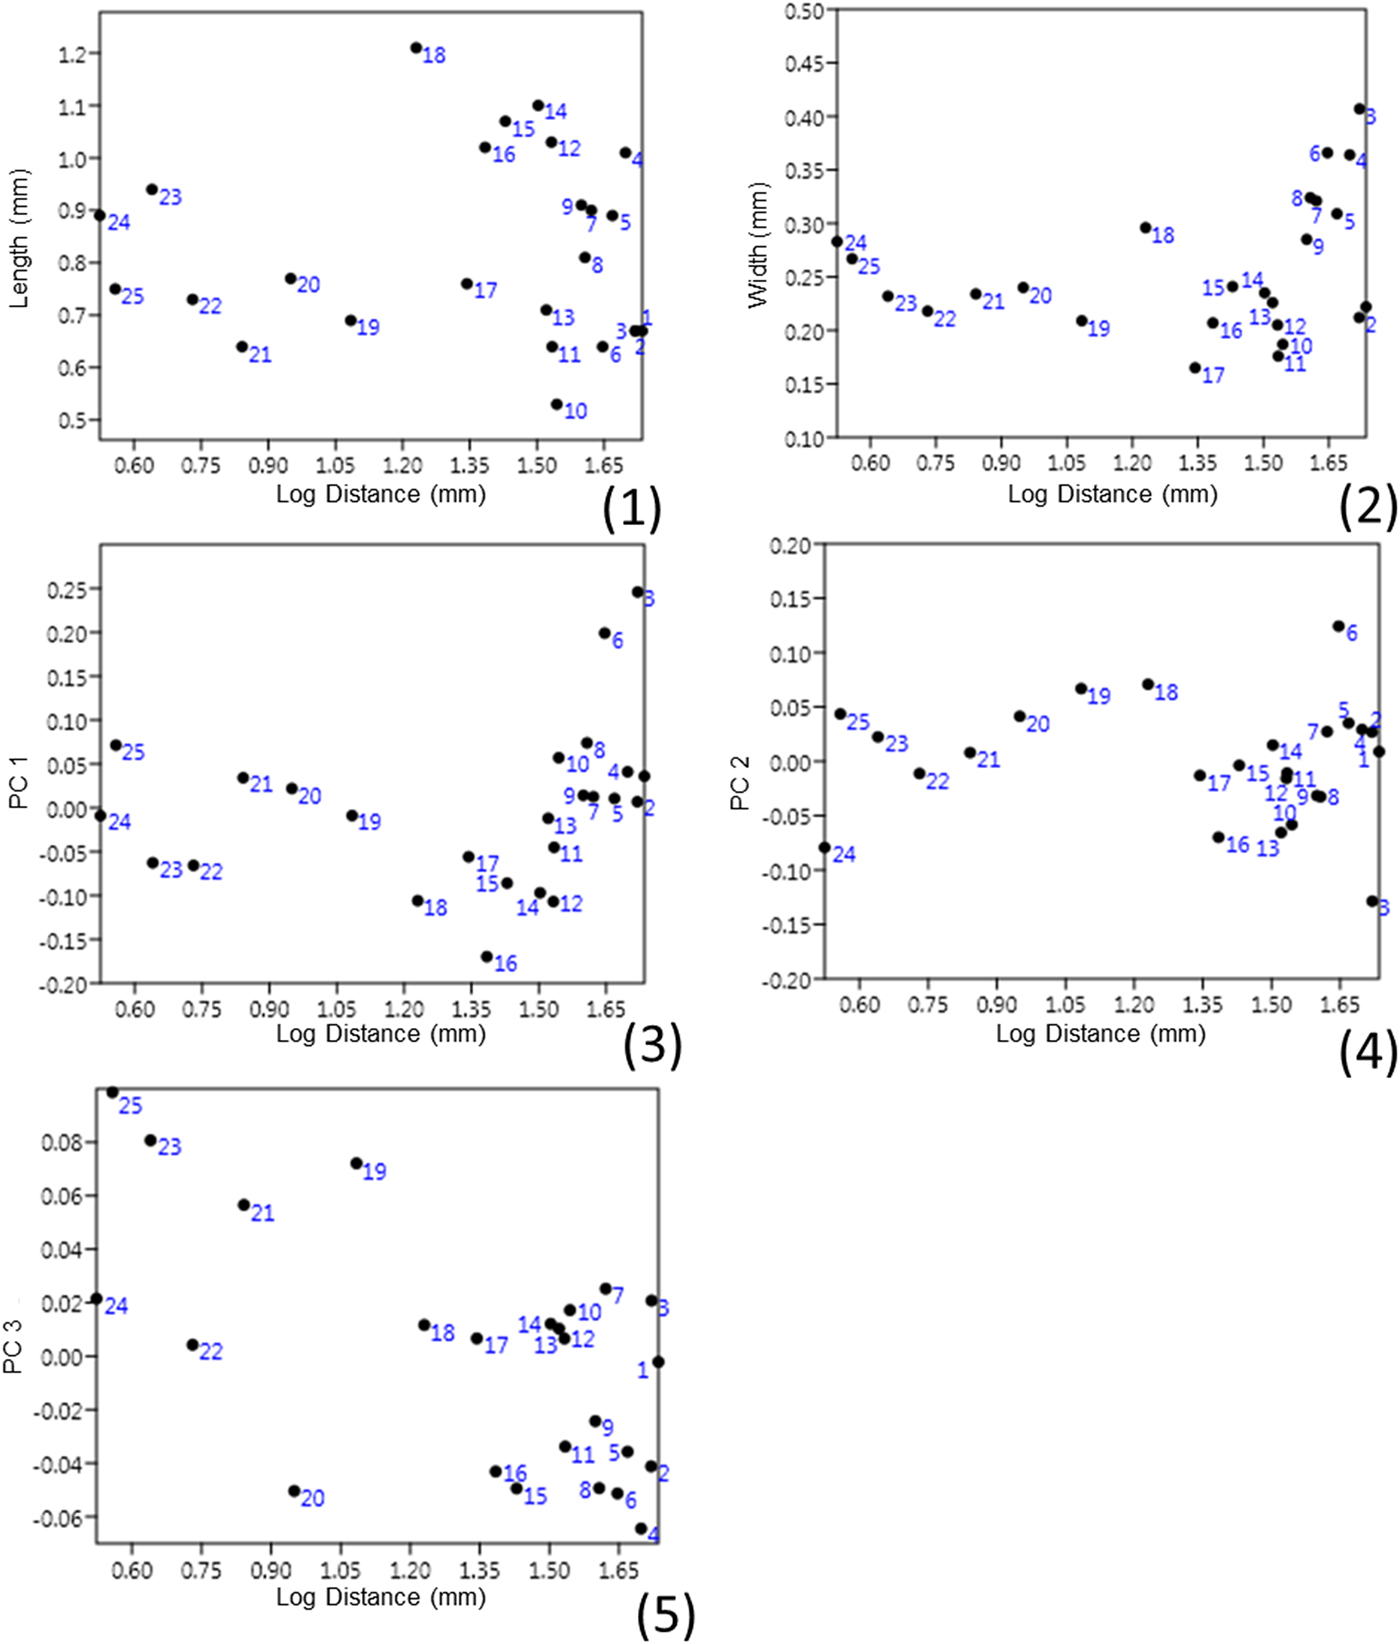
The mean length of the traces was 0.83 mm, the mean width 0.26 mm, the mean distance to the closest trace 2.94 mm, the mean distance from the apex of the trace to the rib 1.07 mm, the mean angle of the trace with respect to the rib 13.08°, the mean area 0.13 mm2, and the mean perimeter 1.78 mm (Table 1). No significant correlations were found between the length (p = 0.34, r = −0.20) or the width (p = 0.18, r = 0.28) of the trace and the location of the trace on the leaf (Fig. 2).
Correlation graph between: (1) length of the trace and log of the distance to a point at the base of the leaf; (2) width of the trace and log of distance to a point at the base of the leaf. Regression graph between: (3) log of the distance to a point at the base of the leaf and PC 1; (4) log of the distance to a point at the base of the leaf and PC 2; (5) log of the distance to a point at the base of the leaf and PC 3.

Comparative values by classical morphometrics between the ichnospecies (P. rectus and P. arcuatus) and the classification based on geometric morphometrics from the analysis of main components (apical, middle, and basal zones). Minimum to maximum range is shown, and mean ± standard error is included in parentheses. For each grouping, different superscript letters within a column indicate statistically significant differences (p < 0.05).

Geometric morphometrics
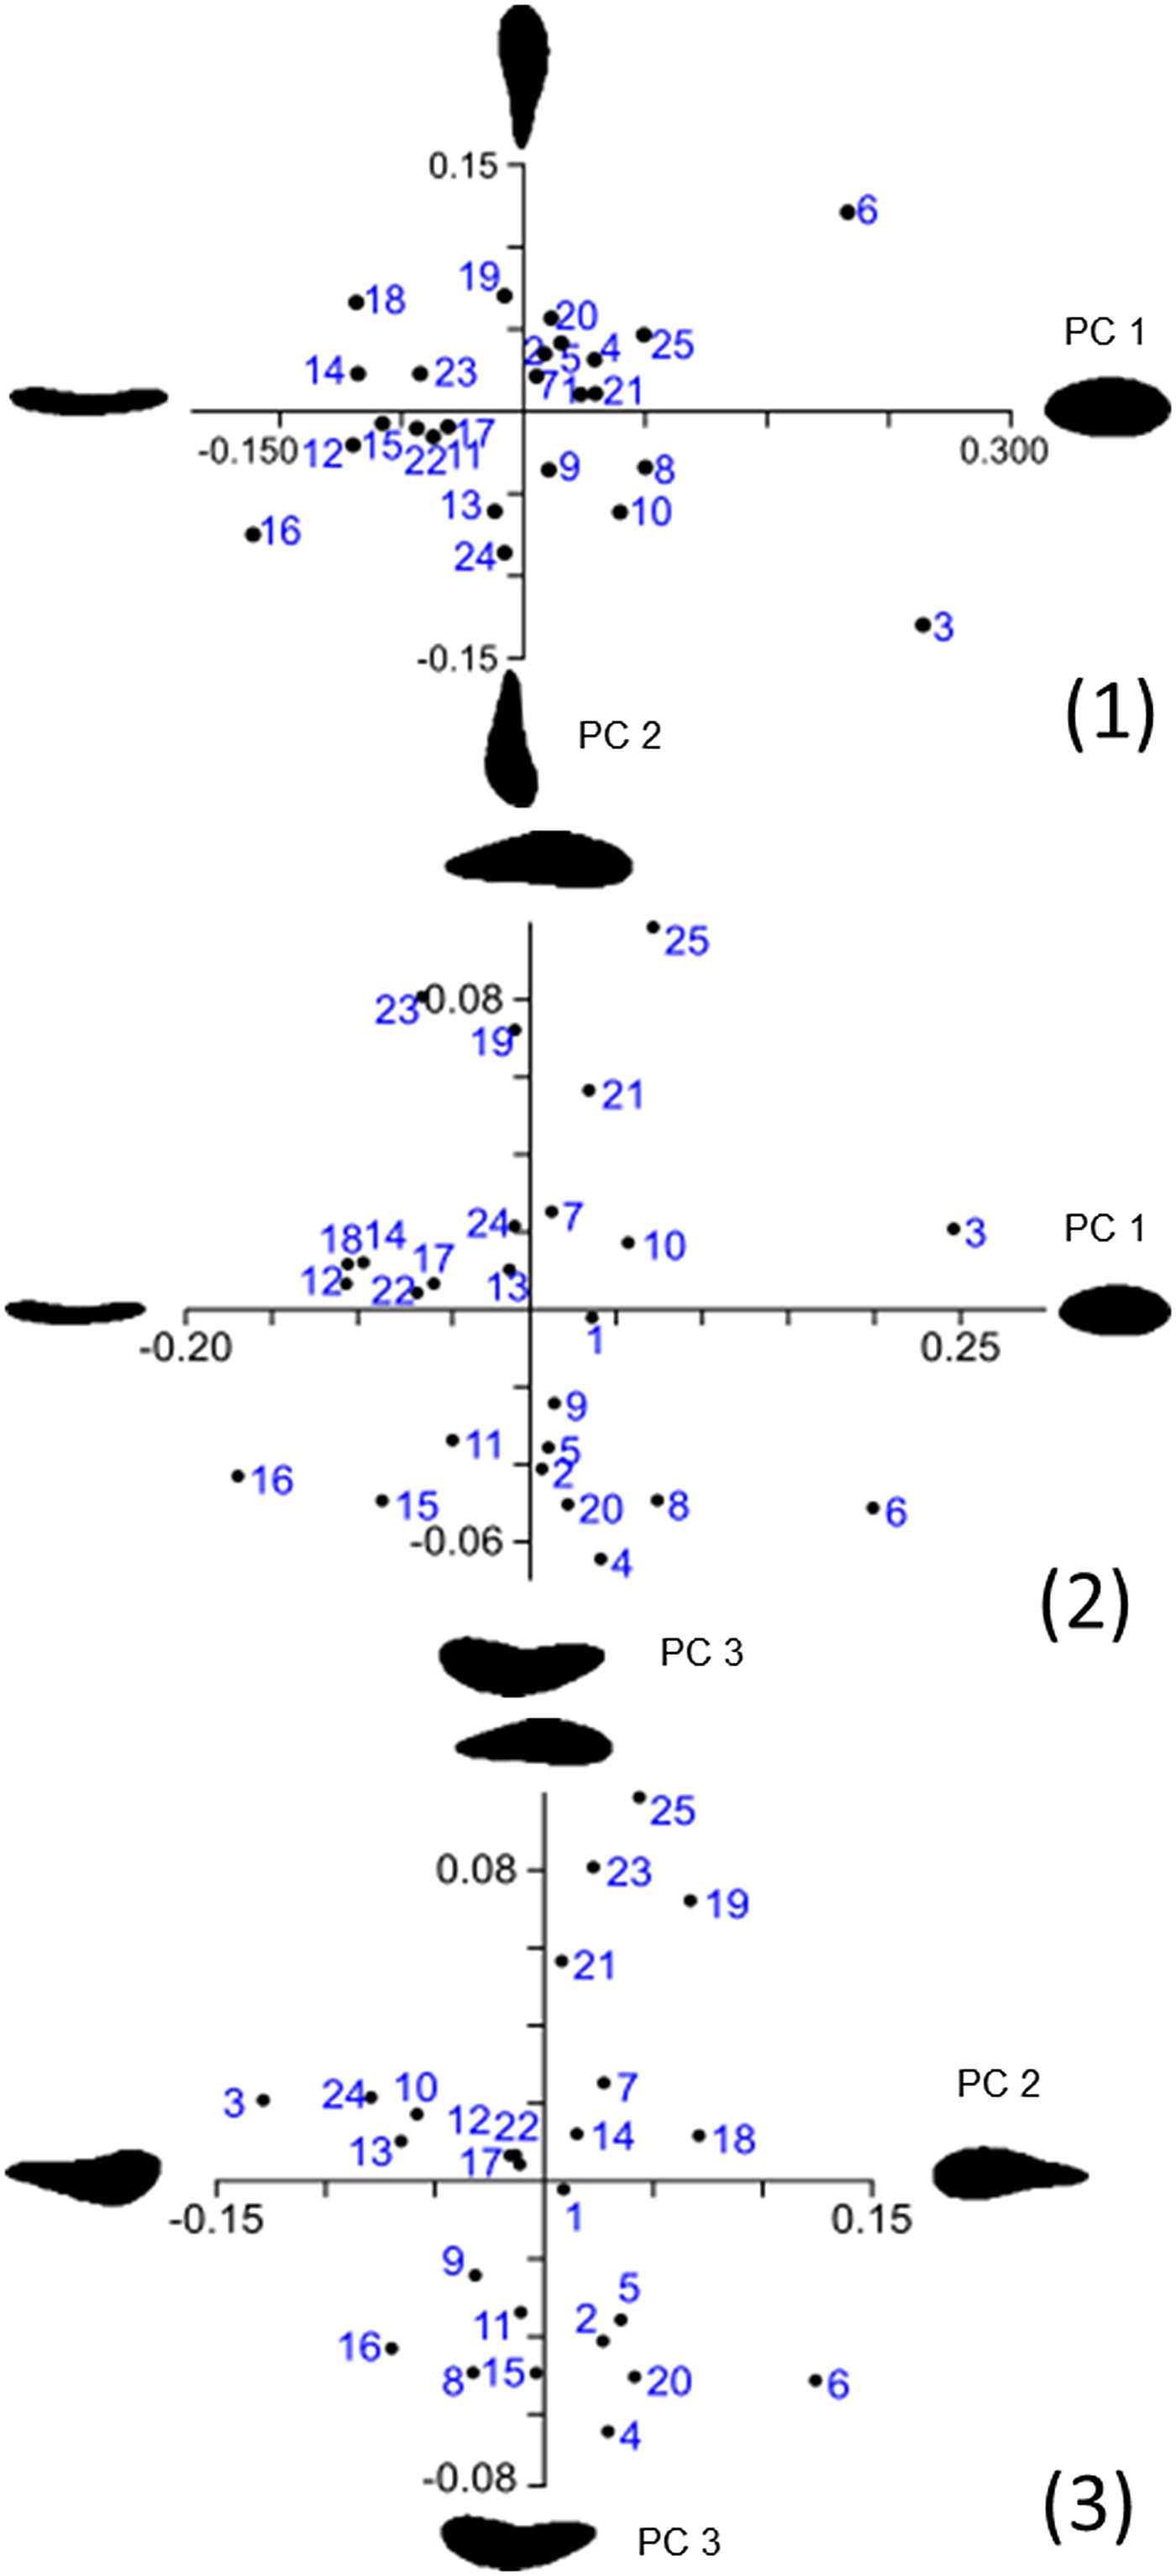
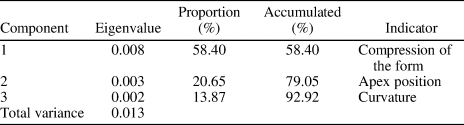
The analysis of the main components of the Fourier coefficients reduced the variability to three main components (PC) (Figs. 3, 4) that comprise 92.92% of the variance observed in the shape. PC 1 explains 58.40% of the total variation, PC 2 explains 20.64% of the total variation, and PC 3 explains 13.87% of the total variation (Table 2).
Graphs of the principal components analysis performed with the covariance matrices on the Fourier coefficients. (1) PC 1 versus PC 2. (2) PC 1 versus PC 3. (3) PC 2 versus PC 3.

Variation in the shape of the traces of the eggs present in the leaf of Eucalyptus chubutensis (Myrtaceae). The variation in the shape is represented in units of standard deviation from a mean shape, which is the average of the Fourier coefficients for all the shapes analyzed. Principal components PC 4 and PC 5, which capture a very small fraction of the variation, are shown for illustrative purposes.

Eigenvalue and contributions of the main components calculated in the traces of the eggs.

As seen in Figure 4, the largest variation in the sample corresponds to the compression of the shape, while the remaining two components show localized variations in the position of the apex of the trace and the curvature of the trace, respectively. The superposition on the shape (Fig. 4, first column) shows the variation in the components as well as the location of the shape differences between the contours (data on two egg traces appear to be outliers: egg traces 3 and 6; however, results remained consistent after removing those traces from the PCA, with the first three components explaining 89.4% of the total variation).
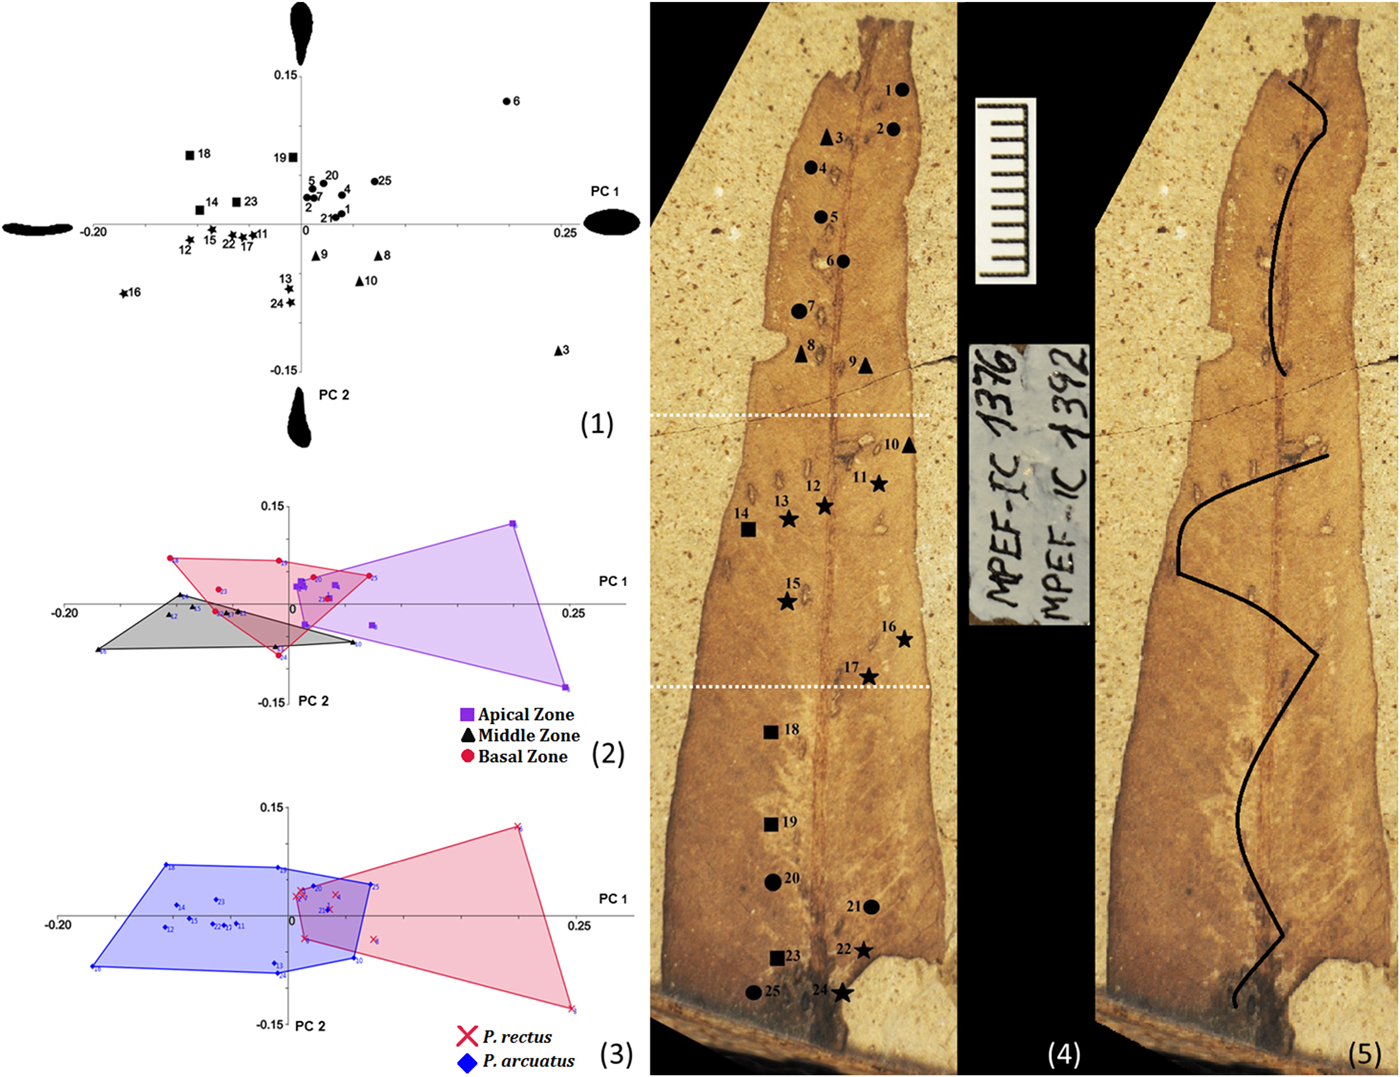
Figure 5 shows the trace shapes disposition along the leaf, based on the first two main components. For the positive values of PC 1 and positive values of PC 2, the PCA gathers traces of spherical eggs with the vertex downward (Fig. 5.1 ‘circle,’ mainly in the apical area of the leaf). For the negative values of PC 1 and negative values of PC 2, it gathers traces of eggs compressed with the vertex upward (Fig. 5.1 ‘star,’ mainly in the central zone of the leaf). For the negative values of PC 1 and positive values of PC 2, it gathers traces of eggs compressed with the vertex downward (Fig. 5.1 ‘square,’ mainly in the basal area of the leaf). Spherical eggs with the vertex upward are rare (positive values of PC 1 and negative values of PC 2) and located mainly in the middle zone and the apical zone of the leaf (Fig. 5.1 ‘triangle’). No linear relationship was found between the distance from each of the traces to a point located at the basal of the leaf and the compression of the trace (PC 1) (R2 = 0.047, p = 0.298), the position of the apex (PC 2) (R2 = 0.005, p = 0.732), or the curvature of the trace (PC 3) (R2 = 0.367, p = 0.001) (Fig. 2).
Trace shapes disposition along the leaf, based on the first two principal components (PC 1 and PC 2) of a principal components analysis. (1) Plot of PC 1 versus PC 2. (2) According to the analysis of PC 1 versus PC 2, the leaf may be divided into three zones: apical zone, middle zone, and basal zone. The apical zone presents spherical eggs with their apex downward. The middle zone presents mainly compressed eggs with their apex upward. The basal zone of the leaf presents, in addition to the previous combinations, compressed eggs and with their apex downward. (3) Geometric morphometrics show an overlap of the range of shapes occurring between P. rectus and P. arcuatus. (4) Leaf divided into three zones: apical, middle, and basal zones (dotted line). (5) Possible pattern of the female placing its eggs. Scale bar = 1 cm.

Drawing on the first two main components, the leaf may be qualitatively divided into three zones according to the shape of the eggs: apical, middle, and basal (Fig. 5.2, 5.4). The apical zone presents traces of spherical eggs, most frequently with the apex downward. The middle zone presents traces of compressed eggs, with the apex upward. The basal zone of the leaf presents, in addition to the previous combination, traces of compressed eggs, with the apex facing downward. Note the rare presence of spherical eggs with the apex upward. Consistently, there were statistically significant differences between the scores of PC 1 of the apical and middle zones, and between PC 3 scores of the basal compared to apical and middle zones (Table 3).
Comparison of principal components (PC) scores for apical, middle, and basal zones along the leaf (mean ± standard error). For each PC, different superscript letters within a column indicate statistically significant differences (p < 0.05).

Interaction of ichnotaxonomy with classical and geometric morphometrics
The parameters measured according to classical morphometrics (length, width, distance between successive traces, distance to the rib, angle to the rib, area and perimeter of the traces) were compared between the three zones interpreted from the analysis of geometric morphometrics (apical, middle, and basal) and between the two ichnospecies proposed by Sarzetti et al. (Reference Sarzetti, Labandeira, Muzón, Wilf, Cúneo, Johnson and Genise2009; P. rectus and P. arcuatus; Table 1). The only significant differences were found in the widths of the traces of the apical zone (which coincides with P. rectus), which were wider compared to the other traces (p < 0.01), and in the distance of the egg trace to the rib, which was shorter on average in the apical and basal zones compared to the middle zone (p < 0.05).
Discussion
Classical morphometrics
The descriptions of the fossil shapes have historically been made through linear measurements. Sarzetti et al. (Reference Sarzetti, Labandeira, Muzón, Wilf, Cúneo, Johnson and Genise2009) provide linear measurements of P. rectus (length ranging from 1.0 to 1.2 mm, width from 0.4 to 0.5 mm, and distance between successive traces 0.7 to 1.4 mm); these dimensions are different from those taken in the present research (lengths were 0.64 to 1.01 mm, widths 0.21 to 0.41 mm, distances between successive traces 1 to 5.33 mm). These differences could be partly because they considered P. rectus in an area that would contain 12 traces, while we identified 13, but four of them were not included in the analyses because they were incomplete (three of them are on the tip of the leaf, and if we consider the spatial disposition, it is observed that these eggs are placed in a curved pattern [similar to P. arcuatus]; Fig. 5.5). They do not provide data on the measurements of P. arcuatus belonging to that leaf. The existence of variation produced by differences of criteria in the measurement is an important aspect to be considered because for those who work with linear measurements it is a frequent problem that could be reduced by using the geometric morphometrics technique.
The marked similarity between the morphometrics of the egg traces of the ichnospecies proposed by Sarzetti et al. (Reference Sarzetti, Labandeira, Muzón, Wilf, Cúneo, Johnson and Genise2009), combined with egg insertion patterns of extant Odonata (Matushkina, Reference Matushkina2007), suggests that they could have been placed by the same female. Matushkina (Reference Matushkina2007) photographed a stem of Myriophyllum spicatum Linnaeus, Reference Linnaeus1753 (Haloragaceae) that contains recent endophytic eggs of the family Aeshnidae. This material has eggs inserted by one female and arranged in two different patterns. The first area of the stem shows eggs arranged in a linear pattern, and the basal area shows eggs arranged in a zigzag pattern, an arrangement comparable to the traces of fossil eggs observed in the leaf of Eucalyptus chubutensis, showing that one female can oviposit in both patterns. This is also supported by personal observations on living specimens in the field (Romero-Lebrón). Fossil materials with an arrangement like that can be found in work by Hellmund and Hellmund (Reference Hellmund and Hellmund1998) and Petrulevičius et al. (Reference Petrulevičius, Wappler, Nel and Rust2011). Hellmund and Hellmund (Reference Hellmund and Hellmund1998) show a leaf of Daphnogene lanceolata Unger, Reference Unger1850 (Lauraceae, specimen SMMGD Hw 253, fig. 5) from the lower Oligocene of Germany. This specimen is not complete, but a curved pattern can be observed at the base and a straight pattern at the apex. Petrulevičius et al. (Reference Petrulevičius, Wappler, Nel and Rust2011) show a leaf of Sideroxylon salicites (C.O. Weber) Weyland, Reference Weyland1937 (Sapotaceae, specimen HW Ro 2.8, figs. 11, 12) from the upper Oligocene from Rott (also Germany) that has both ichnospecies (P. rectus at the apex of the leaf and P. arcuatus at the base). They state that the Rott specimen exhibits only minor differences from the Argentine material described by Sarzetti et al. (Reference Sarzetti, Labandeira, Muzón, Wilf, Cúneo, Johnson and Genise2009), and the authors comment that they find it curious that in their leaf the same association of P. rectus and P. arcuatus is repeated and in the same position within the leaf. Sarzetti et al. (Reference Sarzetti, Labandeira, Muzón, Wilf, Cúneo, Johnson and Genise2009) suggest that the oviposition traces are similar to the oviposition of Zygoptera (Odonata). Specifically, they say that members of the Lestidae family probably produced P. rectus, while the Coenagrionidae family were responsible for P. arcuatus. Based on the preceding observations, our hypothesis is that it is more probable that the same female has placed her eggs in both patterns in an Eocene leaf of Laguna del Hunco from Argentina and leaves of Oligocene from Germany than that two different families of zygopteran have coincided in the same leaves numerous times to generate the same disposition.
The values obtained by classical morphometrics of the variable length of the trace agree with those reported by Moisan et al. (Reference Moisan, Labandeira, Matushkina, Wappler, Voigt and Kerp2012) for the length of present Odonata's eggs of the family Coenagrionidae, while the distances between successive traces agree with Matushkina and Gorb (Reference Matushkina and Gorb2000) for the variable distance between successive eggs of current Odonata of the family Lestidae. We also have to consider that in Laguna del Hunco extinct families of Odonata are recorded that could be the producers of the traces (Petrulevičius, Reference Petrulevičius2013): the Austroperilestidae (Zygoptera) and the Frenguelliidae, controversially considered either basal Epiproctophora or Zygoptera (Petrulevičius and Nel, Reference Petrulevičius and Nel2003, Reference Petrulevičius and Nel2009, Reference Petrulevičius and Nel2013; Petrulevičius, Reference Petrulevičius2017). Therefore, the information obtained so far is not enough to assign the ichnospecies to a family of Odonata.
No significant correlations were found between the length of the trace or their width and the distance of each of the traces to a point located at the base of the leaf, which means that neither the length of the trace nor their width would be modified by the relative location of the trace on the leaf. These results would support the hypothesis that these eggs were placed by a single female. In current species, differences are observed between the length of eggs laid by different species (Moisan et al., Reference Moisan, Labandeira, Matushkina, Wappler, Voigt and Kerp2012).
Geometric morphometrics
The present study is based on the fact that the method of elliptical Fourier descriptors uses an approach that is independent of the dimensions; therefore it is postulated that it is capable of detecting subtle differences in the shape of the traces. The results obtained support that the Fourier contour analysis allows exploring in detail the variability in the shape and morphospatial representation of the traces of Odonata's endophytic eggs present in a leaf assigned to the myrtle family (Myrtaceae) from the Laguna del Hunco.
Choong (Reference Choong1996) and Teaford et al. (Reference Teaford, Lucas, Ungar and Glander2006) postulated that dicotyledonous leaves are harder at the base than at the tip. By means of the linear regression analysis, we can infer that the shape of the traces (PC 1, PC 2, and PC 3) would not be influenced by the hardness of the leaf at the time of egg inserting. Because of the tissue reaction of the leaf, we postulated that at the time of oviposition, the leaf was alive.
The contour analysis of the traces also provides information suggestive of the way in which the insertion of eggs would have occurred. It has been observed that the females lay their eggs with the pointed ends directed outward (Sawchyn and Gillott, Reference Sawchyn and Gillott1974 [Lestidae]; personal observation by Romero-Lebrón [Coenagrionidae]). We can infer that the eggs were placed by a single female, who initially began to insert her eggs at the base of the leaf and then, with oscillatory movements, moved forward to the apex of the leaf. Once she reached two-thirds of the length of the leaf, she stopped moving and bent her abdomen onward to complete the insertion of the eggs in this position, thus a predominance of eggs with their apex oriented downward (toward the base of the leaf; behavior observed by Romero-Lebrón in current Coenagrionidae). The females of Odonata can bend their abdomen ventrally to different degrees to lay their eggs (Corbet, Reference Corbet1962; Fig. 6). Jödicke (Reference Jödicke1997) formulated the hypothesis that the degree of curvature of the abdomen correlates with the rigidity of the substrate and, therefore, with the force that a female can exert during the penetration of the tissues of the plant when inserting her eggs.
Female of Coenagrionidae (Zygoptera) placing its eggs endophytically under water in a stem of Hydrocotyle bonariensis (Araliaceae). (1) Extended abdomen. (2) Abdomen at the height of the first pair of legs. (3) Abdomen beyond the head. Dragonfly is 3.1 cm long (from the tip of the head to the tip of the abdomen).

For birds, Denis Ávila and Olavarrieta (Reference Denis Ávila and Olavarrieta2011) and Denis Ávila (Reference Denis Ávila2014) applied the method of Fourier analysis for studying the shape of eggs. While in paleontology numerous works have contributed data on traces, to the best of our knowledge, no previous studies have used the method of Fourier analysis to describe insect egg fossil traces. The present work is the first contribution to the knowledge of the variation of the shape through the analysis of Fourier contour in traces, providing insights on the behavior of the female of Odonata during oviposition.
Interaction of ichnotaxonomy with classical and geometric morphometrics
According to the parameters calculated in the traces of the eggs, the results support the assertion that performing only classical morphometrics analysis does not provide sufficiently robust data to differentiate between the ichnospecies P. rectus and P. arcuatus (Table 1). Geometric morphometrics also show an overlap of the range of shapes occurring between P. rectus (apical zone) and P. arcuatus (middle and basal zones; Fig. 5.3; Table 3).Thus, these two trace fossil structures (which consider not only the egg traces measured but also their spatial pattern in the substrate) may have been made by one individual tracemaker. An ichnotaxon is a name assigned to a morphologically recurrent structure resulting from the life activity of an individual organism (or homotypic organisms) modifying the substrate (Bertling et al., Reference Bertling, Braddy, Bromley, Demathieu and Genise2006). The results presented here suggest that both ichnotaxa were made by one individual and contribute to reconstructing the reproductive behavior of the tracemaker. Although giving different ichnotaxonomical names to different parts of a trackway because of changes in behavior should be generally avoided (Bertling, Reference Bertling and Miller2007), if the possibility that the two ichnotaxa were made by the same female is accepted, it does not necessarily invalidate the ichnotaxa assigned to each of the two components of the superstructure. Nevertheless, the approach proposed in this work could be a useful starting point for further investigations in defining new ichnotaxonomical categories or species.
Conclusions
Fossil traces are more than just the mere modification of the substrate by the life activity of an organism. They are also important sources of information about the behavior of the animals that made the traces. The results support that the methodology used allows detecting differences in the shape of the traces. Variations in the shape of the trace reflect the two-dimensional pattern observable in the fossils of an originally three-dimensional structure. Neither the length nor the width of the trace would be affected by the location on the leaf, which would support the hypothesis that the eggs were placed by a single female. In addition, it is inferred that the shape of the trace would not be affected by the hardness that the leaf possessed at the time of the insertion of the eggs. Performing exclusively studies of classical morphometrics of the egg traces per se does not provide enough data to differentiate between ichnospecies, while the geometric morphometrics allow making inferences in the oviposition behavior of a female that lived 52 million years ago. The variations in the shape of the trace are consistent with the positional differences of the eggs that would have been inserted by a single female on a live leaf. The female would begin at the base of the leaf and then flex its abdomen to place the eggs as it approaches the apex of the leaf (behavior also exhibited by extant species of Odonata).
Acknowledgments
We are grateful to F. Degrange, V. Klocker, and S. De Romedi for their help during the field trips. We thank N. Raptopulos for making the map as well as E. Ruigómez from the M.E.F. (Museo Egidio Feruglio) for loaning the specimens for study. We thank Dr. C. Tambussi for helpful discussions that led to writing this manuscript. We also thank comments from the editor and three anonymous reviewers that helped improve the quality of the manuscript. Funding support for the field trip and laboratory studies came from grants: DEB-1556666 from the National Science Foundation of USA (NSF); PIP 0834 from the National Research Council of Argentina (CONICET); PICT-2016-4297 from the National Agency of Scientific and Technological Promotion of Argentina (ANPCyT).