INTRODUCTION
Upland rice (UR) is cultivated in Asia, Africa and the Americas, and, in total, accounts for ~12% of global rice production (Bernier et al., Reference Bernier, Atlin, Serraj, Kumar and Spaner2008). UR has been increasing in global importance due to the declining availability of water and need for improved water-use efficiency in flood-irrigated varieties (Bouman et al., Reference Bouman, Peng, Castañeda and Visperas2005; Crusciol et al., Reference Crusciol, Soratto, Nascente and Arf2013a). In Brazil, UR is cultivated primarily across the central savannah region (Santos et al., Reference Santos, Stone and Vieira2006) where it forms the socio-economic and food security basis of a large proportion of the farming and non-farming population. However, low grain yields, quality and high agro-climatic risk in the UR crop system have led to the replacement of more than half of the UR area in Brazil by lower risk, higher revenue crops in the last 10 years, i.e. a decrease from 902,367 ha in 2004 to 203,265 ha in 2014 in the savannah region (IBGE, 2015; Pinheiro et al., Reference Pinheiro, Castro and Guimarães2006). As a consequence of the growing population, the demand for food and environmental friendly agricultural practices makes UR a feasible option for increasing production with higher water use efficiency (West et al., Reference West, Gerber, Engstrom, Mueller, Brauman, Carlson, Cassidy, Johnston, MacDonald, Ray and Siebert2014). Whilst productivity gains can be achieved through yield gap closure and crop breeding which will improve potential yields and stress tolerance (Heinemann et al., Reference Heinemann, Barrios-Perez, Ramirez-Villegas, Arango-Londono, Bonilla-Findji, Medeiros and Jarvis2015), increases in total UR production are also possible through the expansion of the cropping area by promoting the incorporation of UR into existing crop rotation systems (e.g. soybean–maize, cotton–maize).
Crop rotation is a practice essential to sustainable agricultural systems (Garnett et al., Reference Garnett, Appleby, Balmford, Bateman, Benton, Bloomer, Burlingame, Dawkins, Dolan, Fraser, Herrero, Hoffmann, Smith, Thornton, Toulmin, Vermeulen and Godfray2013). However, despite the known benefits of wider row spacing, i.e. decreased labour costs, mechanical inter-row cultivation, more efficient herbicide application and improved performance of individual plants (Baloch et al., Reference Baloch, Soomro, Javed and Ahmed2002, Lampayan et al., Reference Lampayan, Bouman, De Dios, Espiritu, Soriano, Lactaoen, Faronilo and Thant2010), Brazilian farmers are averse to the adoption of UR as a rotation crop in existing grain rotation systems. Two factors explain this behaviour: First, since the introduction of UR into a rotational crop system with maize, soybean or cotton would require downward adjustments in row spacing from 0.40 m for these crops to 0.30 m for UR (Santos et al., Reference Santos, Stone and Vieira2006), which would entail investment in additional drilling machinery just for the sowing of the rice. Second, UR is highly drought susceptible as compared with soybean or maize, which would increase the risks to growers. The latter is of particular importance in central Brazil since dry spells normally occur during the rainy season (Bernier et al., Reference Bernier, Atlin, Serraj, Kumar and Spaner2008; Crusciol et al., Reference Crusciol, Soratto, Nascente and Arf2013), and because the subsoil acidity of the savannah soils leads to restricted root depth, which amplifies the negative effects of moderate droughts on crop growth (Heinemann and Sentelhas, Reference Heinemann and Sentelhas2011).
An understanding of the responses of different cultivars to row spacing, drought stress and their interaction is thus needed to incorporate UR into the rotation with other crops in a cost-effective manner. There are a number of studies that have attempted to optimize row spacing for UR (Chauhan and Johnson, Reference Chauhan and Johnson2011; Lampayan et al., Reference Lampayan, Bouman, De Dios, Espiritu, Soriano, Lactaoen, Faronilo and Thant2010). However, current knowledge with regard to interactions between row spacing, cultivar characteristics and restricted soil water availability is still limited. Herein, we hypothesize that the morphological and physiological traits of rice cultivars (i.e. short vs. tall plants, short and erect leaves vs. long and decumbent leaves, high vs. low ability for tillering and resistance vs. susceptibility to lodging), (Santos et al., Reference Santos, Stone and Vieira2006) lead to different drought tolerance levels and different behaviour patterns according to the row spacing used, and thus help to overcome the adoption constraints to including UR in the existing crop rotation systems found in the Brazilian savannah. Based on this, the objective of this study was to evaluate the effect of four different row spacing (0.25, 0.35, 0.45, and 0.55 m) on UR grain yield and yield components of three cultivars (BRSMG Curinga, BRS Primavera and Douradão), under different water stress conditions in central Brazil.
MATERIALS AND METHODS
Experimental conditions
Four field experiments were conducted during the growing seasons of 2009 and 2010 in the states of Goiás and Tocantins, central Brazil. Both states are located in the savannah region, which have contributed almost 50% of total UR production in central Brazil over the last 10 years (IBGE, 2015). Experimental sites were selected so that they reflected contrasting production situations in terms of drought stress impact, frequency and timing (Heinemann et al., Reference Heinemann, Barrios-Perez, Ramirez-Villegas, Arango-Londono, Bonilla-Findji, Medeiros and Jarvis2015). Three experiments were carried out in 2009 in Formoso do Araguaia, in the state of Tocantins, (lat. 11.8 °S and long. 49.5 °W), Porangatu (lat. 13.5 °S and long. 49.3 °W) and Santo Antônio de Goiás (lat. 16.5 °S and long. 49.3 °W, SAG-2009), in the state of Goiás, and one experiment in 2010 in Santo Antônio de Goiás, SAG-2010 (Supplementary Figure S2, available online at http://dx.doi.org/10.1017/S0014479716000612). The soils in these locations are classified as Oxisol for Santo Antônio de Goiás and Porangatu, and Inceptisol for Formoso. The chemical and texture soil characteristics for each location are presented in Supplementary Table S1, available online at http://dx.doi.org/10.1017/S0014479716000612. The minimum and maximum air temperatures, rainfall and soil water contents (SWC) recorded throughout the experiments in the different locations are presented in Supplementary Figure S1 and Supplementary Figure S2. Mean maximum temperature and temperature variability were the highest in Porangatu, and the lowest in SAG. Precipitation and SWC were the lowest for Formoso, and the highest for SAG–2010, where supplementary irrigation was used.
Crop management and experimental design
The experiments were arranged in a randomized block design in a split–split-plot scheme with environments as the main plot, row spacing as the subplots and cultivars as the sub-subplots, totalling 48 treatments (4 × 4 × 3 = 48). Each treatment was replicated four times, totalling 192 evaluated sub-subplots. For each experiment, rice was sown at 0.25, 0.35, 0.45 and 0.55 m between rows, maintaining the same seed density per area (230 seeds m−2). Three UR cultivars, named BRSMG Curinga, BRS Primavera and Douradão, were selected based on their differences in physiological traits. BRSMG Curinga and BRS Primavera are classified as modern cultivars, whereas Douradão is known as a traditional cultivar, which means that this cultivar is no longer used by the Brazilian UR breeding programme. The cultivars differ in terms of number of leaves in the main stem and in development cycle. BRSMG Curinga is the most recently developed cultivar, with a medium cycle (110 days after sowing – DAS), BRS Primavera is also considered a medium cycle (100 DAS) and Douradão is the shortest cycle cultivar (95 DAS). The three cultivars also differ in their response to water stress (Heinemann et al., Reference Heinemann, Stone and Fageria2011). BRS Primavera and BRSMG Curinga are used as check cultivars by the UR breeding programme.
Experiments were sown on 12/12/2009 (Formoso), 16/11/2009 (Porangatu), 13/11/2009 (SAG–2009) and 16/12/2010 (SAG–2010). Irrigation was applied only in the 2010 experiment in Santo Antônio de Goiás with a sprinkler system, in order to avoid any water stress. More specifically, supplementary irrigation was supplied at 8, 36, 40, 41, 42, 43, 50, 53, 54, 55 and 62 DAS at the rates of 2.4, 4.4, 3.3, 3.4, 3.7, 3.2, 3.5, 3.8, 3.7, 3.5 and 2.9 mm day−1, respectively.
Phosphorus, potassium and zinc fertilizers were incorporated before sowing as follows: 60 kg P ha−1 were applied as triple superphosphate, 40 kg K ha−1 as potassium chloride and 5 kg Zn ha−1 as zinc sulfate. A total of 80 kg ha−1 of nitrogen was applied (as urea) in two doses: 50% at the beginning of tillering and 50% at the panicle initiation stage. These correspond to phases V3 and R0 in the Counce et al. (Reference Counce, Keisling and Mitchel2000) phenological scale.
Measurements
Yield and yield components
Yield and yield components (panicle m−2, 100-grain weight, percentage of sterile spikelets and number of grains per panicle) were measured in an area of 6 m2 in the centre of each sub-subplot, with each sample consisting of four rows of 0.5 m in length. Grain yield was measured at 13% of moisture content.
Phenology
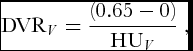
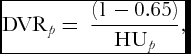
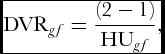
In addition to yield and its components, emergence, panicle initiation, flowering and physiological maturity dates were recorded in all experiments and used to determine phenological development rates in degree days per day (DVR, °Cd d−1), under the assumption that row spacing did not affect the DVR. The DVR was calculated for three different crop phenological phases: vegetative phase (v), from emergence to panicle initiation (0 to 0.65); panicle formation phase (p), from panicle initiation to flowering (0.65 to 1) and grain filling phase (gf), from flowering to physiological maturity (1 to 2). To calculate the DVR, the procedures described in Bouman et al. (Reference Bouman, Kropff, Tuong, Wopereis, Ten Berge and Van Laar2001) were applied, based on the following equations:
 $$\begin{equation}
\hspace*{2pt}{\rm{DV}}{{\rm{R}}_V} = \frac{{\left( {0.65 - 0} \right)}}{{{\rm{H}}{{\rm{U}}_V}}}\ ,
\end{equation}$$\\
 $$\begin{equation}
{\rm{\ DV}}{{\rm{R}}_p} = \ \frac{{\left( {1 - 0.65} \right)}}{{{\rm{H}}{{\rm{U}}_p}}},
\end{equation}$$\\
 $$\begin{equation}
{\rm{\ DV}}{{\rm{R}}_{gf}} = \frac{{\left( {2 - 1} \right)}}{{{\rm{H}}{{\rm{U}}_{gf}}}},
\end{equation}$$
 $$\begin{equation}
{\rm{HUH}} = 0,\quad\quad {\rm{if}}\quad\ {T_d} \le {T_{{\rm{base}}}}\ \,{\rm{or}}\,\ {T_d} \ge {T_{{\rm{high}}}},
\end{equation}$$\\
 $$\begin{equation}
{\rm{HUH}} = \frac{{\left( {{T_d} - {T_{{\rm{base}}}}} \right)}}{{24}}\ ,\quad\quad {\rm{if}}\quad\,{T_{{\rm{base}}}} < {T_d} \le {T_{{\rm{opt}}}},
\end{equation}$$\\
 $$\begin{equation}
{\rm{HUH}} = \ \frac{{{T_{{\rm{opt}}}} - \left( {{T_d} - {T_{{\rm{opt}}}}} \right)*\left( {\frac{{{T_{{\rm{opt}}}} - {T_{{\rm{base}}}}}}{{{T_{{\rm{high}}}} - {T_{{\rm{opt}}}}}}} \right)}}{{24}}\ ,\quad\quad {\rm{if}}\quad\,{T_{{\rm{opt}}}} < {T_d} \le {T_{{\rm{high}}}},
\end{equation}$$
 $$\begin{equation}
{T_d} = \frac{{\left( {{T_{{\rm{min}}}} + {T_{{\rm{max}}}}} \right)}}{2} + \frac{{\left( {{T_{{\rm{max}}}} - {T_{{\rm{min}}}}} \right)*{\rm{cos}}\left( {0.2618\left( {h - 14} \right)} \right)}}{2},
\end{equation}$$
where T min, T max and h are the minimum, maximum air temperature and time of day, respectively.
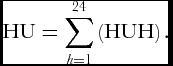
Finally, the daily increment in heat units or degree days (HU, °Cd) was calculated as
 $$\begin{equation}
{\rm{HU}} = \mathop \sum \limits_{h = 1}^{24} \left( {{\rm{HUH}}} \right).
\end{equation}$$
Water stress characterization
The SWC in all experiments was measured with a soil moisture capacitance probe at multiple dates during the crop cycle. These measurements were taken across the soil profile from 0.00 to 1.00 m, every 0.10 m. In order to compare the soil water deficit measurements between experiments, SWC from the first four layers, up to 0.40 m, which corresponds to the depth of UR's root system (Santos et al., Reference Santos, Stone and Vieira2006), were summed and then normalized by the respective soil water holding capacity (SWHC). This normalized SWC is referred to as the relative soil water content (RSWC). We considered that SWC between 85 and 100% of the SWHC (RSWC between 0.85 and 1.00) produced no stress in the rice plants. Therefore, RSWC ≤ 0.85 means that the rice plants were subjected to some degree of water stress.
Data analysis
The data were analysed using linear mixed effect (LME) models instead of the more commonly used linear models (LM), since LME models take into account the random intercept variability of model coefficients. Row spacing levels combined with block-within-environments, identify the subplots and were considered as a random effect, whereas row spacing, cultivar and environments were considered as fixed effects. Yield and yield components were the independent variables in the LME models and their linear and quadratic responses for row spacing were tested. The statistical model parameters were calculated by the maximum-likelihood method used in Wald's test, a parametric statistical test extensively used in linear mixed models to test the significance effect of model fixed effect terms or any subset of the parameter vector. This method was used to test the significance of linear and quadratic responses to row spacing. This statistical test is an asymptotic test, meaning that the distribution from which P-values are calculated for a finite number of samples draws on the distribution of the statistical test as the sample size grows to infinity (for further detail, see Pinheiro and Bates, Reference Pinheiro and Bates2000). All inferences were done at the 5% significance level. LME model analysis was performed using the R statistical software, ‘nlme’ package (Nonlinear Mixed-Effects Models, Pinheiro and Bates, Reference Pinheiro and Bates2000). Finally, we conducted a correlation analysis between yield and its components in order to discern possible interactions and compensation effects amongst them.
RESULTS
Variation in soil water deficit across environments
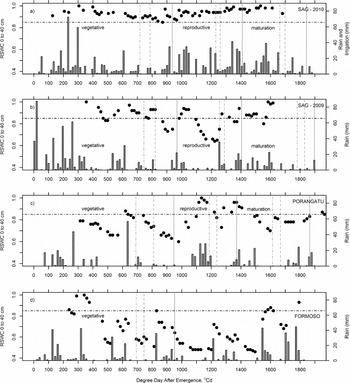
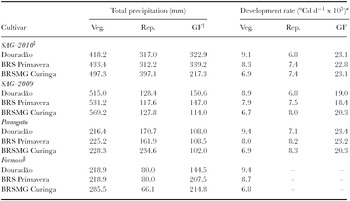
In general, results showed highly contrasting drought stress situations across experiments for the different cultivars (Figure 1). Due to these environmental differences, we use the words ‘experiment’ and ‘environment’ interchangeably, hereafter. As expected, for Santo Antônio de Goiás–2010 (SAG–2010), no significant soil water deficit was observed during the growing season (Figure 1a), with RSWC ranging between 0.85 and 1.0 throughout the UR cycle. Precipitation (rainfall + irrigation) was well distributed during the vegetative, panicle formation and grain filling phases for all cultivars in SAG–2010 (Table 1). In contrast to SAG–2010, the other three experiments suffered from varying degrees of water stress (Figure 1). For Santo Antônio de Goiás in 2009 (SAG–2009), soil water deficit occurred twice: first, between the beginning of the reproductive phase for cv. Douradão and BRS Primavera, and the end of the vegetative phase for cultivar cv. BRSMG Curinga, between 800 and 1000 °Cd (Figure 1b); and later and more severely, from 1100 to 1250 °Cd, at the end of the reproductive phase for the short-cycle cv. Douradão and BRS Primavera, and in the middle of the reproductive phase for cv. BRSMG Curinga. The RSWC was about 0.6 during the most intense soil water deficit period (Figure 1b). The early (vegetative) drought stress can be attributed to rainfall distribution, since total precipitation during the vegetative phase was higher than the best environment (SAG–2010) (Table 1, Figure 1b). Conversely, drought stress during the reproductive and grain filling phases occurred mostly due to low rainfall levels compared to SAG–2010 (Table 1).
Relative soil water content (RSWC, full circles [•]) and precipitation amount (mm, grey bars) for three cultivars, namely, Douradão, BRS Primavera and BRSMG Curinga and four environments: (a) Santo Antônio de Goiás 2009 (SAG–2009); (b) SAG–2010; (c) Porangatu and (d) Formoso. The black horizontal dot-dash line represents the threshold of the relative soil water content (RSWC = 0.85) below which we assume water stress conditions. Vertical grey lines represent the transitions between different phenological phases (vegetative, reproductive, grain filling) with different line types for each cultivar (dot-dashed line for cv. Douradão, dotted line for cv. BRS Primavera, and solid line for cv. BRSMG Curinga.

Accumulated precipitation and development rate for vegetative, reproductive and grain filling phases for all four experiments: Santo Antônio de Goiás (SAG) in 2009 (SAG–2009) and 2010 (SAG–2010) and Porangatu, in the state of Goiás, and Formoso, in the state of Tocantins, Brazil.

* Degree day.
† Veg.: vegetative; Rep.: reproductive; and GF: grain filling.
‡ Total precipitation in SAG–2010 includes supplemental irrigation.
§ Due to the severe water deficit and consequent variability amongst plants in each plot, the rainfall amount for the reproductive and grain filling phases is an approximation in this site.
In Porangatu, there were three different soil water deficit periods during the experiments, each occurring at a different phase (vegetative, reproductive and grain filling) for all cultivars (Figure 1c). Consistent with the water stress levels observed, precipitation in all phases was roughly half of that observed in SAG–2010. The most intense soil water deficit occurred in the period between the end of the vegetative and the beginning of the reproductive phases, between 700 and 1100 °Cd. In addition to low precipitation levels, low organic matter contents and a high percentage of sand in the soil likely contributed to the water stress in this region (Table S1).
In Formoso, UR cultivars experienced water deficit during virtually the entire growing period, with RSWC below 0.85 on more than 50 out of the 116 days. In this environment, severe water deficit during the reproductive phase, between 900 and 1200 °Cd, was observed. Severe water stress caused high variability between plants in the same plot, and this precluded an accurate definition of the reproductive and grain filling phases (Figure 1d). In this environment, precipitation during the vegetative phase was half of that observed for the same period at SAG–2010, whereas precipitation during the reproductive phase was only 80 mm. Formoso showed the lowest clay percentages in the soil (Table S1), suggesting that low clay contents also contributed to the water deficit observed.
Cultivar, environment and row spacing effects on yield and yield components
With an understanding of the variation in drought stress and phenological timing across the four environments where field trials were conducted, we now examined the cultivar-specific responses of yield and yield components to both environment and row spacing. We expected these responses to provide insights as to what genotype-specific traits are best for different environment-by-row spacing situations.
Panicle number per square metre
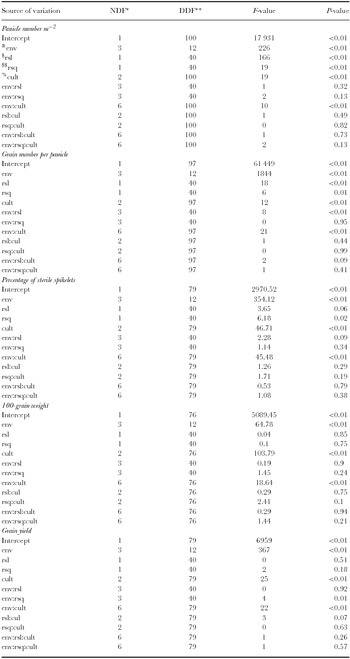
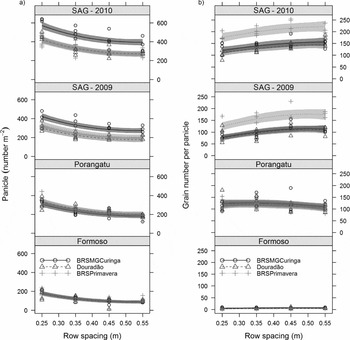
The number of panicles per square metre varied significantly depending on environment, row spacing (linear and quadratic), and cultivar (P ≤ 0.05; Table 2). The results indicated that the less the soil water deficit, the higher the panicle number m−2. More specifically, for the Santo Antônio de Goiás (SAG–2010 and SAG–2009), cultivar BRSMG Curinga presented the highest panicle number m−2, which is a consequence of the relatively high tillering numbers observed in these experiments. For Porangatu and Formoso, on the other hand, no significant differences were observed between cultivars for panicle number m−2. The only statistically significant interaction for this trait, however, was the environment × cultivar interaction (P ≤ 0.05), indicating that genotype performance for this yield component was highly dependent on environment, but not on row spacing. In fact, as seen in the Wald's test and shown in Figure 2a, the number of panicles m−2 behaved similarly across environments: the longer the row spacing, the lower the panicle number m−2.
Wald'sFootnote # test for evaluating the significance of fixed model factors on grain yield and its components, namely, panicle number m−2, percentage of sterile spikelets and 100-grain weight.

NDF* (degrees of freedom in the numerator); DDF** (degrees of freedom in the denominator); &env (environment); $rsl (linear row spacing); $$rsq (quadratic row spacing) and %cult (cultivar).
# For further detail about Wald's test, see Pinheiro and Bates (Reference Pinheiro and Bates2000).
Response curves for the effect of row spacing on (a) panicle number m−2 and (b) grain number per panicle for all environments (SAG–2010, SAG–2009, Porangatu and Formoso) and cultivars (BRSMG Curinga, BRS Primavera, Douradão). Dots represent the observed values for each row spacing (0.25, 0.35, 0.45 and 0.55 m), and lines correspond to the predicted values of the fitted Linear Mixed Effects (LME) models. Gray bands represent the 95% confidence interval around the average prediction.

Grain number per panicle
Apart from statistically significant effects from the environment, cultivar and row spacing (quadratic and linear), we found statistically significant effects from the environment-by row spacing and the environment-by-cultivar interactions (P ≤ 0.05; Table 2). Under no or low water deficit (SAG–2010 and SAG–2009), the grain number per panicle increased for all cultivars as a consequence of wider row spacing (Figure 2b). On the other hand, for environments with significant soil water deficit, as in Porangatu and Formoso, wider row spacing had very little or no impact on grain number per panicle. Differences in cultivar performance also varied across environments, with cv. BRS Primavera showing the greatest grain number per panicle in environments with lower water deficit (SAG–2010 and SAG–2009), but no significant differences between cultivars in the highest water deficit environments (Porangatu and Formoso) were observed.
Percentage of sterile spikelets
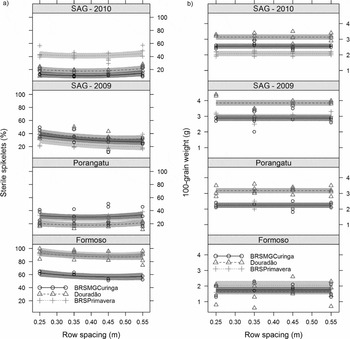
The percentage of sterile spikelets varied significantly depending on the environment, cultivar and row spacing (P ≤ 0.05). A significant interaction between environments and cultivars was also observed for this trait (Table 2). Row spacing did not affect the percentage of sterile spikelets for most environment–cultivar combinations, but it tended to decrease the percentage of sterile spikelets for all cultivars in SGA–2009 (Figure 3a). Conversely, this trait was largely affected by environmental conditions as well as by cultivar. In well-watered environments (SAG–2010), the lowest level of sterile spikelets was observed for cultivars BRSMG Curinga and Douradão. For all cultivars, a positive relationship between water deficit intensity and percentage of sterile spikelets was observed (Figure 3a). In Formoso, the highest number of sterile spikelets was observed for Douradão and BRS Primavera cultivars, indicating limited recovery from severe drought during the reproductive phase. In this location, BRSMG Curinga presented the lowest percentage of sterile spikelets, since this cultivar emitted new tillers when the rainfall returned after 1200 °Cd.
Response curves for the effect of row spacing on (a) Percentage of sterile spikelets and (b) 100-grain weight grain for all environments (SAG–2010, SAG–2009, Porangatu and Formoso) and cultivars (BRSMG Curinga, BRS Primavera, Douradão). Dots represent the observed values for each row spacing (0.25, 0.35, 0.45 and 0.55 m), and lines correspond to the predicted values of the fitted Linear Mixed Effects (LME) models. Gray bands represent the 95% confidence interval around the average prediction.

100-grain weight
For 100-grain weight, statistically significant variations across cultivars and environments, and statistically significant interactions between environment and cultivar were observed (P ≤ 0.05; Table 2). Conversely, no variation in 100-grain weight was observed across row spacings in any environment. Under well-watered conditions or even moderate water stress (i.e. in SAG–2009, SAG–2010, Porangatu), variations in 100-grain weight across cultivars were observed, with the traditional cultivar Douradão showing the highest 100-grain weight (Figure 3b). Under greater soil water deficit (Formoso), however, there was no difference between cultivars for 100-grain weight. In the most favourable environment for UR production (SAG–2010), the 100-grain weights observed were 3.28, 2.57 and 2.11 g, respectively for Douradão, BRSMG Curinga and BRS Primavera cultivars.
Grain yield
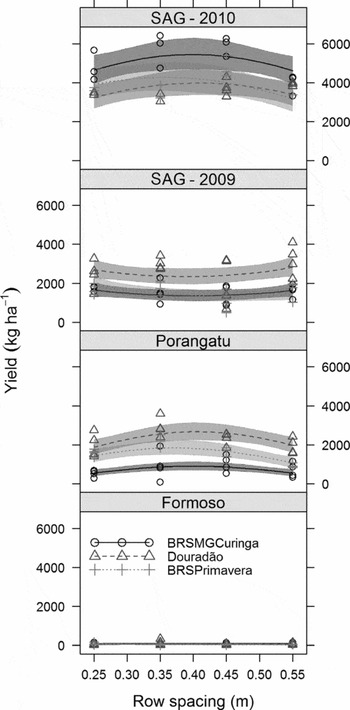
As expected, grain yield varied significantly across environments and cultivars. However, the average effect from row spacing was not statistically significant, suggesting that row spacing may not be as limiting as previously thought (Santos et al., Reference Santos, Stone and Vieira2006). A significant interaction between environment and cultivar was found (Table 2, Figure 4a), with the well-watered environments (SAG–2010) showing the highest overall yields. In SAG–2010, the most recently developed cultivar, BRSMG Curinga, showed the highest yield regardless of row spacing. As soil water deficit increased, yield decreased, with cv. Douradão presenting the highest yields in the SAG–2009 and Porangatu environments. Finally, at Formoso, where the most severe soil water deficit occurred, yields were close to zero for all cultivars, regardless of row spacing. We noted a statistically significant interaction between environment and row spacing (P ≤ 0.05), which was attributable to a slightly non-linear response between yield and row spacing in SAG–2010 and Porangatu, which was not observed in the other two environments. Whilst this response clearly indicates yield is somewhat responsive to row spacing, it also indicates the optimum value is likely around 0.4 m. This result suggests that wider row spacing could be beneficial to UR yield in SAG–2010 and Porangatu, and has no significant negative impacts on yields in the other two environments (SAG–2009, Formoso).
Response curves for the effect of row spacing on grain yield (kg ha−1) for all environments (SAG–2010, SAG–2009, Porangatu and Formoso) and cultivars (BRSMG Curinga; BRS Primavera, and Douradão). Dots represent the observed values for each row spacing (0.25, 0.35, 0.45 and 0.55 m), and lines correspond to the predicted values of the fitted Linear Mixed Effects (LME) models. Gray bands represent the 95% confidence interval around the average prediction.

DISCUSSION
Soil water stress impact on yield and yield components
Drought induces several changes in the rice plants, often leading to early flowering, changed source–sink relationships and, invariably, low grain yield. In this study, the duration of the panicle formation (reproductive) phase decreased as water deficit increased, primarily for the modern cultivars. BRS Primavera and BRSMG Curinga exhibited accelerated flowering under water stress. Bernier et al. (Reference Bernier, Atlin, Serraj, Kumar and Spaner2008) and Lafitte et al. (Reference Lafitte, Li, Vijayakumar, Gao, Shi, Xu, Fu, Ali, Domingo, Maghirang, Torres and Mackill2006) reported similar patterns for a number of short-cycle rice cultivars.
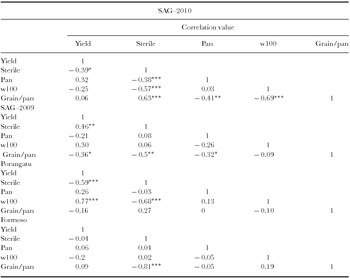
Under moderate water stress in Porangatu, grain yield showed a negative correlation with the percentage of sterile spikelets and a positive one with 100-grain weight (Table 3). The increase in percentage of sterile spikelets in the environments with soil water deficit was likely caused by the effect on the meiosis of the mother cell of the pollen grain, which reduces the number of fertile spikelets (Crusciol et al., Reference Crusciol, Arf, Soratto and Andreotti2003). In SAG–2009, we found an opposite response, with the correlation between grain yield and percentage of sterile spikelets being positive, and the correlation between grain yield and number of grains per panicle negative (Table 3). This distortion may be associated with the fact that cv. Douradão is more drought tolerant than the modern cultivars used in this study (Heinemann et al. Reference Heinemann, Stone and Fageria2011). Cv. Douradão showed slightly larger spikelet sterility but heavier grains, resulting in higher grain yield.
Pearson's correlation coefficient and P-values between grain yield and yield components for Santo Antônio de Goiás (SAG) in 2009 (SAG–2009) and 2010 (SAG–2010) and Porangatu, in the state of Goiás, and Formoso, in the state of Tocantins, Brazil.

Sterile – sterile spikelets; pan – panicle number m−2; w100 – 100-grain weight; grain/pan – number of grain per panicle. *P < 0.05, **P < 0.01 and ***P < 0.001 at Wald's test
Drought also reduced the 100-grain weight for all cultivars. This reduction was observed by comparing the results from SAG–2010, without water stress, to those with soil water stress, and it suggests that drought during the reproductive phase affected the translocation of assimilates from the leaves and stems to the grains; thus, changing the source–sink relationships of plants (Ji et al., Reference Ji, Wang, Sun, Lou, Mei, Shen and Chen2012). This behaviour was more significant for modern cultivars (cv. BRS Primavera, BRSMG Curinga) than for the traditional one (cv. Douradão), probably due to remobilization of stored carbohydrates, which is a characteristic more evident in traditional than in modern UR cultivars (Pinheiro et al., Reference Pinheiro, Castro and Guimarães2006). According to Heinemann et al. (Reference Heinemann, Stone and Fageria2011), cv. Douradão has higher stomatal closure at the beginning of the water deficit period which avoids desiccation. This behaviour led cv. Douradão to have higher yields in the environments where water deficit was moderate (SAG–2009 and Porangatu). In the well-watered environment (SAG–2010), however, the yield of cv. Douradão was likely limited by the early stomatal closure, which resulted in less carbon assimilation and photosynthesis, and less light interception due to plant architecture (Dingkuhn et al., Reference Dingkuhn, Laza, Kumar, Mendez, Collard, Jagadish, Singh, Padolina, Malabayabas, Torres, Rebolledo, Manneh and Sow2015).
Yield and yield component responses to row spacing
Statistically significant decreases in the rice panicle number m−2 as row spacing increased were observed in this study. Such results are consistent with previous studies (Crusciol et al., Reference Crusciol, Arf, Soratto and Andreotti2003; Hayashi et al., Reference Hayashi, Kamoshita and Yamagishi2006), and can be attributed to the competition for resources between plants. More specifically, as the number of seeds per area was kept the same, in the narrower row spacing, the number of plants per row was lower than in the wider spaced rows, resulting in stronger competition between plants in the wider row spacing (higher plant density per meter), leading to a lower number of panicles m−².
The increase in grain number per panicle in wider row spacing is related to the reduction of panicle number m−2. Such response may be a way for the plants to compensate for the lower number of panicles, in order to keep its yield stable. The negative correlation between these grain yield components (Table 3) in the most favourable environments (SAG–2009 and SAG–2010) seems to confirm this hypothesis. Under optimal conditions (water and nutrients), there is a trend to larger panicles with more spikelets (Baloch et al., Reference Baloch, Soomro, Javed and Ahmed2002; Hayashi et al., Reference Hayashi, Kamoshita and Yamagishi2006). However, under water-stress conditions, limits on sink size reduce the number of panicles per plant, grains per panicle, and the individual grain size, and increase the number of sterile spikelets (Figures 2–4). Reductions in the number of spikelets m−2 with increases in row spacing were found in this study, but as these were accompanied by increases in the number of grains per panicle and no changes in the remaining yield components or in grain yield, we attribute them to the direct interaction between the number of panicles per plant and the number of grains per panicle.
The percentage of sterile spikelets as well as of the 100-grain weight suffered little or no interference from the row spacing, as has also been reported by Baloch et al. (Reference Baloch, Soomro, Javed and Ahmed2002), Crusciol et al. (Reference Crusciol, Arf, Soratto and Andreotti2003), Hayashi et al. (Reference Hayashi, Kamoshita and Yamagishi2006) and Uddin et al., (Reference Uddin, Hasan, Ahmed and Hasan2010). Grain weight is a genetic trait, which depends mainly on the size of the husk of the cultivar, the grain formation during the grain filling phase and the environment. The genetic component of grain weight was expressed clearly in SAG–2010 (no water stress), with BRS Primavera showing lower grain weight than BRSMG Curinga (Jakelaitis et al., Reference Jakelaitis, Araujo, Pittelkow, Oliveira and Quaresma2009), but with greater water stress (i.e. SAG–2009, Porangatu). Sink size was limited by water availability, not allowing the grain weight genetic component expression and no difference in grain weight was observed between BRS Primavera and BRSMG Curinga.
Finally, we note no significant impact from changes in row spacing on grain yields. In Brazil, in the most favourable environments, higher grain yield was found in a row spacing of 0.30 m, which is a consequence of the higher panicle number m−2 (Crusciol et al., Reference Crusciol, Arf, Soratto and Andreotti2003). Chauhan and Johnson (Reference Chauhan and Johnson2011) reported higher grain yields in even narrower row spacing (0.20 m). Our findings suggest a different response, which could be attributed to the fact that the cultivars used by these authors were different (Apo and KSK-133, respectively), and were sown at a seed density of 100 kg ha−1, higher than the 60 kg ha−1, widely recommended in Brazil (Santos et al., Reference Santos, Stone and Vieira2006). In the present study, depending on environment and cultivar, there was either a positive or no impact on yield from increased row spacing, and the average effect on yield from row spacing was not statistically significant. These results suggest that grain yield was dependent on cultivar and environment, and not on row spacing. Based on this, farmers can grow UR in a rotational crop system with maize, soybean or cotton using the same drilling machinery. Another positive aspect associated with these results is that the increase of UR cropped area will decrease dependence in Brazil on the low land (flooded) rice cropped in the state of Rio Grande do Sul, in the south of Brazil, which represents 75% of total Brazilian rice production.
CONCLUSIONS
The results from this study allowed us to conclude that in the less stressful environments (SAG–2009 and SAG–2010), the modern cultivars BRSMG Curinga and BRS Primavera presented the highest grain yield. By contrast, in the environments with moderate to intense water stress (Porangatu), the traditional cultivar Douradão presented the best performance, regardless of the row spacing used. Importantly, results show no negative impact from wider row spacing on grain yield in any of the three environments for the three cultivars, although there was a non-linear positive (negative) association between the number of grains per panicle (number of panicles m−2) and the row spacing. We concluded that UR is a viable rotation for the soybean–maize systems, as the UR cultivars tested can be used with the same drills employed for soybean and maize sowing, with row spacing of 0.40 m, without noticeable yield losses.
Acknowledgements
This work was supported by the CNPq, project 471853/2010-0. JRV was supported by the CGIAR Research Program on Climate Change, Agriculture and Food Security (CCAFS).
SUPPLEMENTARY MATERIAL
To view supplementary material for this article, please visit http://dx.doi.org/10.1017/S0014479716000612