World War I marked the end of the first wave of globalization. The war years witnessed dramatic increases in freight rates and reductions of traded commodities in the world market. Because developing countries imported manufactured products, the resulting trade barriers might have served as a shelter for their domestic industrial firms. Did this temporary and unexpected trade disruption successfully promote industrial development in these countries?Footnote 1
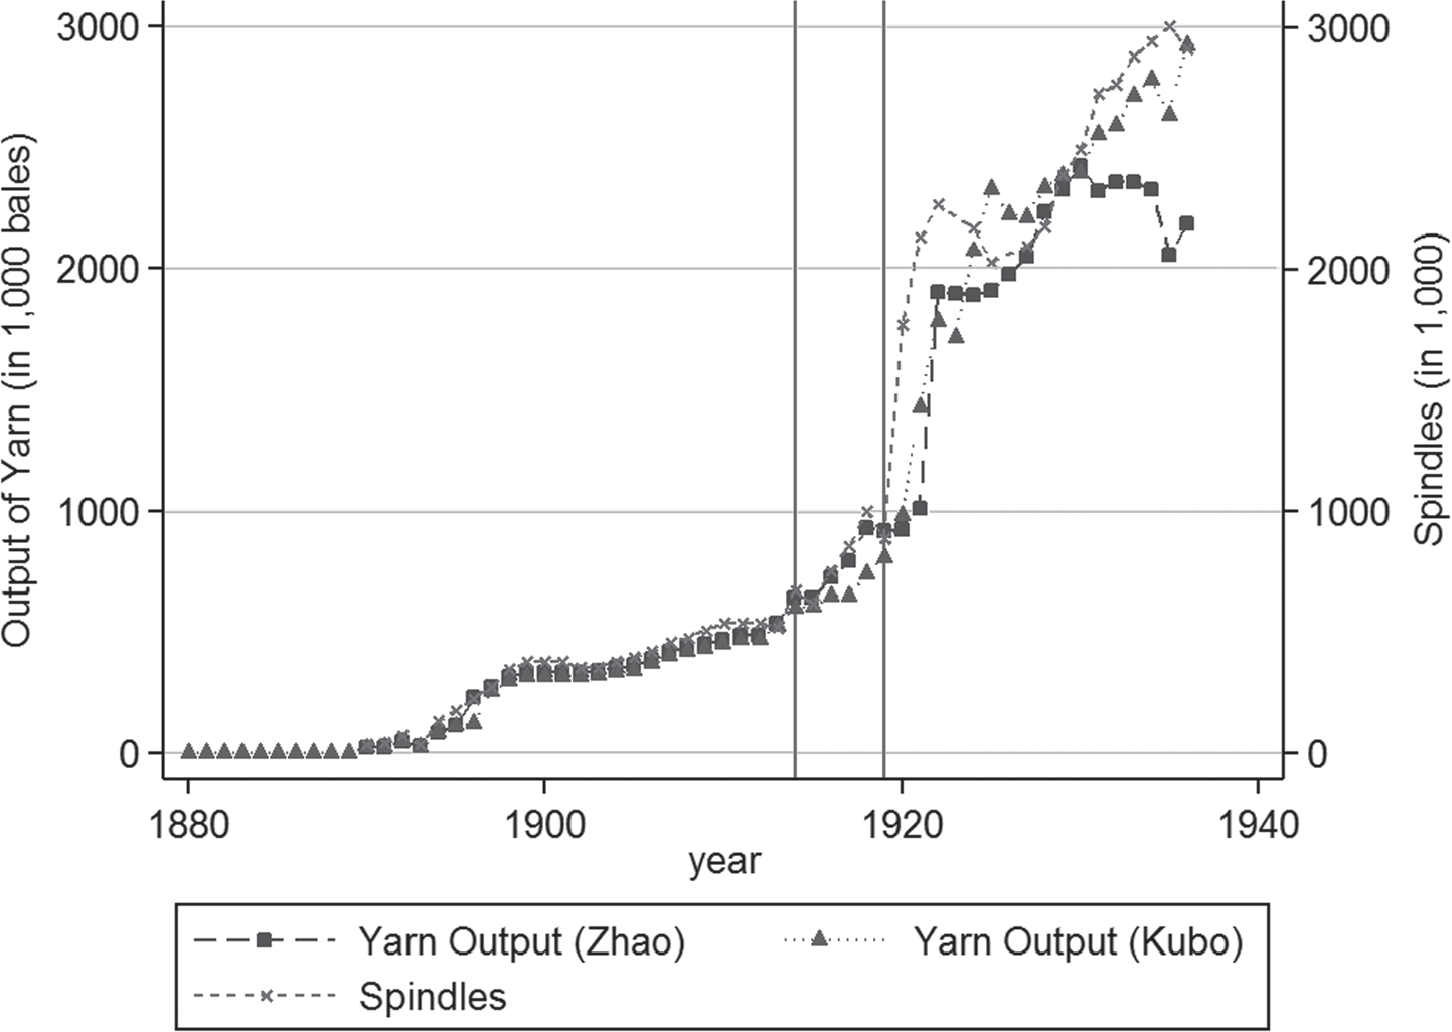
This paper studies the impact of World War I (hereafter WWI) on China’s manufactured textile industry. Textile production was among the first industrialized sectors in early twentieth-century China, and it accounted for 36 percent of Chinese industrial output by the 1930s (Rawski Reference Rawski1989). A closer look at the number of spindles, however, suggests that at first China did not have an advantage in this industry, nor did this industry grow at a constant speed. As Figure 1 shows, the number of spindles remained relatively stable from 1900 to 1914, started to grow during WWI, doubled from 1920 to 1923, and returned to a lower rate of growth in later years. Did trade disruptions from WWI contribute to the rapid growth around 1920? If so, why did the number of spindles increase after the war but not during the war? Apart from the trade shock, did other factors simultaneously affect firm entry?
YARN OUTPUT AND NUMBER OF SPINDLES OWNED BY CHINESE FIRMS

China’s experience during WWI and afterward is interesting to examine for three other reasons. First, the outbreak of WWI was exogenous to China’s industrial growth, and most areas in China were not directly involved in warfare. Second, because China was unable to levy a protective tariff until 1928, the tariff remained at a low level during the entire period studied (Mitchener and Yan Reference Mitchener and Se2014). This implies that the changes in import prices were independent of policy makers’ intentions. Third, Chinese counties had distinct conditions in access to trade and finance, and both factors were likely to affect firm entry. This setting provides useful variation to understand the pre-conditions for industrial growth.
I first show that the war can be viewed as a quasi-experiment that imposed an unexpected positive demand shock on China’s textile industry. Aggregated trade data indicate that the war disrupted China’s cotton yarn imports. With sharp increases in the international freight rate and reductions in the world supply, the import quantity of cotton yarn to China was reduced by half and its price doubled. The pattern of prices is consistent with the price series of cotton yarn in the world’s major countries, whereas the domestic prices of other necessities in China, such as food, barely increased. Data on individual textile firms show that firms capitalized on this opportunity and earned sizable profits.
After establishing that the war reduced cotton yarn imports, I compile a county-level dataset from 1907 to 1925 and quantitatively examine whether this reduction generated textile firm entry. To capture the intensity of the trade shock, I construct a transportation network and calculate each county’s transport cost to ports as a measure of exposure to international trade. Combining this measure with the WWI shock, I conduct a difference-in-differences analysis to compare whether counties facing more intense shocks from international trade also had more textile firms during and after WWI. The results confirm the hypothesis but find that the greatest effect was around 1919 and 1920. The estimates are robust to multiple specifications and the choice of different datasets.
I then investigate the reason for this late entry. Combining information from firm archives, trade data, and British textile machinery transactions, I find that textile firms in China mostly relied on overseas machinery during this time. The war, while providing a profitable opportunity for these firms, also hindered the import of machinery. Data from Wright (Reference Wright2011) show that, while the Chinese firms still ordered textile machinery from Britain during the war, the actual shipment of the machinery was very limited until the war was over. This delay was undesirable for Chinese entrepreneurs, who complained about the resulting loss of potential revenue.
I also present suggestive evidence on the heterogeneous impact of local characteristics on firm entry, especially the role of access to finance. Narrative evidence suggests that the examined textile firms often faced capital constraints and relied on bank loans for daily operations and expansion. In addition, bank notes formed a network that reduced transaction cost and facilitated trade, which was particularly important for Chinese firms that operated using imported machinery from overseas and transported raw cotton from distant counties. The regression results show that the prewar distribution of financial institutions was positively correlated with the entry of new firms.
This paper closely relates to studies that evaluate the effect of trade protection policies, especially import substitution. The underlying theory of such policies is the “infant industry” argument that some industries have increasing returns to scale and that small domestic firms in the early stage are unable to compete with large foreign firms; temporary trade protection might provide these firms with an opportunity to reach an efficient scale. The literature has found mixed results regarding industrial policies grounded in this argument (Harrison and Rodríguez-Clare Reference Harrison and Rodríguez-Clare2010; Hanlon Reference Hanlon2017; Juhász Reference Juhász2018). Economic historians have taken advantage of war-led trade barriers to identify the impact of temporary trade protection on industrial growth or the direction of technological adoption (Tomlinson Reference Tomlinson1979; Irwin and Davis Reference Irwin and Davis Joseph2003; Irwin Reference Irwin2005; Hanlon Reference Hanlon2015). A study that is closely related to this paper is that of Juhász (Reference Juhász2018), who collected firm-level information and used trade blockades due to the Napoleonic War as an innovative exogenous shock to show that temporary trade protection had a positive and persistent effect on domestic industrial growth. What remains unclear in the literature is whether the policy would succeed in developing countries that often lack supportive institutions and upstream sectors for industrial growth (Rodrik, Arvind, and Francesco Reference Rodrik, Arvind and Francesco2004). This paper provides new evidence in the context of a developing country without a domestic machinery sector or sufficient capital.
The location of industries has received increasing attention from both theoretical and empirical perspectives (Krugman Reference Krugman1991; Geroski Reference Geroski1995). Many discussions focus on the textile industry, which played a leading role in the Industrial Revolution (Allen Reference Allen2009). Using newly compiled information for this industry in 1838, Crafts and Wolf (Reference Crafts and Wolf2014) find that geographic factors, a history of textile inventions, proximity to ports, and access to markets determined the location of textile firms in the United Kingdom. This paper shows that, in a developing country with an open market, exposure to international trade and intermediaries in finance were likely to facilitate firm entry. The finding that financial institutions contribute to industrial growth is consistent with other studies that have discussed the effects of financial institutions on local capital accumulation (King and Levine Reference King and Ross1993), new firm entry (Guiso, Sapienza, and Zingales Reference Guiso, Sapienza and Zingales2004), and the formation of the manufacturing belt in the United States (Jaremski Reference Jaremski2014).
Finally, this paper contributes to the literature on China’s pre–World War II (WWII) industrial development by examining the nascent industrial sector in the 1910s. This is the period when most of China’s modern industries were first established, but it has been largely overlooked in the literature due to limited available data.Footnote 2 Using a newly constructed transportation network and firm-level data, I show that WWI created favorable market conditions and promoted firm entry around ports. This conclusion echoes studies that justify the leading position of treaty ports, especially Shanghai, in China’s industrialization or urbanization (Ma Reference Ma2006, Reference Ma2008; So and Meyers Reference So, Meyers, So and Myers2011; Keller, Li, and Shiue Reference Keller, Li and Carol2013; Jia Reference Jia2014), but provides an explanation from the perspective of import substitution.
CHINA’S INTERNATIONAL TRADE AND COTTON YARN INDUSTRY BEFORE WWI
The handicraft textile industry prevailed in China for centuries before the arrival of manufactured yarn. When China adopted a more open trade policy in the nineteenth century, imported manufactured yarns demonstrated a clear advantage in price over handicraft ones and gradually took over the market. Efforts to build China’s own manufactured textile firms began in the 1860s and initiated by officials, but the real boom of this sector waited until private firms entered the market around the 1900s.
China’s International Trade
China implemented a set of highly restrictive international trade policies and remained relatively closed in the early nineteenth century. Trade with European countries was small compared to other economic activities and faced strict regulations. In 1840, conflicts between British merchants and local Chinese officials led to the outbreak of the Opium War. After losing the war, the Chinese Government in 1842 was forced to sign the Treaty of Nanking, which reduced tariffs and opened five ports to international trade. Later, additional treaties were signed, which established more ports, a British-governed Maritime Customs Service, and a flat low tariff rate. By the beginning of the twentieth century, 45 ports were opened (Yan Reference Yan2012). The real trade value stayed roughly the same from 1868 to 1900 and steadily grew afterward. In 1930, the real trade value was 7.72 times the value in 1900.Footnote 3
Cotton yarn was among the first group of foreign commodities accepted by the Chinese. As early as 1880, “many parts of the Chinese Weavers prefer Foreign Cotton Yarn to the Chinese [ones]” (China Maritime Customs 1881, p. 24). Its import quantity increased steadily from 1880 to 1913, with an average annual growth rate of more than 9 percent.Footnote 4 It is estimated that approximately 64 percent of the cotton yarn consumed in China before WWI was imported (Fang Reference Fang2011, p. 287).
Chinese Cotton Yarn Industry
Handicraft textile production was an important secondary activity for farmers across China by the nineteenth century. Indian Cotton (or Asian Cotton) was first introduced to South China before 500 BC and spread to North China in the thirteenth century. To produce a piece of cloth, a worker first cleaned the cotton to remove cotton seeds and dirt, and carded it for spinning. The second step was to make cotton yarn from the prepared cotton using spindles, and the third step was to weave cloth from cotton yarn using looms. The traditional handicraft sector required heavy labor inputs. To produce a piece of cloth with a width of 0.4 meters, length of 6.67 meters, and weight of 1 kilogram, a very skilled Chinese worker spent approximately six working days, with one, four, and one days for the three steps, respectively (Xu Reference Xu1992, p. 51). Spinning was so costly partially because most handicraft spinning wheels only had a single spindle. Therefore, when textile machines allowed for multiple spindles at the same time, manufactured yarns easily demonstrated advantages over the handicraft ones. In fact, Yan (Reference Yan2011) believes that productivity in the machinery yarn sector was 80 times that in the handicraft spinning sector when measured by output per labor, whereas productivity was only four times higher when using machinery looms to replace handicraft ones.
Facing shocks from imported manufactured yarn, the Chinese started to build their own manufactured textile industry during the second half of the nineteenth century. Early efforts came from the government, including setting up manufactured textile companies in Shanghai and Hubei (Shanghai Jiqi Zhibuju and Hubei Zhibuju) in the late 1880s. These factories faced difficulties in funding and management (Perkins Reference Perkins1967) or survived at the expense of prohibiting the entry of private firms (Institute of Shanghai Economy Studies 1958a); they had limited impact on the overall economy. In 1895, as the Treaty of Shimonoseki allowed foreigners to erect factories in China’s ports, the resulting total number of foreign firms increased from 603 in 1895 to 1,006 in 1900 and 2,863 in 1911 (China Maritime Customs 1913). These firms brought foreign capital, technology, and management skills that stimulated the growth of the domestic industrial sector. The government also encouraged the entry of private enterprises during this time.Footnote 5
As Figure 1 already suggests, the boom of the manufactured textile industry took place after 1913. From 1913 to 1930, Chinese yarn dramatically increased from 0.53 million bales to 2.4 million bales (Kubo Reference Kubo2004). Because most products were consumed by the local market, the ratio of yarn produced in China to domestic yarn consumption increased from 36 percent in 1913 to 102 percent in 1930 (Fang Reference Fang2011, p. 287), indicating that China switched from being a yarn importer to a self-sufficient producer and even an exporter.
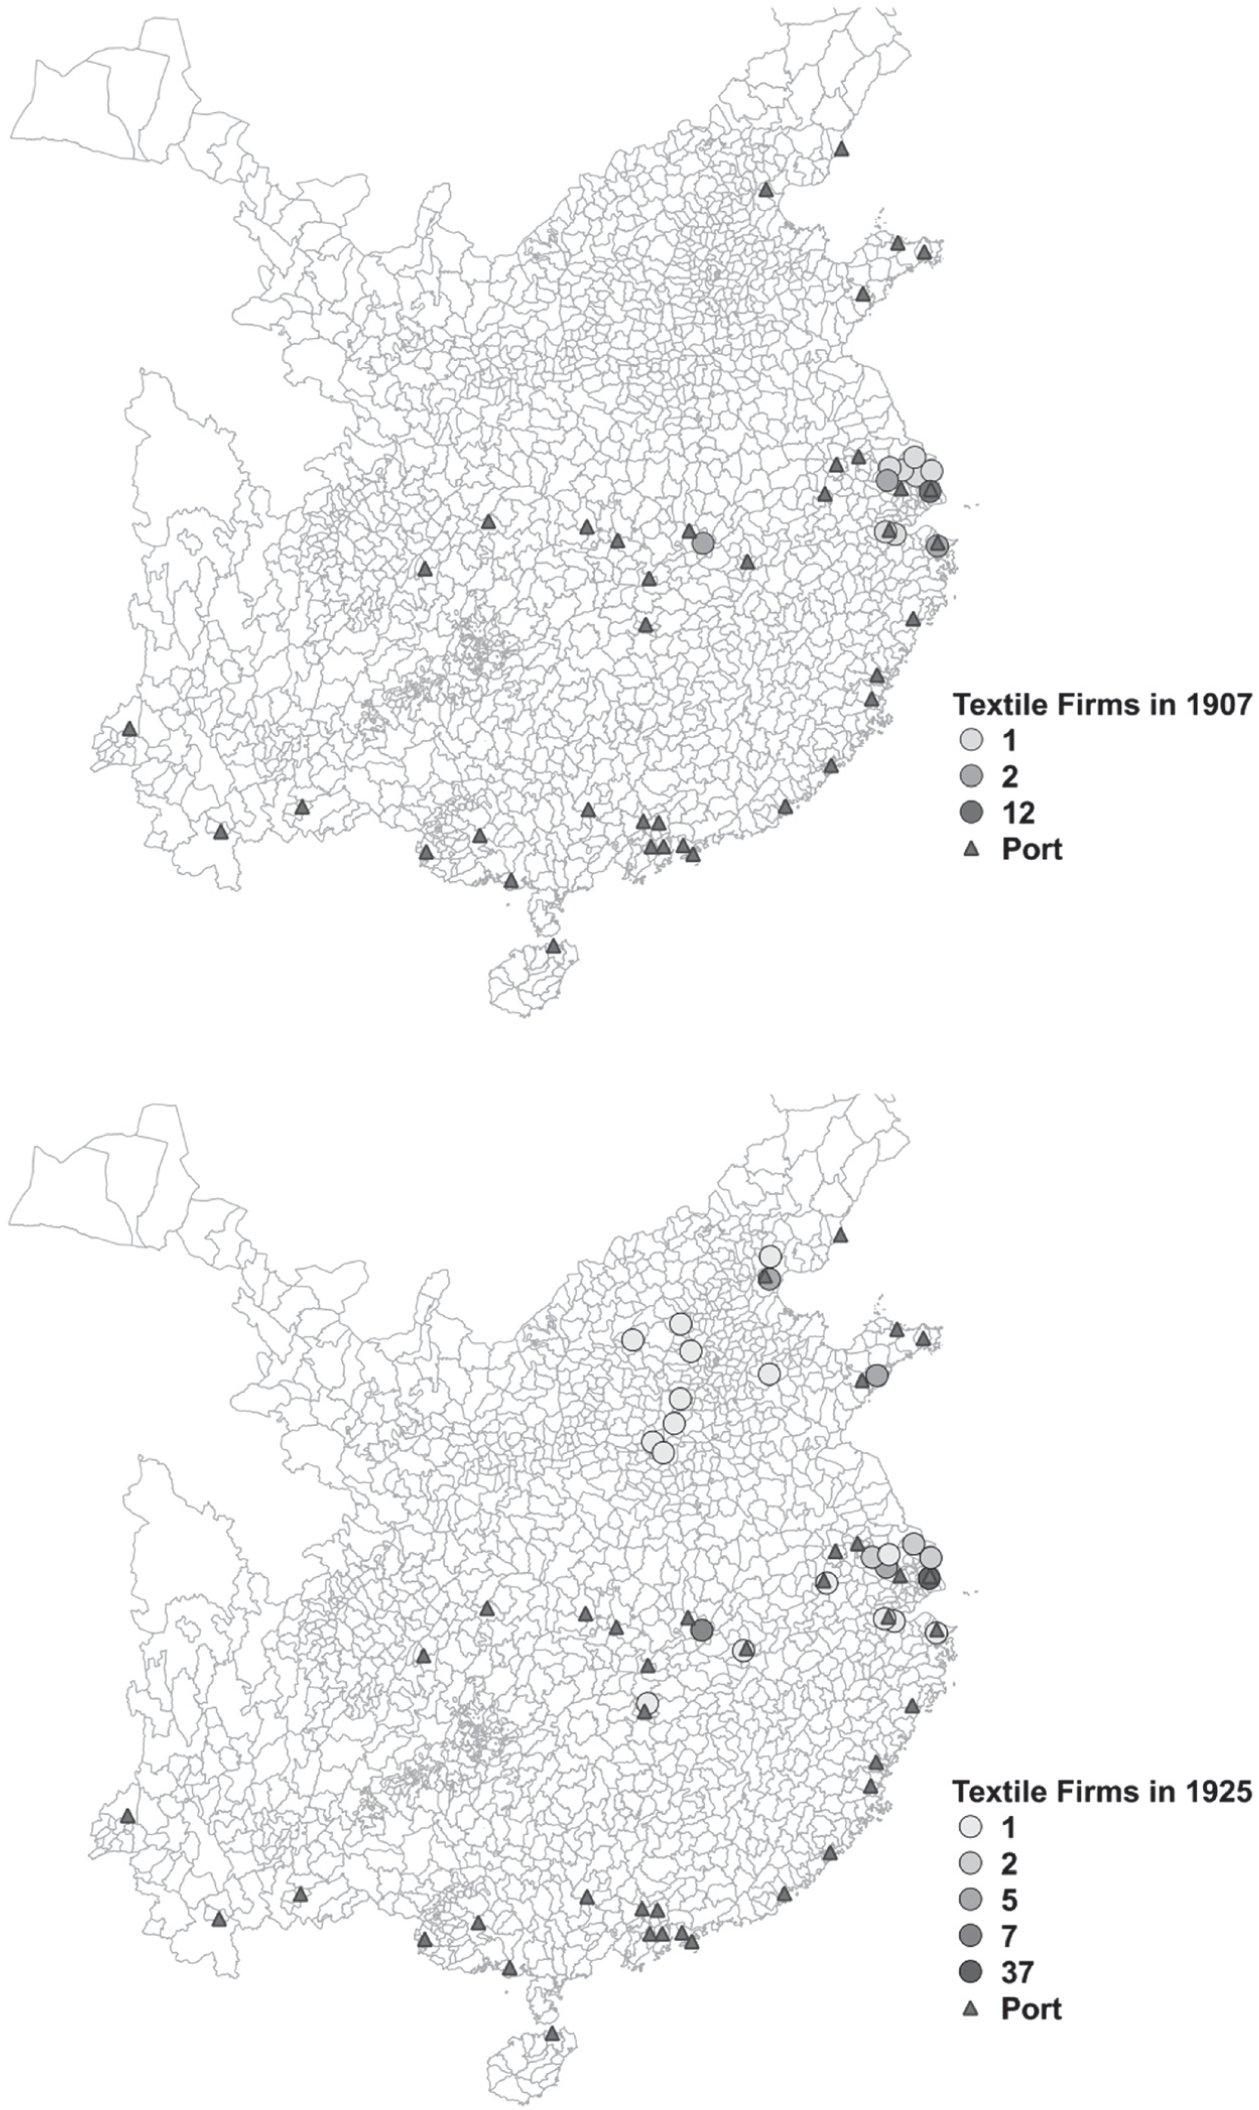
Along with the growth of total production, the location of textile firms also changed over time. Figure 2 depicts the distribution of ports and firms in 1907 and 1925. The triangles indicate the location of treaty ports, which remained the same during the study period.Footnote 6 The circles represent the textile firms, among which the darker ones suggest more firms. At the beginning of the period under study, textile firms were mostly located close to Shanghai. Ultimately, they spread to multiple other cities, especially the ones located close to ports. This is consistent with the hypothesis that shocks from international trade might have affected firm entry.
DISTRIBUTION OF TEXTILE FIRMS AND PORTS IN 1907 AND 1925

Local characteristics were likely to drive firms’ locations as well. Textile firms in China heavily relied on intermediaries in finance and trade to acquire inputs, especially machinery and raw cotton. A survey in 1918 on textile firms in Jiangsu Province, where most firms located, showed that all textile machinery was imported, of which 90 percent was from Britain (Fang Reference Fang2011, p. 97). Another major input for textile production was raw cotton, whose quality directly related to the quality of yarn. While some firms deliberately chose to locate in counties suitable for raw cotton growth, most raw cotton was not consumed locally in as early as the 1910s. Rather, the harvested raw cotton was transferred and sold to large cities by cotton brokers (hua hang) through well-functioning commercial networks. As a typical example, 80 percent of the raw cotton grown in a small county in North China was carried and transferred to large cities 100 to 150 miles away, leaving only 20 percent for local consumption.Footnote 7 Some firms also imported raw cotton from India or the United States. These transactions usually required financial institutions, which formed an exchange network of bank notes and provided credit.
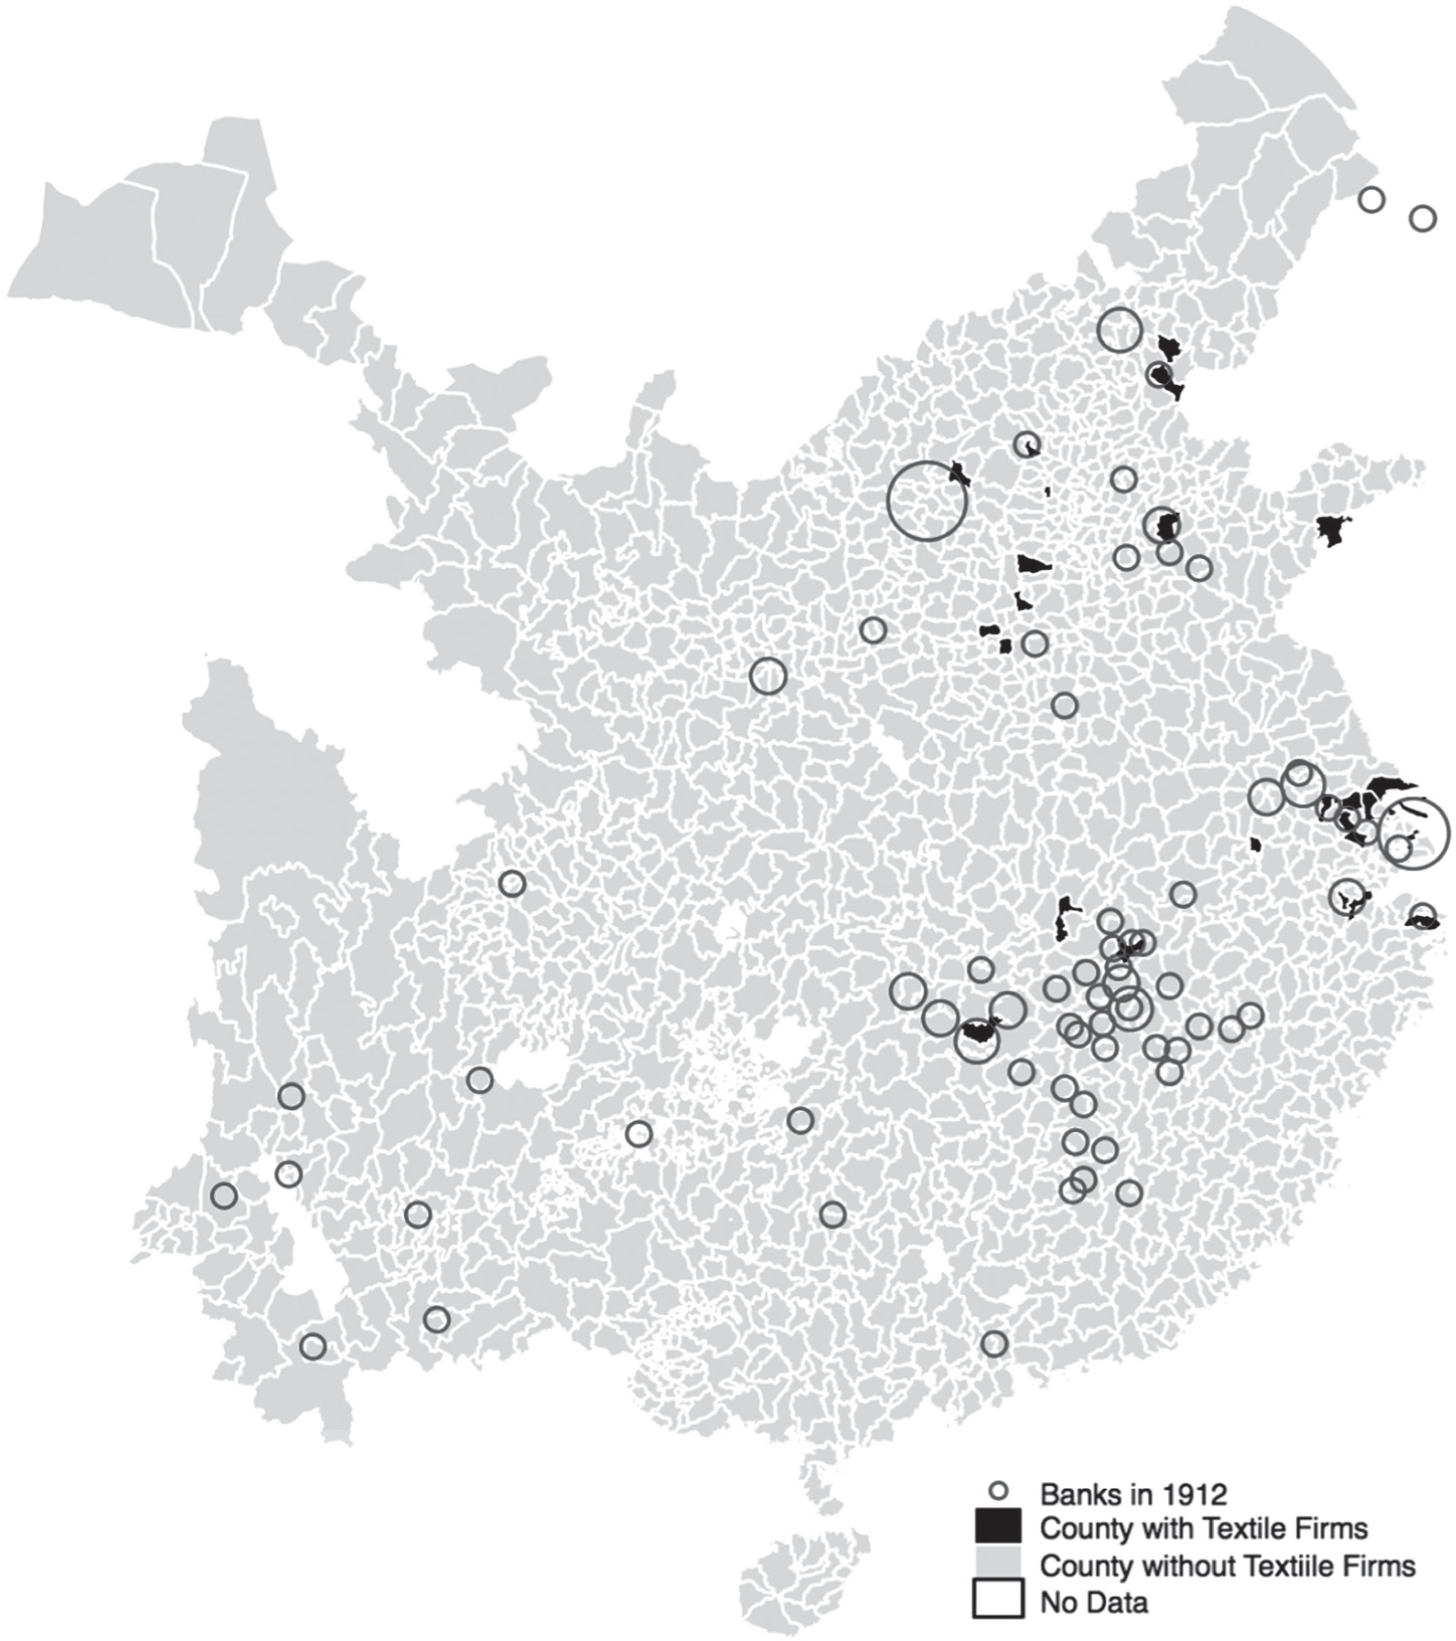
Shortage of capital was another obstacle for the Chinese firms, one that haunted every stage in the growth of a textile firm. Entrepreneurs usually faced difficulties in fully collecting the required capital when starting a business. Once profits were earned, shareholders often requested dividends immediately rather than leaving sufficient reserves for future investments. For example, from 1902 to 1914, the textile firm Dasheng gave 64.7 percent of its profits to shareholders and 13.5 percent to staff, while only 16.8 percent was saved for the firm’s development (Gu Reference Gu2015, pp. 45–46). This firm had to rely on loans for activities involving large monetary transactions, including purchasing raw cotton and acquiring machinery. This was, in fact, a common practice for most textile firms, suggesting that intermediaries in finance were essential complements for firms’ operations.Footnote 8 Figure 3 plots the location of textile firms in 1925 and banks in 1912. Dark areas indicate that the county had at least one textile firm and larger circles represent more banks. Counties with more banks before the war tended to have more textile firms at the end of the study period.
DISTRIBUTION OF TEXTILE FIRMS AND BANKS

In addition to access to inputs, political chaos and foreign concessions might have affected the location of firms. The examined period witnessed constant political turmoil that might have discouraged private investments. During this time, foreign concessions were enclaves managed by foreigners and under western institutions. They usually had better protection of property rights and attracted more industrial investments.Footnote 9 For example, the largest foreign concession, Shanghai, also contributed 41 percent of national manufacturing output in the 1930s and owned more than 50 percent of cotton spindles during the study period (Ma Reference Ma2006, Reference Ma2008).
MEASURES OF THE TEXTILE INDUSTRY, TRADE SHOCK, AND LOCAL CHARACTERISTICS
To examine the impact of import reduction due to WWI on the textile industry, I compile information on the development of the domestic textile industry, the trade shock, and local characteristics from archives and secondary sources. In addition, I construct a new transportation network before WWI to measure access to trade for the years 1907 to 1925. This period is chosen to avoid the surge of new firms due to the New Policies instituted in 1905 and the disruptive effects caused by the large-scale fighting between the Kuomintang and the warlords starting in 1926.
Measures of the Textile Industry
Limited information is available for the cotton textile industry in the 1910s because most surveys of this industry were conducted after 1919 (see Zeitz (Reference Zeitz2013) for a review). I collect records of firm entry and exit from a secondary source and aggregate the data to the county level. To check how sensitive the results are to data quality, I compare estimates using separately constructed records.
The baseline analysis relies on Yan’s (Reference Yan2011) collection of entry, acquisition, merger, and exit of each mill. These data record the founding time, years of actual operation, changes in names, and year when each mill ceased operating. I aggregate the data to the county level and obtain the number of textile mills in operation each year. Because this dataset traces the entry and survival of individual textile firms, it captures the “extensive margin.” There were 99 firms during the examined period. As an alternative measure of the textile industry, I also use the investments of new textile firms compiled by Du (Reference Du1991) to ensure that the analyses are not sensitive to the choice of data source or outcome variable. Du (Reference Du1991) independently collected information of industrial firm entry before 1927 from official reports, Japanese surveys, and firms’ archives. This dataset reports the name, year of establishment, location, initial capital invested, and founders of 109 textile firms.Footnote 10 Because it only observes firm entry and no exit, I use it as a robustness check.
In addition to using historical data, I also examine two individual firms’ experience to provide qualitative evidence about the entrepreneurs’ constraints and decision processes. These firms are chosen due to their rich archives and distinct background. Table 1 summarizes the owners, year established, and scale of the two firms. The first firm, Dasheng, was among the earliest domestic textile firms in China. Its founder, Zhang Jian, had a government-related background. This firm performed well before 1922 but experienced serious crises when the market was down from 1923. I cite Gu’s (Reference Gu2015) detailed analysis of Dasheng’s economic archives. The second firm, Shenxin, was founded by two merchants, the Rong brothers, in Shanghai in 1916. It entered the market later but became the largest Chinese textile enterprise before 1937. Its archives, including account books, balance sheets, and entrepreneurs’ diaries, are compiled and published by the Shanghai Social Science Academy (1980). I also supplement the qualitative analysis with descriptive studies of textile firms’ daily operations (Fang Reference Fang2011), financial constraints (Yan Reference Yan2011), performance during the war (Tokihiko Reference Tokihiko2010), and commercial network (Brasó Broggi Reference Brasó Broggi2016).
INFORMATION OF INDIVIDUAL FIRMS

Sources: Yan (Reference Yan2011); Shanghai Social Science Academy (1980).
The Trade Shock
I capture the trade shock using information on two dimensions. The time-series variation reflects fluctuations in the import of cotton yarn. I also exploit spatial variation, coming from differences in access to international trade at the county level.
The overall volume and quantity of traded cotton yarn are obtained from the annual reports of the China Maritime Customs Service (CMC), which was a government agency operated by British officers during the examined period. Its main task was to collect tax revenues from China’s international trade. The CMC published yearly reports on the quantity and value of each traded commodity, tax revenues, and trade value of each port. Every ten years, it published another series of reports, including a summary of economic conditions in each port and the average trade values of important commodities, including cotton products. These reports provide detailed information about international trade in pre-modern China, and they are acknowledged by scholars to have high-quality data.Footnote 11
I collect data from the CMC to capture different dimensions of textile trade. For the world price, I digitize the import quantity and value of cotton products at the national and the port level and use the information to calculate the value per unit of yarn as a proxy for the yarn price. The analysis uses data at the national level, but as Online Appendix Figure 1 illustrates, the per unit value of imported yarn moved very closely across different ports.Footnote 12 I also collect the number of foreign vessels entering China to illustrate the impact of WWI on trading activities.
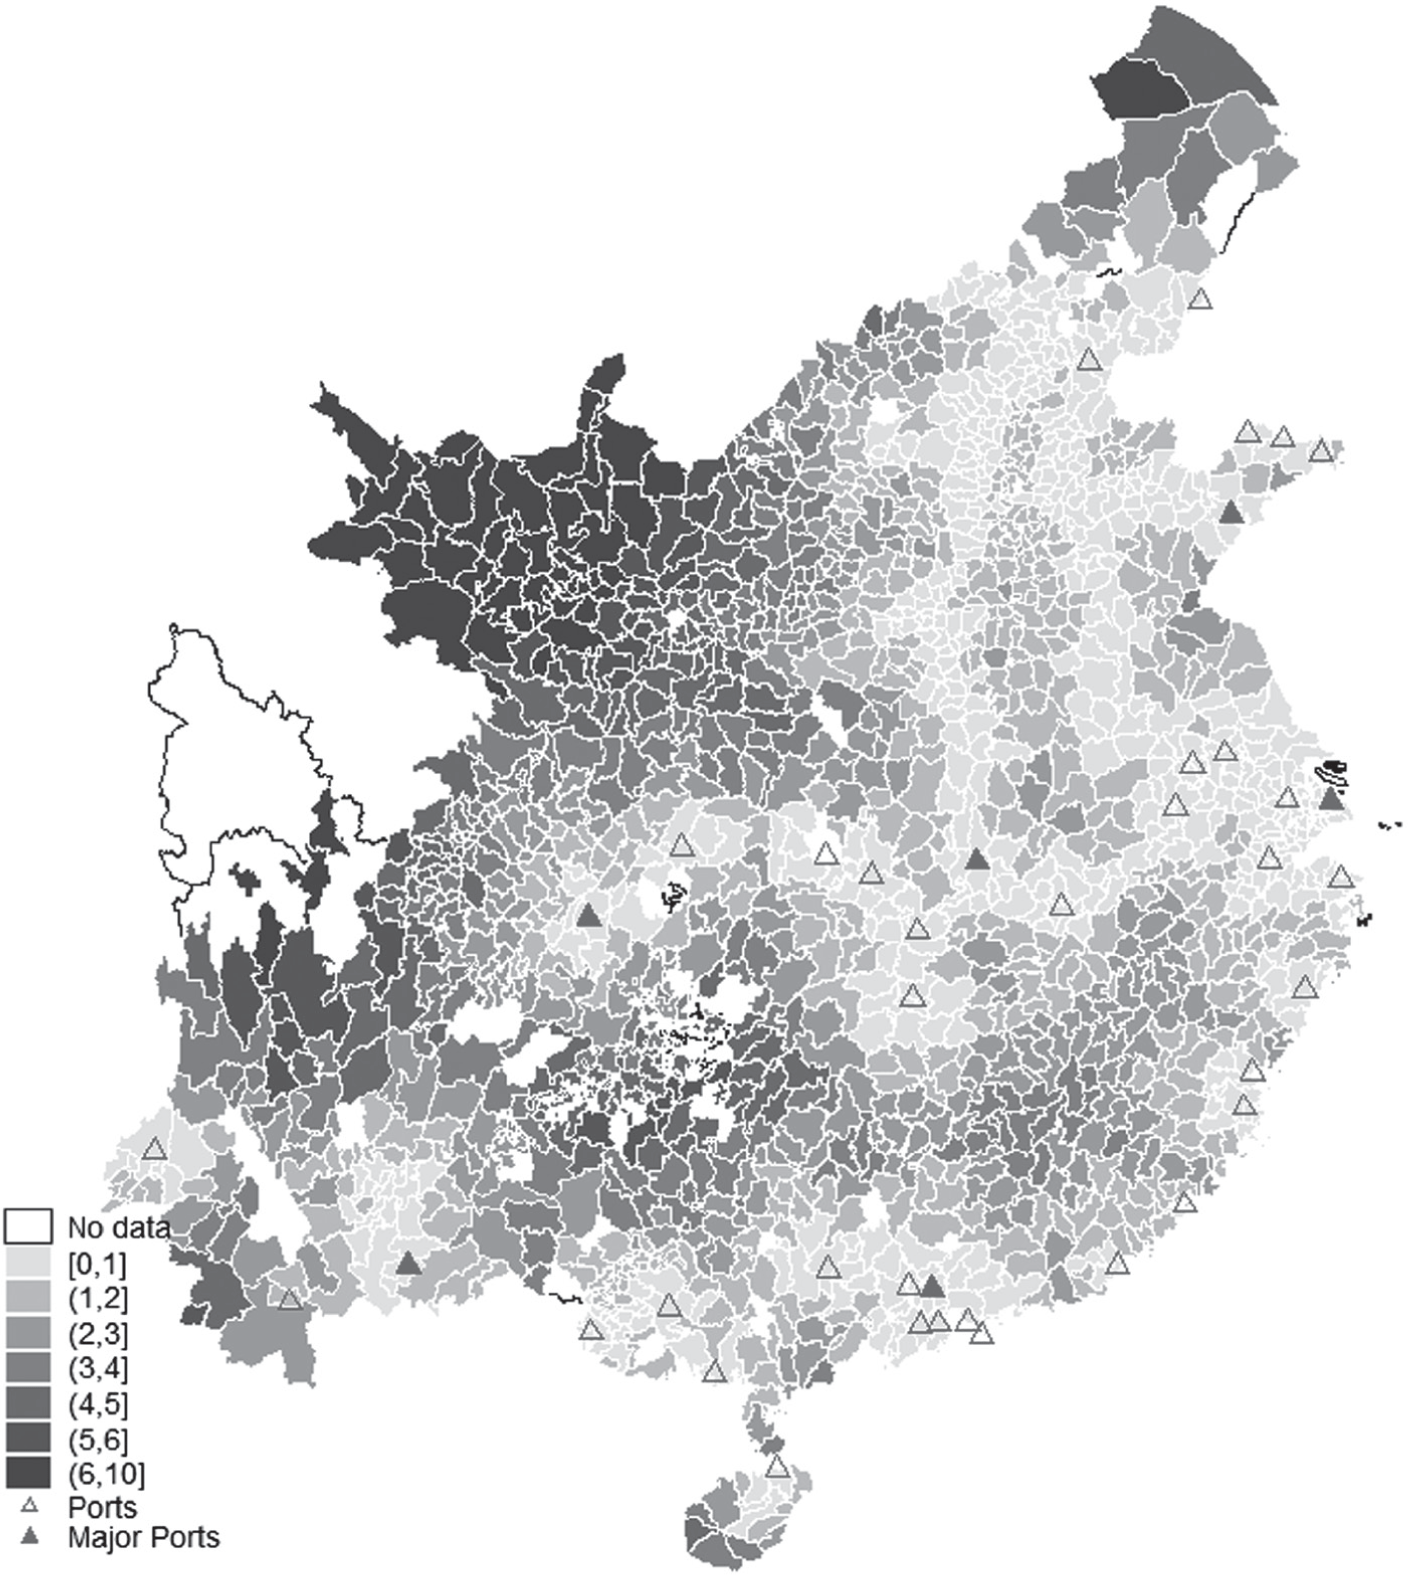
To measure access to international trade, I construct a transportation network for China by combining information on major transport routes, including rivers, railroads in 1913, and historical courier roads. The network of river and courier routes comes from the latest version of the China Historical Geographic Information System (CHGIS) (Harvard Yenching Library 2016).Footnote 13 The railroad network is digitized using the map by the United States Central Intelligence Agency (1954) and assigned the order of availability based on accomplishment times recorded in Zhongguo tiedao jianshe shilue (1876–1949) (A Brief History of Railroad Construction in China (1876–1949)) (Zhang Reference Zhang1997).Footnote 14 After combining all the routes and setting a transportation speed to each type of route, I calculate the transportation cost between a given county to all ports on the map and locate the port with the lowest cost in terms of time. This measure is similar to the “effective distance” used in Juhász (Reference Juhász2018). Figure 4 depicts the cost to ports in days. More than 60 percent of the counties could access ports within three days.
TRANSPORTATION COSTS TO PORTS (IN DAYS)

To address the concern that access to large ports might have had different effects than access to small ports, I also calculate the cost to six major treaty ports, selected based on their importance in cotton yarn trade. Located across China, these six ports together contributed more than 40 percent of yarn imports during this period. In fact, the import of cotton yarn was not dominated by an exceptionally large port but rather evenly distributed across at least 15 ports.Footnote 15 The dark triangles in Figure 4 represent the location of major ports.
Local Conditions
In addition to access to trade, local conditions were likely to affect firm entry. I collect data to quantify factors that entrepreneurs often considered when setting up a firm during this period. These factors are financial institutions, geographic suitability for textile production, and political chaos.
The first set of variables measures financial institutions. In this period, financial institutions were composed of traditional banks, Chinese banks structured under western institutions (hereafter modern Chinese banks), and foreign banks. Online Appendix B presents a brief discussion of their differences. The data on the first two types of banks come from the survey in 1912 by the Bureau of Agriculture and Commerce (1914), which reports capital for modern Chinese banks at the branch level and the number of traditional banks in each county. I use the data in 1912 because this is the only year where the branch information is available. The location of foreign banks’ headquarters is collected from Waiguo zaihua gongshang qiye cidian (The Universal Dictionary of Foreign Business in Modern China) (Huang Reference Huang1995). A benefit of using the cross-sectional distribution of financial institutions is to address the concern that the location of banks might have responded to firm entry. I check the correlation of bank capitals from 1912 to 1921 to ensure that banks’ locations in 1912 are a valid proxy for the later locations.Footnote 16
I control for whether a county’s indigenous characteristics were suitable for textile production using two indicators. The first indicator is whether a county was a historical center of handicraft textiles. I use the location of handicraft textile centers in the eighteenth century presented by Guo (Reference Guo1990) and identify approximately 50 counties as historical textile centers. The second indicator is geographic suitability for cotton growth. I collect this information from the Global Agro-Ecological Zones (GAEZ), a data portal developed by the Food and Agriculture Organization (FAO) (2012).Footnote 17 The original data report suitability in eight levels for a 50 × 50 km2 cell, and I calculate the mean of all cells in a given county. The data show that northern counties are more suitable for raw cotton growing (Online Appendix Figure 2).Footnote 18
The last set of control variables addresses political turmoil. The county-level locations of political chaos are constructed from Zhonghua minguo junshishi (The Military History of the Republic of China) (Jiang Reference Jiang2009), which describes the time, location, parties involved, and leaders of army battles in major domestic military conflicts since 1911.Footnote 19 The locations of foreign concessions, the peace shelters during chaos, are from Yan (Reference Yan2012), who provides a list of all foreign concessions in China.
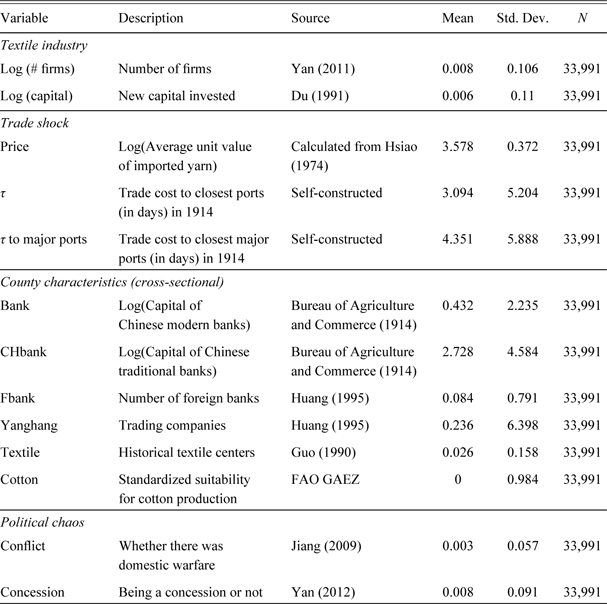
Table 2 reports the summary statistics for the variables. The first panel presents the variables capturing industrial performance at the county level. The second panel lists the measure of the trade shock. The last two panels show the control variables, including county characteristics and indicators for political chaos and foreign concessions.Footnote 20
SUMMARY STATISTICS

Sources: Sources are provided in the table.
IMPACT OF WWI ON TEXTILE TRADE
WWI began in July 1914 and lasted until November 1918. The war disrupted production of commodities in Europe and hindered commercial activities in the global market. Export data from Mitchell (Reference Mitchell1988, pp. 356–57, Textiles Table 16) show an apparent decline in the export quantity of British cotton yarn. As the world’s largest industrialized economy and yarn producer, Great Britain’s exports of twist and yarn averaged 217 million pounds from 1905 to 1913. The number dropped to 178 million in 1914 and continued to fall until it reached 102 million in 1918.
Meanwhile, international trade became more expensive. The real international freight rate index doubled from 1914 to 1915. From 1915 to 1917, the freight rate index further rose 60 percent per year and reached its peak from 1917 to 1918, which was approximately eight times the prewar level. The real freight rate rapidly decreased when the war was over and went back to the prewar level in 1924.Footnote 21 Consistent with this trend, the overall tonnage of vessels entering China decreased from 27.65 million in 1914 to 24.12 million in 1915. In 1918, the total tonnage reached its lowest level of 18.95 million, which was only 66 percent of the level in 1914. After the war ended, the total level of tonnage soon returned to the original level and kept growing, until the large domestic warfare from 1925 to 1926.Footnote 22
With reductions in traded commodities and dramatic increases in freight rates, China’s international trade gradually felt the impact of WWI. The Chinese Maritime Customs stated in the Reports of 1914: “…[T]he effects [of the outbreak of the Great War] were immediately felt in China. Later, when conditions became more settled and cargo was [offered], the German and Austrian flags had disappeared, much British and French tonnage had been engaged by their Governments, and neutral steamers had found more profitable employment elsewhere; so that there was such a scarcity of tonnage that in spite of willing buyers and sellers the cargo could not be accommodated” (China Maritime Customs 1915, p. 2, Part I). The influence persisted as the war continued. In 1916, when the political chaos inside China ended with a peaceful transition of power and the climate was “favorable,” the Maritime Customs officer reported that “it may be safely said that it was only due to the conditions brought about by the [Great] [W]ar that trade was not exceedingly flourishing” (China Maritime Customs 1917, p. 1, Part I).
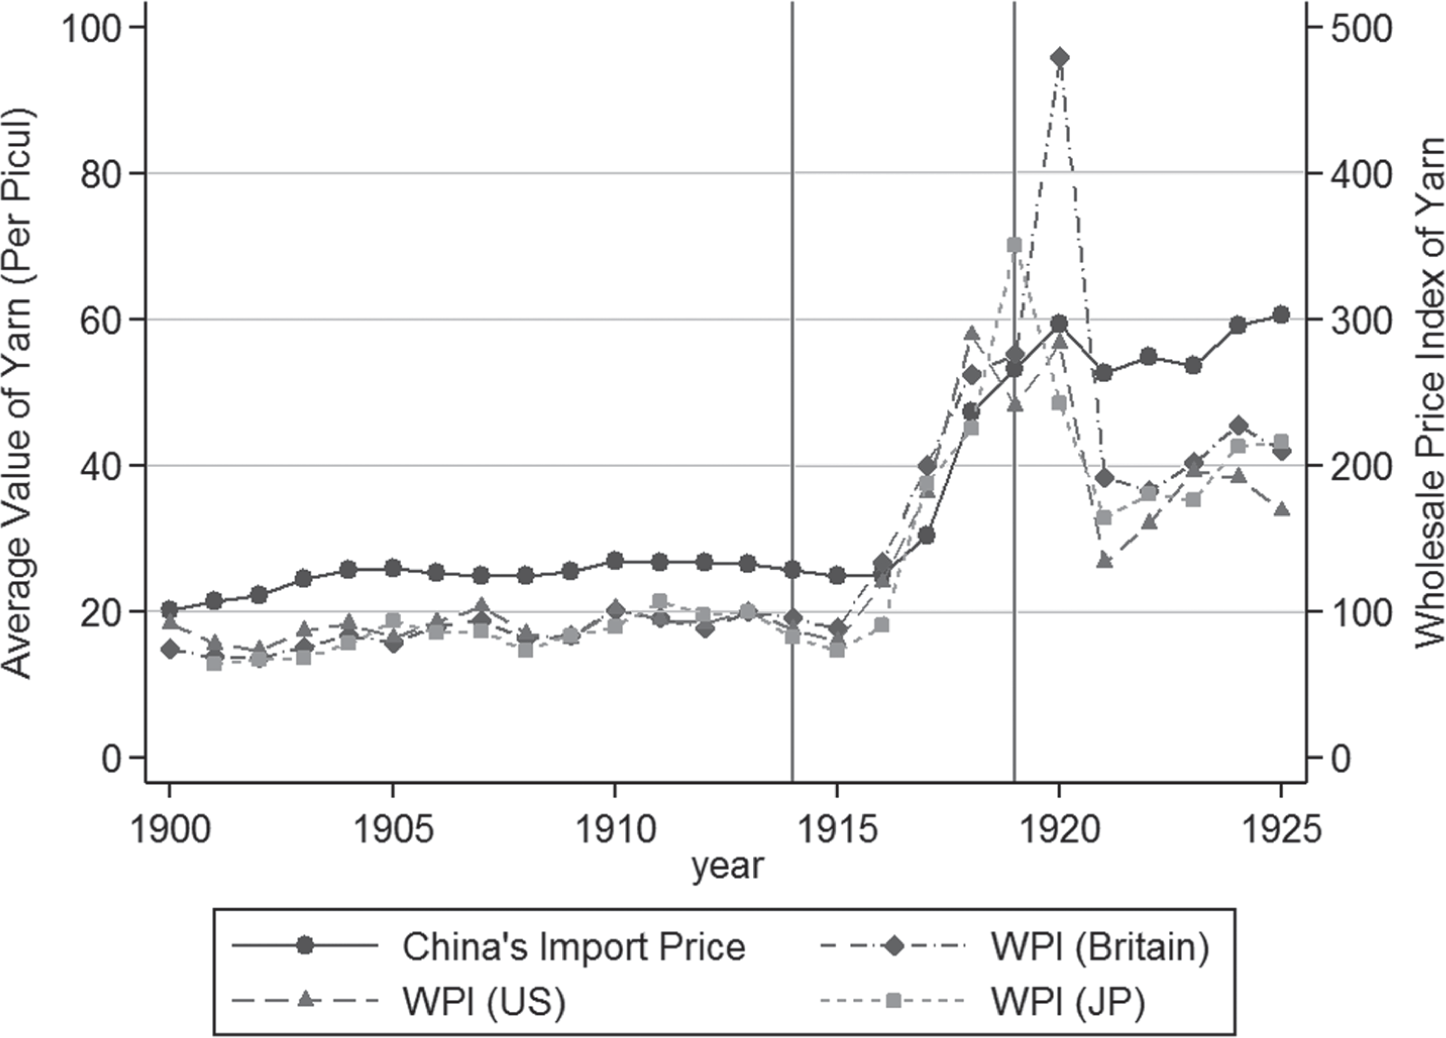
The share of textile products in China’s total import value was 32 percent before WWI, much higher than other major imports.Footnote 23 As the war greatly reduced global supply of textile products and hindered trade, the import prices of these products increased in China.Footnote 24 Figure 5 plots the wholesale price indices of cotton yarn in Britain, the United States, and Japan, together with China’s import price. The wholesale price indices around the world moved very tightly, with a relatively flat line from 1900 to 1915 and a sharp increase starting in 1916. When reaching their peaks around 1919, they had already tripled compared to the indices in 1914. The wholesale price indices then dropped in 1921. The Chinese import price of cotton yarn closely followed changes in the world market before 1919 but remained high after 1920. The price increase was salient even after controlling for quality. I am able to find the price series for cotton yarn under the same brand in Tianjin. The domestic prices of both 10-count and 16-count yarn increased steadily from 1914 to 1919, with an average of 26.24 percent increase for the 10-count yarn and 33.92 percent for the 16-count yarn per year.Footnote 25 Meanwhile, domestic prices for other necessities, such as rice and wheat, were stable as long as they mostly relied on domestic production. The wholesale price indices in Tianjin and Shanghai show that the prices of food in both places were quite stable during the war years. In sharp contrast, the price of cloth in Tianjin steadily increased by approximately 15 percent per year from 1914 to 1919, even before the international price of cotton products started to rise.Footnote 26
CHINA’S IMPORT PRICE AND OTHER COUNTRIES’ WHOLESALE PRICE INDICES OF COTTON YARN

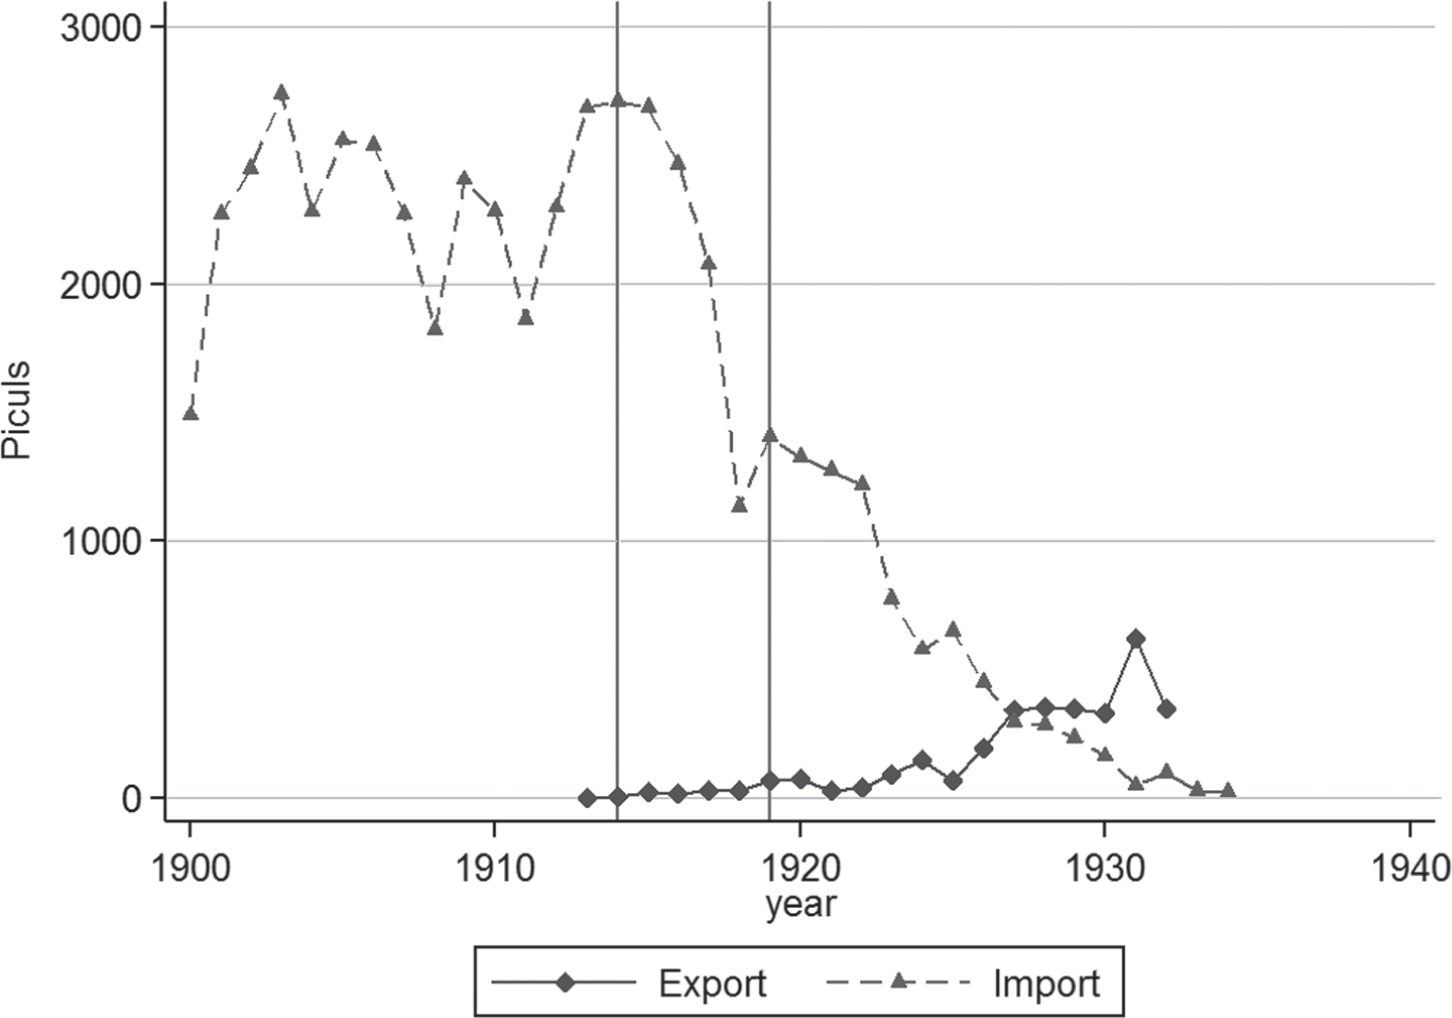
Along with the rising price, the quantity of imported yarn dropped. Figure 6 depicts the import and export quantities. While the import quantity fluctuated from 1901 to 1914, which was probably caused by political chaos, its average level remained above 2,000 piculs (or 266,000 pounds). From 1915 to 1918, however, the quantity sharply decreased from 2,686 piculs (or 358,043 pounds) to 1,132 piculs (or 150,895 pounds). Besides yarn, the total amount of cotton goods was also decreasing: The quantity of the principal plain cotton products decreased from 193.6 million pieces to 10.4 million pieces.Footnote 27 Figure 6 also suggests that this trend for cotton yarn did not reverse. When the war was over, the import of yarn recovered slightly but soon fell again, surpassed by exports after 1927.
CHINA’S IMPORT AND EXPORT QUANTITY OF COTTON YARN.

Textile firms benefited from the favorable market and earned sizable profits, especially from 1916 to 1919. Archival information of two individual textile firms, Dasheng and Shenxin, suggests that these firms had a similar experience: Both of their profit-to-capital ratios increased from less than 10 percent in 1916, to around 40 percent in 1917, and ranged from 74 to 108 percent in 1918.Footnote 28 Cross-sectional data on profits for 23 textile firms in 1919 show that the average profit-to-capital ratio was over 100 percent, with the least profitable firm able to reach a ratio of 60 percent.Footnote 29 In addition, the lucrative market incentivized the entry of new firms, especially in major ports. When reviewing ports’ experience from 1912 to 1921, the Customs officer pointed out that the port cities witnessed increases in both the number of domestic firms and the varieties of domestic manufactured products. In Tianjin, shortages in market supply due to the reduced imports of cotton products were “largely filled by increasing imports of native gray goods and by the local production of cotton yarn and cloth.”Footnote 30 In Shanghai, the expansion of domestic industries originally “need[ed] time and patience,” but “a great and unlooked-for impetus was given to the movement by the Great War. The world’s trouble was China’s opportunity.”Footnote 31
ECONOMETRIC ANALYSES OF TRADE SHOCKS AND COTTON TEXTILE INDUSTRY
In this section, I conduct econometric analyses to examine the impact of the import reduction during WWI on the expansion of the cotton textile industry in China. Case studies indicate that the war reduced world supply and increased the demand for domestic cotton products, which led to a surge in profits for existing firms. I first use a difference-in-differences model to evaluate how the entry of new firms responded to the trade shock and whether the effects varied by access to trade. The trade shock is captured using the war dummies and the value of per unit imported cotton yarn. Access to international trade is measured using the cost of each county to its closest port. I then explain the timing of firm entry. The final part of this analysis provides suggestive evidence on the impact of local characteristics on firm entry, especially the role of access to finance. The data cover the years 1907 to 1925.
For county i at year t, the full baseline regression equation is
 $${y_{it}} = {\beta _0} + {\beta _1}WW{I_t} \times {\tau _i} + {\beta _2}PostWW{I_t} \times {\tau _i} + {\mu _i} + {\sigma _t} + {\rm{ }}{\varepsilon _{it}},$$
where yit is the number of firms in the textile industry plus one in natural log form; τi indicates the calculated transportation cost (in time) from a county to its closest port (I use the natural log of transportation cost plus one); and WWI t and PostWWI t are dummy variables, with WWI t equal to one from 1914 to 1919 and zero otherwise and PostWWI t equal to one for the years 1920 to 1925 and zero otherwise. When τi is equal to zero, a county included a port in its territory.
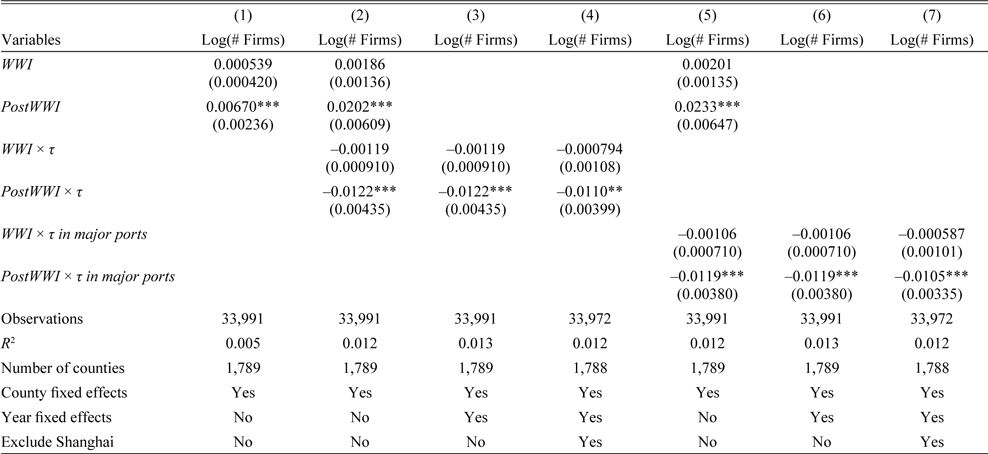
Table 3 reports the results of multiple specifications. Standard errors are clustered at the provincial level. In Column 1, I show the results using WWI t and PostWWI t instead of annual year dummies and without interacting the trade cost measure τi. This regression aims to capture the simple time trend of firm entry after controlling for county fixed effects. Both the coefficient estimates of WWIt and PostWWIt are positive, but the one of PostWWIt is much greater and statistically significant, indicating that many more firms entered after the war.
IMPACT OF WWI AND ACCESS TO TRADE ON THE NUMBER OF TEXTILE FIRMS IN CHINA, 1907–1925

Notes: *** p < 0.01, ** p < 0.05, * p < 0.1. Standard errors, reported in parentheses, are clustered at the provincial level. The regression covers the period from 1907 to 1925. The dependent variable is the numbers of textile firms (plus one and raised to the natural log form). WWI and PostWWI are dummy variables. τ is constructed travel time (in days) from a county to its closest port (plus one and raised to the natural log form). The variable τ to major ports captures the travel time (in days) from a county to one of the six major ports in yarn trade (plus one and raised to the natural log form). These ports (from North to South) are Jiaozhou, Shanghai, Hankou, Chongqing, Guangzhou, and Mengzi.
Source: Author’s calculations from Yan (Reference Yan2011) and CHGIS (2016).
Column 2 reports the results after adding the interaction terms WWIt × τi and PostWWIt × τi. These terms capture whether ports with more difficult access to international trade responded differently during and after the war. The coefficient estimates of the war dummies show that the number of firms in port counties rose by 0.19 percent during the war and 2.02 percent after the war; the later coefficient is statistically significant. When comparing the estimated coefficients of the interaction terms WWIt × τi and PostWWIt × τi, the results suggest that, compared with the port counties, a 1 percent increase in transportation cost of counties to ports reduced the positive effect on firm entry by 0.0122 percent after the war. Combined with the coefficient estimate on PostWWIt, this suggests that the overall effect on postwar firm entry was still positive until the logged transportation cost to the closest port increased to 1.66, which was approximately 5.07 days. This range covers more than 80 percent of the counties. Column 3, which corresponds to Equation (1), reports the results after replacing the war dummies with year fixed effects, aiming to control for additional national shocks during the examined period. The coefficients on the interaction terms barely change.
It is possible that the results above may have been driven by the performance of one single city, Shanghai. As the largest port and foreign concession, Shanghai was a shelter for many industrial firms during political chaos. As a result, in 1933, it owned 50 to 60 percent of the spindles in China (Ma Reference Ma2008). During the examined period, the estimated production of the manufactured cotton yarn industry experienced a rapid growth in Shanghai: From 1895 to 1911, the total production value increased from 16.14 million yuan to 47.40, with the per year growth rate only 7 percent; but the growth rate from 1911 to 1925 increased to 11.87 percent, with the production value in 1925 reaching 227.82 million yuan (Xu and Huang Reference Xu and Huang1998, Appendix Table 1). To address the concern that the results were only driven by this industrial center, I drop Shanghai and re-run the regression. Column 4 in Table 3 reports the results. The estimated coefficient of PostWWIt × τi decreased by 11 percent but remains statistically significant.
Another concern is that some small ports had much fewer trading activities than the large ones, so including all ports may have overestimated the level of access to international trade for some counties that located close to small ports but far from large ports. Columns 5–7 report the results using the recalculated trade costs to six major ports only instead of to all ports. The estimated coefficients are quite similar.
Because the data in the baseline analysis only address the number of firms, I use an alternative dataset from Du (Reference Du1991). This dataset records the initial capital of new firms, which measures increases of investments in the textile industry. Although these two datasets were largely based on similar original archives, they were constructed independently. Online Appendix Table 1 reports the results using the logged initial capital of the new firms. The estimated coefficient of PostWWIt × τi remains negative and statistically significant.
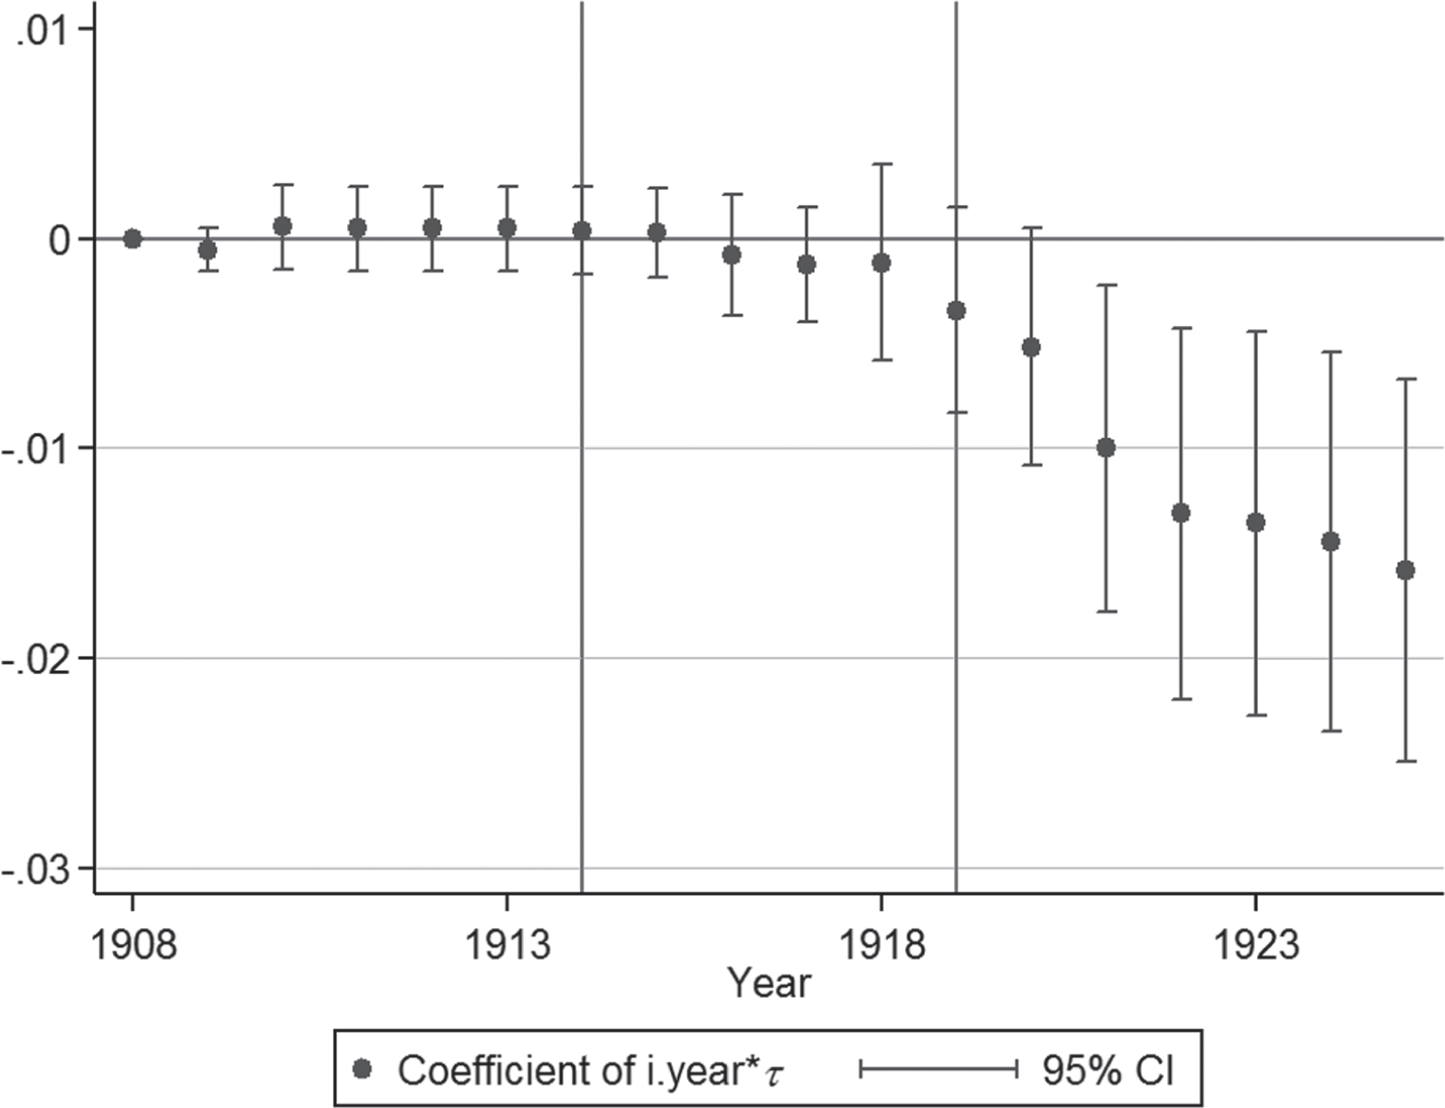
The results above may be biased if counties with better access to trade displayed different growth paths before the war. To address this concern, I check the pre-trends by replacing the war dummies with year dummies interacted with the cost to ports. Figure 7 shows the coefficient estimates of the interaction terms, which are a measure of the difference between the growth of firms in port counties and non-port counties in each year. The trend in prewar years after controlling for county dummies was flat and close to zero, indicating that counties had similar growth paths before the war. Starting from the war years, however, the firm growth in the port and the non-port counties started to diverge and the disadvantage of the non-port counties enlarged after the war.
IMPACT OF ACCESS TO TRADE ON NUMBER OF FIRMS.

I also use an alternative specification to further establish the relationship between international trade and textile firms. The war dummies in the baseline regression capture firm entry during and after the war, but as time dummies, they also include the impact of other nationwide shocks, especially when China was experiencing transitions in its political institutions.Footnote 32 To quantify the trade shock more precisely, I replace the war dummies with the constructed import price in the regression. The regression equation is
 $${y_{it}} = {\beta _0} + {\beta _1}Pric{e_t} \times {\tau _i} + {\mu _i} + {\sigma _t} + {\rm{ }}{\varepsilon _{it}}$$
where Pricet is measured using the logged per unit value of imported cotton yarn, calculated from the reported total trade value and total import quantity. I use the national values to avoid potential adverse effects of local shocks on yarn imports.
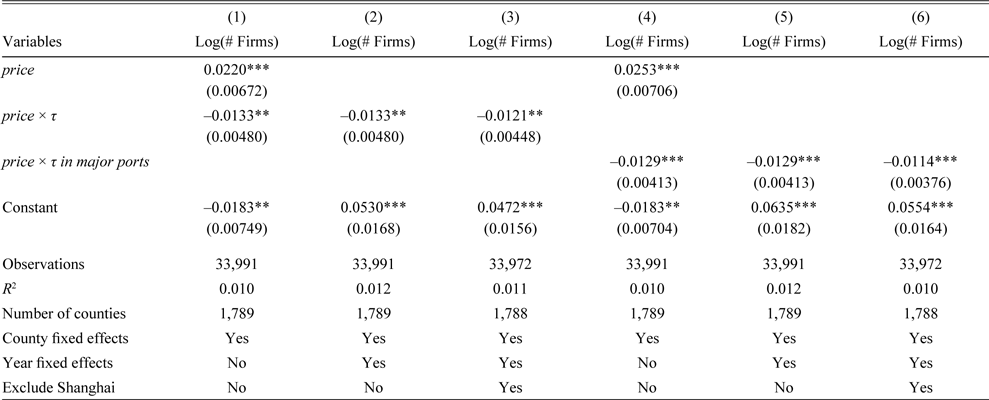
Table 4 reports the results. Column 1 displays the specification without controlling for year fixed effects. The results show that, when the price of yarn increased by 1 percent, the port counties experienced a 0.0220 percent increase in the number of cotton yarn firms, suggesting a tight connection between the price of cotton yarn and the number of the new textile firms. However, when the transportation cost increased by 1 percent, the positive effect of a 1 percent rise in price was reduced by 0.0133 percent. Given that the price level in 1919 was 90 percent higher compared to the prewar level, the estimation suggests that the average number of yarn firms increased by 1.98 percent at counties with ports, but a 1 percent higher trade cost discouraged the entry by 0.012 percent. The calculated effect has a similar size as the one using dummy variables in Table 3. The coefficient estimate of Pricet × τi remains after controlling for year fixed effects, as the estimation result in Column 2 shows. Dropping Shanghai in Column 3 slightly reduces the size of the coefficient estimate to 0.0121, but it remains statistically significant. Columns 4–6 show that using transportation costs to major ports barely changes the estimates.
IMPACT OF IMPORT PRICES AND ACCESS TO TRADE ON THE NUMBER OF TEXTILE FIRMS IN CHINA

Notes: *** p < 0.01, ** p < 0.05, * p < 0.1. Standard errors, reported in parentheses, are clustered at the provincial level. The regression covers the period from 1907 to 1925. The dependent variables are the numbers of textile firms in county i at time t (plus one and raised to the natural log form). The variable price is the average value of yarn per piece at each port in natural log form. τ is constructed travel time (in days) from a county to its closest port (plus one and raised to the natural log form). τ to major ports captures the travel times (in days) from a county to one of the six major ports in yarn trade (plus one and raised to the natural log form). These ports (from north to south) are Jiaozhou, Shanghai, Hankou, Chongqing, Guangzhou, and Mengzi.
Source: Author’s calculations from Yan (Reference Yan2011), Hsiao (Reference Hsiao1974), and CHGIS (2016).
Explaining Patterns in Firm Entry
Rawski (Reference Rawski1989) and Reynolds (Reference Reynolds1975) observe that there were lower capital formation and slower domestic textile industry growth during WWI compared with the period after the war. The econometric analysis of this paper supports this statement and finds that firm entry was greater after WWI than during the war. What was the reason for this delayed boom?
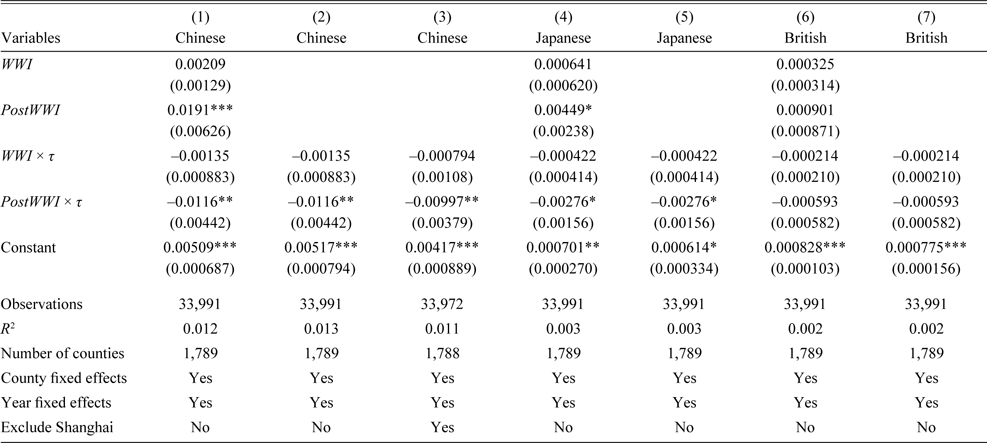
I first address the conjecture that the pattern was driven by foreign investments. China was open to foreign investments during the examined period and there was a surge in the number of Japanese textile firms after 1921 (Tokihiko Reference Tokihiko2010). It is possible that the later entry of firms was driven by foreign investments that paused during the war and flooded in after the war was over. To consider the entry of foreign firms, I divide the sample by firm nationality and re-run the regression. The first three columns of Table 5 report the estimations using a full sample of counties for the Chinese firms and the ones after dropping Shanghai. Because most foreign firms clustered in Shanghai, I only report the full sample results for the Japanese and the British firms in Columns 4–7. The postwar coefficient estimates are statistically significant for the Japanese firms and not for the British firms, but in both cases, the absolute values are much smaller than the ones for the Chinese firms, suggesting that foreign investments were not the driving forces for late entry.
IMPACT OF WWI AND ACCESS TO TRADE ON THE NUMBER OF TEXTILE FIRMS IN CHINA, BY NATIONALITY

Notes: *** p < 0.01, ** p < 0.05, * p < 0.1. Standard errors, reported in parentheses, are clustered at the provincial level. The regression covers the period from 1907 to 1925. The dependent variables are the numbers of textile firms in county i at time t by nationality (plus one and raised to the natural log form). WWI and PostWWI are dummy variables. τ is constructed travel time in days (plus one and raised to natural log form) from a county to its closest port.
Source: Author’s calculations from Yan (Reference Yan2011) and CHGIS (2016).
In fact, the reason for the postwar rather than in-war entry was likely due to the postponed arrival of machinery. China was unable to produce textile machinery and relied heavily on imports from overseas, especially from the United Kingdom (Fang Reference Fang2011, pp. 96–100). Firms’ archives show that, while the shipping of machines from Europe to China already took substantial time, the war further stalled machinery arrival. In 1917, when Shenxin intended to expand production by purchasing new machines, difficulties caused by the war hindered the business. Rong Desheng, the owner of Shenxin, wrote in his diary, “In 1918 … [we] intended to increase spindles, but we could not find a company to purchase from … Mu Ouchu (the owner of another textile firm) obtained machines with 25,000 spindles from the US, but their arrival was also delayed. [The planned] ShenXin II ordered 10,000 spindles from the Great Britain, and these spindles came after the war. In preparation for the arrival of new machines, we uninstalled the old machines and waited, which led to considerable lost opportunities” (Shanghai Social Science Academy 1980, p. 59). Similarly, Zhang Jian ordered machines from the British firms for a new factory, Dasheng III, in 1915, but the machines did not arrive until 1921 (Gu Reference Gu2015, p. 175).
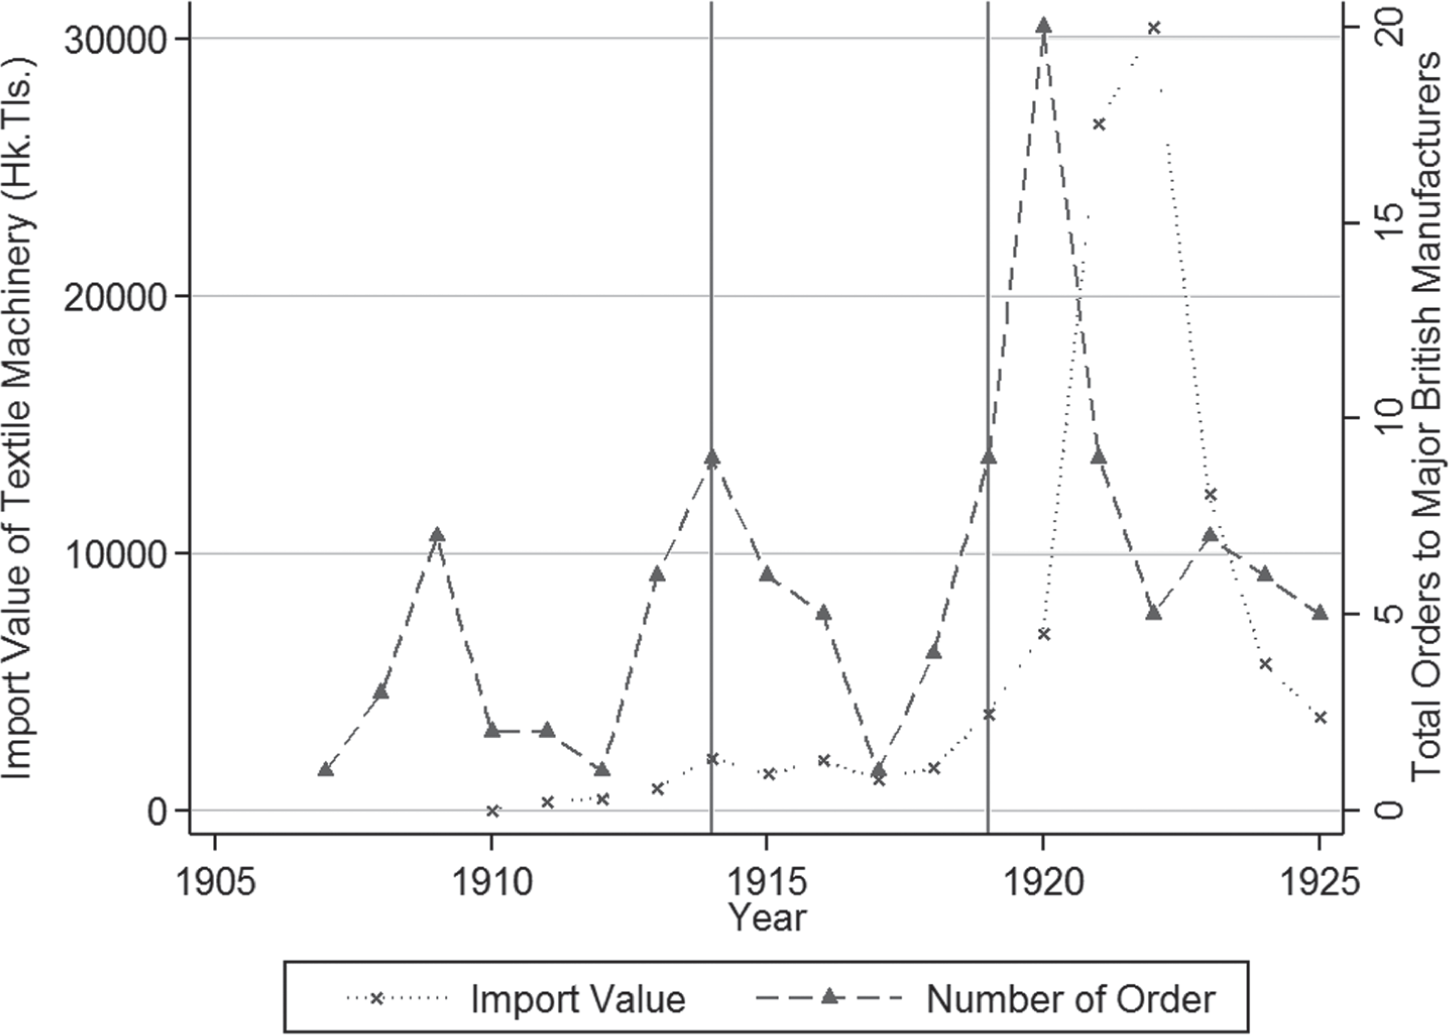
The trade statistics suggest that many firms might have faced similar difficulties. Figure 8 presents the total number of orders with the British manufacturers and the import values of textile machinery in each year. The dashed line shows the total number of orders with the British manufacturers, constructed based on Wright’s (Reference Wright2011) records of textile machinery transactions. These data recorded individual transactions involving major textile machinery producers in Britain, with codes for major supplies, trading countries, firm identifiers, number of frames and spindles, and order and shipping times (Saxonhouse and Wright Reference Saxonhouse and Wright2010). I select the ones with China. Because Britain was the main producer of textile machinery in China during this time, these orders serve as a good proxy for the general demand for textile machinery from firms in China. The total number of orders surged in 1909, 1914, and 1920.Footnote 33 The dotted line depicts the import values of textile machinery. Starting from a low level, the import values doubled from 1918 to 1919, still less than 2,000 Haikwan taels, and surged to more than 30,000 Haikwan taels in 1922. While the number of orders mostly parallels the trend of the machinery importation, there were relatively more orders from 1914 to 1919, compared to the actual machinery shipped.
THE IMPORT VALUE AND ORDERS OF TEXTILE MACHINERY.

In Wright’s (Reference Wright2011) transaction-level data, a subsample of transactions with Platt, a major supplier of textile machinery to the Chinese firms, also records the order time and the shipping time of each order.Footnote 34 I calculate the gap between the two times for these transactions. The lag was very long when China just started its textile industry in 1889. It fell to less than one year according to the only order containing this information from 1900 to 1914. However, the several transactions with this information from 1914 to 1919 on average were delayed by more than three years, except for one order that was shipped within a year. The average lag was around two years for transactions from 1918 to 1920 and gradually dropped to around one year after 1921.
I also collect firm-level capital and the actual inputs of the Chinese textile firms for the years 1916 to 1921.Footnote 35 The capital remained the same from 1916 to 1917 and increased steadily from 1917 to 1920, with an average annual rate of approximately 21 percent. In contrast, the number of spindles remained the same until 1920. Online Appendix Figure 3 plots capital invested and spindles at the firm level each year. This suggests that, although firms increased investments during the war, the textile machinery did not change until the war was over.
Suggestive Evidence on the Role of Finance
The previous section established the relationship between the war-inducing trade shock and the entry of textile firms. This section provides suggestive evidence of the additional conditions for firm entry, including access to finance and trading companies, geographic suitability for raw cotton, a history of handicraft textile production, and political conflicts. I especially emphasize the importance of access to financing, which facilitated trade and provided capital for the textile firms.
I control for the prewar level of these factors and conduct a triple-difference analysis:
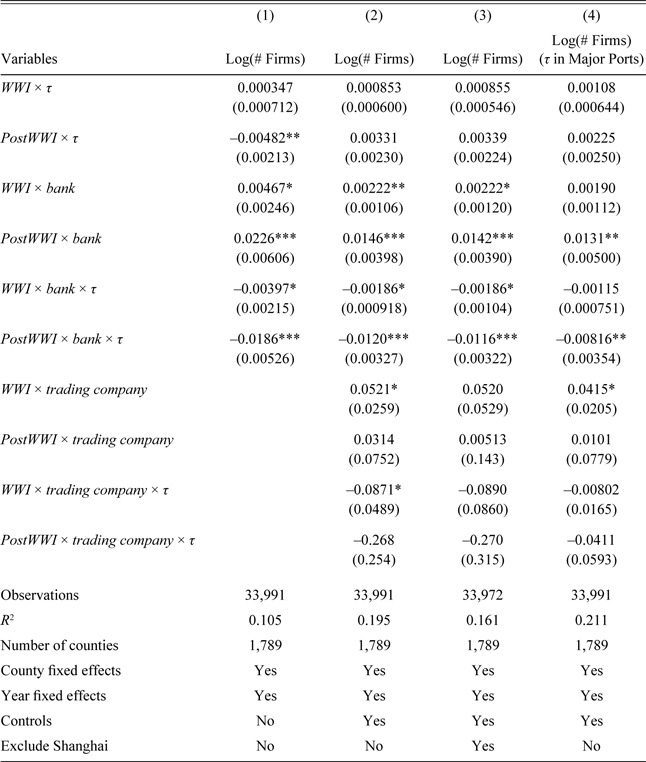
 $${y_{it}} = {\beta _0} + {\beta _1}WW{I_t} \times {\tau _i} + {\beta _2}WW{I_t} \times Cha{r_i} + {\beta _3}WW{I_t} \times {\tau _i} \times Cha{r_i} \\+ {\beta _4}PostWW{I_t} \times {\tau _i} + {\beta _5}PostWW{I_t} \times Cha{r_i} + {\beta _6}PostWW{I_t} \times {\tau _i} \\\times Cha{r_i} + {\mu _i} + {\sigma _t} + {\rm{ }}{\varepsilon _{it}}$$
where the war dummies, τi, µi, and σt, have the previous interpretations. Chari is a vector that includes a set of local characteristics that did not vary with time. The interactions of the war dummies and Chari measure how local characteristics were correlated with heterogeneous effects of the trade shock on port counties during and after the war. The triple-interaction terms WWIt × τi × Chari and PostWWIt × τi × Chari capture how the heterogeneous effects of associated local characteristics varied with trade cost. The coefficients of the triple-interaction terms, β3 and β6, indicate whether the association with local factors differed when firms had different access to international trade.
The local characteristics include financial institutions in 1912, historical textile centers in the eighteenth century, a proxy for suitability for cotton production, and measures for political stability. Because the financial sectors and the industrial sectors were often coincident, the regression provides more suggestive evidence rather than a causal interpretation. I check the pre-trend to show that regions with different access to banks had no clear differences in the growth paths. Online Appendix Figure 4 shows that, after controlling for national time trends and county fixed effects, counties with and without banks had similar pre-trends in terms of firm entry.
Financial institutions might have promoted firm entry through facilitating trade or providing capital. To shed light on the mechanisms, I also collect the location of trading companies that served as brokers during international commodity transactions. If financial institutions promoted firm entry through trade solely, the coefficient should shrink dramatically after controlling for these trading companies.
Table 6 reports the regression results. Column 1 shows the estimates without controlling for the trading companies. The interaction terms between the bank variable and the war dummies are positive and statistically significant, suggesting that, when counties were located at ports, those with more financial institutions had more firm entry than those without financial institutions. The coefficient estimates show that a 1 percent increase in bank capital at the county level was associated with 0.00467 percent more entry of firms during the war and 0.0226 percent after the war. The triple-interaction terms are negative, showing that higher transportation cost reduced the positive effect on firm entry due to access to financial institutions. Specifically, a 1 percent increase in cost to ports reduced the previous positive effect by 0.00397 percent during the war and 0.0186 percent after the war. The result suggests that the positive effect from exposure to international trade and access to finance would decrease to zero after the logged value of trade cost is greater than approximately 1.2, which is about 3.3 days.
IMPACT OF WWI AND LOCAL CHARACTERISTICS ON THE NUMBER OF TEXTILE FIRMS

Notes: *** p < 0.01, ** p < 0.05, * p < 0.1. Standard errors, reported in parentheses, are clustered at the provincial level. The regression covers the period from 1907 to 1925. The dependent variables are the numbers of textile firms plus one in natural log form in county i at time t. WWI and PostWWI are dummy variables. τ is constructed travel days from a county to its closest port (plus one and raised to the natural log form). The variable bank is the bank capital in 1912 plus one and raised to the natural log form. I also control for the distribution of foreign banks, traditional Chinese banks, concessions, suitability for cotton production, and warfare that occurred in a county in a given year.
Source: Author’s calculations from Bureau of Agriculture and Commerce (1914), CHGIS (2016), Huang (Reference Huang1995), Yan (Reference Yan2011, Reference Yan2012), Guo (Reference Guo1990), and Jiang (Reference Jiang2009).
Columns 2–4 report the results after controlling for trading companies. The interaction terms of trading companies and the war dummies are positive, suggesting that these companies were positively associated with firm entry. As expected, the coefficient estimates of interaction terms between the bank variable and the war dummies decrease, but they mostly remain statistically significant. This implies that at least part of the banks’ function was probably to provide capital. The results are robust if I replace the war dummies with per unit value of cotton yarn, as reported in Online Appendix Table 2. I also use longitudinal data from 1912 to 1920 instead of the cross-sectional data in 1912 to measure bank distribution in Online Appendix Table 3, and the results are similar.
Firms entering the market after the war had missed the golden years and suffered from the market downturn in the 1920s. In 1919, the market price for yarn was even higher than during the war years, and firms continued to enjoy the profitable markets. Starting in 1922, however, the price of yarn fell and raw cotton became expensive. During this market downturn, debts and interest became increasingly burdensome. According to Dasheng’s account book, the share of interest in its total costs and fees was nearly 10 percent during the first several years, and it soon surged to more than 20 percent. In 1920, 30 percent of the firm’s expenditures were interest payments, which led to a major crisis when the firm failed to pay its loans in 1924 (Gu Reference Gu2015, p. 35). Dasheng’s experience was not unique. In fact, the pressure of debts forced many entrepreneurs to sell their firms to large enterprises, banks, or other merchants. Among the 99 firms established before 1925, in Yan’s (Reference Yan2011) record, at least 54 of them changed ownership, with 21 taken over by banks, 10 by Japanese merchants, 2 by British merchants, and the rest sold or rented to other owners (Yan Reference Yan2011, Appendix 1). Firms’ experience suggest that, while the trade shock increased the total number of spindles in China, more than half of the firms failed to survive. Most small firms finally became part of the large enterprises.
CONCLUSIONS
The impact of WWI reached far beyond Europe. This paper focuses on the effect of the war on the global economy through international trade. Trade data suggest that the war caused shortages in the world supply of manufactured products and increased international freight rates. Although these disruptions were undesirable for global trade, they might have provided industries in the importing countries an opportunity to grow.
This paper examines China’s experience to assess the impact of trade disruptions on industrial growth during and after WWI. It adds to the literature that uses exogenous trade disruptions to evaluate the effect of reductions in imports on domestic industrial growth. I collect trade statistics and find that the war decreased the quantity of cotton products imported and dramatically increased import prices. Using county-level data compiled from multiple sources and newly constructed estimates of domestic transportation costs to treaty ports, I show that counties that had more exposure to the trade disruptions experienced greater development in the manufactured textile industry.
The textile industry initiated industrialization in countries around the world, but the industry’s performance varied across countries (Clark Reference Clark1987). Although the Chinese had noticed the advantage of manufactured yarn over the handicraft ones, the domestic manufactured textile sector was quite small before WWI. Firm-level information suggests that the trade disruptions during WWI created sizable profits for firms and contributed to the expansion of the manufactured textile industry. Although there were further adjustments within this industry, it is fair to say that the textile industry took this opportunity and became China’s largest industry in the 1930s.
Further examinations show that the expansion was delayed. In fact, few Chinese firms were able to acquire machinery in a timely manner. Combining data from both Chinese and British sources, I find that this was mostly due to the delay in the arrival of imported textile machinery. Thus, trade disruptions during the war served as a double-edged sword for Chinese firms that competed with manufactured products from overseas but also depended on the supply of inputs from the world market.
The last part of the empirical analyses provides suggestive evidence on the role of local characteristics in firm entry. I find that access to financial institutions was positively associated with new firm entry in early twentieth-century China. The firm archives further suggest that there were two possible mechanisms for financial institutions to facilitate the establishment of new firms. First, these institutions provided loans for firms, which often lacked sufficient funding to organize their production process or expand their business. This is consistent with findings from the economics literature that, in developing countries with high financial frictions, the availability of finance facilitated firm entry (Guiso, Sapienza, and Zingales Reference Guiso, Sapienza and Zingales2004). In addition, the textile firms heavily relied on trade networks to acquire machinery and raw cotton. In this case, bank notes largely facilitated capital transfer.