Williams syndrome is caused by a deletion of approximately 25 genes on the long arm of one copy of the seventh chromosome (7q11.23; Donnai & Karmiloff-Smith, Reference Donnai and Karmiloff-Smith2000), and it has an estimated prevalence rate of approximately 1 in 10,000 live births (Pober, Reference Pober2010). Individuals with Williams syndrome are characterized by a unique profile of especially heightened social interest and enhanced spoken communication in relation to IQ levels that are virtually always in the range of intellectual disability (Haas & Reiss, Reference Haas and Reiss2012; Järvinen, Korenberg, & Bellugi, Reference Järvinen, Korenberg and Bellugi2013; Karmiloff-Smith, Klima, Bellugi, Grant, & Baron-Cohen, Reference Karmiloff-Smith, Klima, Bellugi, Grant and Baron-Cohen1995; Ng, Järvinen, & Bellugi, Reference Ng, Järvinen and Bellugi2014; Reilly, Klima, & Bellugi, Reference Reilly, Klima and Bellugi1990). These apparent dissociations of development have been considered informative for our understanding of language and social development in relation to general developmental level (Elsabbagh & Karmiloff-Smith, Reference Elsabbagh, Karmiloff-Smith, Burack, Hodapp, Iarocci and Zigler2012; Järvinen et al., Reference Järvinen, Korenberg and Bellugi2013). However, as is often the case, the initial clear-cut portrayals have needed to become more nuanced in response to empirical findings. This is exemplified by the rejection of the notion of “spared,” or even “enhanced,” language abilities (please see Mervis, Reference Mervis, Burack, Hodapp, Iarocci and Zigler2012). Furthermore, despite their heightened interest in social engagement, persons with Williams syndrome frequently experience difficulties in forming friendships and even in making conversation while being at increased risk for both social rejection and vulnerability to abuse (Tager-Flusberg & Plesa-Skwerer, Reference Tager-Flusberg, Plesa-Skewerer, Banaji and Gelman2013). These tempered portrayals of the functioning of persons with Williams syndrome are more consistent with developmentally based delineations of syndrome-specific patterns of behaviors in which the various strengths and weaknesses are linked together in some meaningful and organized ways (Burack, Russo, Gordon Green, Landry, & Iarocci, Reference Burack, Russo, Gordon Green, Landry, Iarocci and Cicchetti2016; Cicchetti & Beeghly, Reference Cicchetti and Beeghly1990; Cicchetti & Pogge-Hesse, Reference Cicchetti, Pogge-Hesse, Zigler and Balla1982; Hodapp & Burack, Reference Hodapp, Burack, Cohen and Cicchetti2006; Hodapp, Burack, & Zigler, Reference Hodapp, Burack and Zigler1990).
In rethinking the endophenotype of persons with Williams syndrome, the allocation of attention to human faces is one aspect of social functioning that might be revisited as persons with Williams syndrome are widely depicted as being especially interested in and attentive to others’ faces from childhood (Mervis et al., Reference Mervis, Morris, Klein-Tasman, Bertrand, Kwitny, Appelbaum and Rice2003). Despite this common portrayal, the overall degree to which attention is allocated to faces appears to be modulated by the facial expression in a manner dissimilar to that seen in typical development (Dodd & Porter, Reference Dodd and Porter2010). Studies with brain imaging techniques and other physiological measures have provided evidence for unusually low levels of arousal when viewing facial expressions conveying threat, such as anger or fear, in contrast to the heightened arousal evidenced for faces that are happy (Haas et al., Reference Haas, Mills, Yam, Hoeft, Bellugi and Reiss2009; Meyer-Lindenberg et al., Reference Meyer-Lindenberg, Hariri, Munoz, Mervis, Mattay, Morris and Berman2005). In a behavioral study of this phenomenon with a dot-probe task, Dodd and Porter (Reference Dodd and Porter2010) found that persons with Williams syndrome showed a bias toward happy faces relative to neutral faces that was not seen among comparison groups of typically developing participants matched for chronological age or mental age. This bias was not observed for angry facial expressions. The heightened physiological arousal and increased attention to happy faces have been linked to the tendency of people with Williams syndrome to approach strangers (Dodd & Porter, Reference Dodd and Porter2010; Haas et al., Reference Haas, Mills, Yam, Hoeft, Bellugi and Reiss2009; Santos, Silva, Rosset, & Deruelle, Reference Santos, Silva, Rosset and Deruelle2010), a behavior that places them at risk and is a source of concern for parents and professionals alike (Riby, Kirk, Hanley, & Riby, Reference Riby, Kirk, Hanley and Riby2014).
In considering the extent to which elevated social approach among persons with Williams syndrome is intrinsically related to the unique pattern of attention toward happy faces, persons with Down syndrome provide an informative comparison group. Despite a completely different genotype caused by the presence of all, or part of, a third copy of chromosome 21 (trisomy 21) versus a small deletion on chromosome 7 (7q11.23) in Williams syndrome, children with Down syndrome also show elevated social approach as compared to typically developing persons of the same developmental level (Cicchetti & Beeghly, Reference Cicchetti and Beeghly1990), albeit to a lesser extent than children with Williams syndrome (Doyle, Bellugi, Korenberg, & Graham, Reference Doyle, Bellugi, Korenberg and Graham2004; Jones et al., Reference Jones, Bellugi, Lai, Chiles, Reilly, Lincoln and Adolphs2000). The similarity in social approach behavior among persons with Williams syndrome and Down syndrome is striking because it stands in contrast to the considerable differences between the groups in their linguistic, cognitive, and social functioning profiles (e.g., Edgin, Pennington, & Mervis, Reference Edgin, Pennington and Mervis2010; Ypsilanti & Grouios, Reference Ypsilanti and Grouios2008). As part of the ongoing tenet that the study of the organization of developmental profiles within and across specific etiologies is central to the developmental approach to intellectual disability (Burack, Reference Burack, Hodapp, Burack and Zigler1990; Burack, Russo, Flores, Iarocci, & Zigler, Reference Burack, Russo, Flores, Iarocci, Zigler, Burack, Hodapp, Iarocci and Zigler2012; Cicchetti & Pogge-Hesse, Reference Cicchetti, Pogge-Hesse, Zigler and Balla1982; Cornish & Wilding, Reference Cornish and Wilding2010), we compare patterns of attention allocation to facial expressions of emotion between individuals with Williams syndrome and individuals with Down syndrome, and in relation to typically developing children matched on mental age.
Emotion Processing in Persons With Williams Syndrome
Individuals with Williams syndrome are characterized by an intense interest in people, with long durations of looking at faces (Mervis et al., Reference Mervis, Morris, Klein-Tasman, Bertrand, Kwitny, Appelbaum and Rice2003; Riby & Hancock, Reference Riby and Hancock2009). It is not surprising that recognition of facial identity is a strength in people with Williams syndrome (Annaz, Karmiloff-Smith, Johnson, & Thomas, Reference Annaz, Karmiloff-Smith, Johnson and Thomas2009; Gagliardi et al., Reference Gagliardi, Frigerio, Burt, Cazzaniga, Perett and Borgatti2003); but they also display more difficulty in recognizing facial expressions of emotion, particularly when identifying negative emotions, such as fear or anger (Gagliardi et al., Reference Gagliardi, Frigerio, Burt, Cazzaniga, Perett and Borgatti2003; Plesa-Skwerer, Faja, Schofield, Verbalis, & Tager-Flusberg, Reference Plesa-Skwerer, Faja, Schofield, Verbalis and Tager-Flusberg2006; Tager-Flusberg & Sullivan, Reference Tager-Flusberg and Sullivan2000).
Evidence from neurophysiological research indicates that facial expressions are processed differently among individuals with Williams syndrome as compared to those with other developmental delays or those with typical development. For example, the amygdala response is elevated when adult participants with Williams syndrome view happy as compared to neutral expressions and attenuated when they view negative emotional expressions, whereas in typically developing persons, an elevated response is observed when view negative emotions and not when viewing happy faces (Haas et al., Reference Haas, Mills, Yam, Hoeft, Bellugi and Reiss2009; Meyer-Lindberg et al., Reference Meyer-Lindenberg, Hariri, Munoz, Mervis, Mattay, Morris and Berman2005). Haas et al. suggest that “abnormal amygdala reactivity in Williams syndrome may possibly function to increase attention to and encoding of happy expressions and to decrease arousal to fearful expressions” (2009, p. 1132). Thus, attention among persons with Williams syndrome might be biased toward happy expressions while insufficient attention may be allocated to threat-related emotions. Such a bias may have an impact on subsequent cognitive processes and thus influence the regulation of social approach behavior (Phelps, Reference Phelps, Hassin, Uleman and Bargh2005).
Emotion Processing in Persons With Down Syndrome
Down syndrome is the most common genetic cause of intellectual disability and is characterized by a wide range of IQ and levels of social adaptation, although the majority of individuals show moderate levels of functioning (Chapman & Hesketh, Reference Chapman and Hesketh2000). It typically results from three copies of chromosome 21 and has a prevalence rate of approximately 1 per 1,000 live births (Morris & Springett, Reference Morris and Springett2014), although this rate varies widely between countries (Loane et al., Reference Loane, Morris, Addor, Arriola, Budd, Doray and Dolk2013). Since the earliest descriptions by Langdon Down (Reference Down1866), children with Down syndrome have been portrayed as happy, affectionate, and sociable (Gibbs & Thorpe, Reference Gibbs and Thorpe1983). In studies of attention patterns, infants with Down syndrome were found to spend more time looking at their mothers than at objects relative to typically developing infants of the same chronological age (Gunn, Berry, & Andrews, Reference Gunn, Berry and Andrews1982) or to preterm infants matched for mental age (Landry & Chapieski, Reference Landry and Chapieski1990). Although individuals with Down syndrome typically show relative competence in forming interpersonal relationships (Fidler, Most, Booth-LaForce, & Kelly, Reference Fidler, Most, Booth-LaForce and Kelly2008; Oates, Bebbington, Bourke, Girdler, & Leonad, Reference Oates, Bebbington, Bourke, Girdler and Leonard2011), they also show difficulties in some aspects of interpersonal functioning (e.g., Wishart, Willis, Cebula, & Pitcairn, Reference Wishart, Willis, Cebula and Pitcairn2007) and, in particular, in emotion recognition (Kasari, Freeman, & Hughes, Reference Kasari, Freeman and Hughes2001; Porter, Coltheart, & Langdon, Reference Porter, Coltheart and Langdon2007; Williams, Wishart, Pitcairn, & Willis, Reference Williams, Wishart, Pitcairn and Willis2005; Wishart & Pitcairn, Reference Wishart and Pitcairn2000). Similar to the findings among persons with Williams syndrome, persons with Down syndrome experience more difficulty identifying negative emotions, even when considered in relation to the level expected from their intellectual development (Cebula, Moore, & Wishart, Reference Cebula, Moore and Wishart2010).
In an initial comparison of the brain's response to facial expressions of emotion between children with Down syndrome and typically developing children matched on reading level, differential frontal EEG patterns were reported between the two groups when processing videos showing angry but not happy, sad, or fearful emotions (Conrad et al., Reference Conrad, Schmidt, Niccols, Polak, Riniolo and Burack2007).
Measuring Attention Allocation to Facial Expressions
Attention allocation is often assessed with the dot-probe paradigm (MacLeod, Mathews, & Tata, Reference MacLeod, Mathews and Tata1986) in which two facial expressions, one threat-related or happy and one neutral, are shown side by side on each trial and their offset is followed by a small probe in the location just occupied by one of the faces. The participants are then required to respond as fast as possible to the probe, and response times are considered to be indicative of the allocation of attention (MacLeod et al., Reference MacLeod, Mathews and Tata1986). If attention is drawn by the emotional faces more than the neutral faces, reaction times (RT) will be faster in trials in which the probe appears on the same side as the emotional faces (congruent trials) than when the probe appears on the side of the neutral face (incongruent trials). The difference between RTs in congruent and incongruent trials is a measure of bias toward or away from the emotional face. Evidence from studies of typically developing children with the dot-probe task indicates no bias to angry or fearful faces, at least in children above the age of 8 years (Bar-Haim, Lamy, Pergamin, Bakermans-Kranenberg, & van IJzendoorn, Reference Bar-Haim, Lamy, Pergamin, Bakermans-Kranenburg and IJzendoorn2007), but contradictory findings regarding a bias toward happy faces (Lindstrom et al., Reference Lindstrom, Guyer, Mogg, Bradley, Fox, Ernst and Bar-Haim2009; Roy et al., Reference Roy, Vasa, Bruck, Mogg, Bradley and Sweeney2008; Waters, Henry, Mogg, Bradley, & Pine, Reference Waters, Henry, Mogg, Bradley and Pine2010). However, in a study of typically developing children aged 5 years, spatial attention was allocated to both happy and fearful faces relative to neutral ones (Elam, Carlson, DiLalla, & Reinke, Reference Elam, Carlson, DiLalla and Reinke2010).
Design of the Study and Hypotheses
The current study had two aims. One was to test whether attention bias toward happy faces is specific to persons with Williams syndrome by comparing them to a group of participants with Down syndrome of a similar chronological age (CA), who typically display some similarities in social behavior and emotion processing and who function at a similar level of cognitive development. The second aim was to compare individuals with Williams syndrome and individuals with Down syndrome to typically developing children matched for mental age (MA) in order to examine the role of developmental level in attention bias to emotional faces. We hypothesized that the participants with Williams syndrome would show a bias toward happy faces that would be greater than that seen among the participants with Down syndrome but that the group of participants with Down syndrome would show more of a bias toward happy faces than typically developing children.
Method
Participants
Eighteen individuals (11 female) with Williams syndrome participated in the study following recruitment through special schools, parent organizations, and a national Williams syndrome clinic. All the participants had received a diagnosis of Williams syndrome via genetic testing. Three female participants were excluded from the data analysis (1 due to very low accuracy rates on the attention task, 1 was unable to follow task instructions, and 1 was receiving psychiatric medication at the time of the study). Twenty-four individuals (13 female) with Down syndrome participated in the study following recruitment through special schools, via a contact list for children included in mainstream schools, and through a parent organization. All participants with Down syndrome were diagnosed with trisomy 21. One male and 1 female were excluded from data analysis due to difficulty following task instructions.
The MA of the participants with Williams syndrome and Down syndrome were assessed using the Leiter International Performance Scale—Revised (Leiter-R: Roid & Miller, Reference Roid and Miller1997), a standardized norm-referenced test that provides an estimate of nonverbal intellectual functioning with reliability estimates that range from 0.88 to 0.90. The Leiter-R correlates 0.85 with the Wechsler Intelligence Scales for Children III full-scale IQ (Roid & Miller, Reference Roid and Miller1997). The Brief IQ Battery consists of the four subtests of figure ground, form completion, sequential order, and repeated patterns, and these measure visual spatial and inductive reasoning skills. The raw scores were converted into MA (age equivalence) values. The test is administered without the use of language on the part of the participant or the examiner, and this was explained to the participants at the outset. The nonverbal nature of this test is appropriate for this study as the experimental task did not require the use of language (for a discussion of matching strategies, see Burack, Iarocci, Flanagan, & Bowler, Reference Burack, Iarocci, Flanagan and Bowler2004).
As measured by the Brief IQ Battery of the Leiter-R, the mean MA of the participants with Williams syndrome was 6.25 years (SD = 1.19, range = 4.66–9.25 years) and of the participants with Down syndrome, 5.74 years (SD = 0.61, range = 4.75–7 years). An independent t test revealed no difference between the groups, with p = .14. Following the suggestion of Mervis and Klein-Tasman (Reference Mervis and Klein-Tasman2004) not to accept a p level below .50 when matching for control variables, two participants with Williams syndrome and outlying high MAs (9.25 and 8.1 years, both male), and two of the participants with Down syndrome with the lowest MAs (4.75 years, both female) were excluded in order to obtain a closer match between the two groups. An independent t test showed that the resulting groups were adequately matched on MA (Williams syndrome M = 5.88 years, SD = 0.68; Down syndrome M = 5.84, SD = 0.55), t (31) = 0.17, p = .867. In addition, these groups did not differ on CA (Williams syndrome M = 19.2 years, SD = 5.5, range = 10–28.6; Down syndrome M = 18.8 years, SD = 4.1, range = 12.1– 26.3), t (31) = 0.26, p = .797. A comparison group of 19 typically developing children (11 female) between the ages of 4 and 7 years was chosen from a large representative group of 96 children with no history of special education services who had completed the dot-probe task. The selection of these participants was based on the MA and gender of the participants with Williams syndrome and with Down syndrome. The mean CA of this comparison group was 5.8 years.
Attention bias assessment
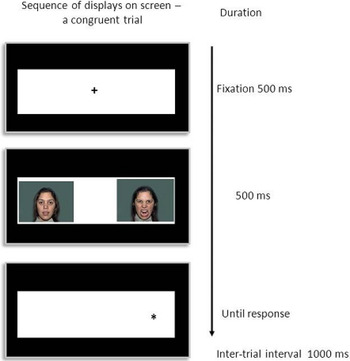
Attention bias was assessed with a variant of the dot-probe task (illustrated in Figure 1; Abend, Pine, & Bar-Haim, Reference Abend, Pine and Bar-Haim2014) that was presented on a laptop computer with a 15-inch screen using E-prime software and photos of facial expressions from the NimStim face stimulus set (Tottenham et al., Reference Tottenham, Tanaka, Leon, McCarry, Nurse, Todd and Nelson2009). The facial stimuli were pairs of photographs each measuring 48 mm in width × 38 mm in height of 16 different individuals (8 male, 8 female). Three different pictures of each individual, depicting angry, happy, and neutral expressions, were selected. Each pair of photos displayed was of the same individual with neutral–angry, neutral–happy, or neutral–neutral facial expressions.
(Color online) Stimulus presentation in a dot-probe trial.

All the displays were presented within a white rectangle (55 × 158 mm) mounted on a black background. Each trial began with a fixation display (500 ms; black cross 1 × 1 cm), followed by a face pair presentation (500 ms). Following the faces presentation, a target probe (asterisk) appeared at the location previously occupied by one of the faces. The participants needed to determine probe location by pressing one of two clearly marked buttons on the keyboard. Using probe location as opposed to a probe classification simplifies the task and is commonly employed in dot-probe studies with children (e.g., Roy et al., Reference Roy, Vasa, Bruck, Mogg, Bradley and Sweeney2008; Waters et al., Reference Waters, Henry, Mogg, Bradley and Pine2010). The probe remained on the screen until a response. A new trial began following an intertrial interval (1000 ms).
The task consisted of 160 trials, of which 64 trials were neutral–happy pairs, 64 neutral–angry pairs, and 32 neutral–neutral pairs presented in random order. The task was presented in four blocks with opportunities for breaks between blocks and counterbalanced in terms of actor, expressions location, and probe location. RT was measured in milliseconds and mean bias scores for each emotion within each participant calculated from the difference between mean RTs on incongruent and congruent trials. In order to examine the processes behind an attention bias, engagement and disengagement scores were computed (Koster, Crombez, Verschuere, & DeHouner, Reference Koster, Crombez, Verschuere and DeHouner2004). An engagement score, indicating vigilance for the happy faces, was calculated by comparing RTs in neutral–neutral trials and congruent trials for the happy face, while the disengagement score, which indicates a difficulty disengaging from the happy face, was calculated on the basis of the difference between RTs on the incongruent trials for the happy face and the neutral–neutral trials.
Procedure
Following approval of the study by the university ethics committee and the Ministry of Education, written informed consent was obtained from the parents of all the participants. The participants also received an explanation of the study that was appropriate to their level of understanding and asked if they would like to take part. The participants with Williams syndrome and with Down syndrome were tested in a quiet room either in their schools or in their homes. The typically developing participants were tested individually in their school in a quiet room. The participants with Williams syndrome and with Down syndrome were tested first on the Leiter-R and then, according to their level of concentration, either on the same or on a different day, on the dot-probe task. The Leiter-R took approximately 30 min to administer and the dot-probe task another 15 min. Opportunities were given for short breaks within the room between tasks and between blocks of trials.
The participants were seated approximately 45 cm from the computer screen, which was at eye level. Following a brief explanation of the task, they were instructed to place the index fingers from each hand on the two marked keyboard keys and keep them there for the duration of a block of trials. They then completed several practice trials (average = 6 trials) and were asked if they were ready to “play the game.” They were told that there would be breaks, but during the game, they must keep their eyes on the screen and try to catch the star sign as soon as it appeared. On completion of the study, the participants with Williams syndrome and with Down syndrome received a certificate of appreciation and the typically developing children were offered a choice of stickers.
Results
Data cleaning and analysis
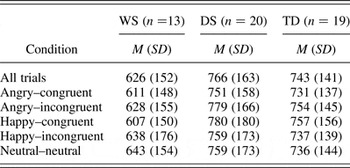
Responses in which the participant pressed the key on the opposite side from the probe's appearance on the screen in the dot-probe task and trials with RTs of <150 or >2000 ms were removed. Then, for each participant, trials with RTs deviating by more than 2.5 SD from the individual's mean RT were also excluded (Abend, Pine, & Bar-Haim, Reference Abend, Pine and Bar-Haim2014) in order to eliminate premature and delayed responses that might indicate an anticipatory response or loss of concentration. The mean number of trials eliminated for the Williams syndrome group and for the typically developing group was 5 (3% of all trials) and for the participants with Down syndrome was 7 (4%). The mean RTs for the different conditions for each group are presented in Table 1. Overall accuracy levels in the task were high across groups (>94%), suggesting that participants in all groups were actively engaged in the task and performed adequately.
Mean (standard deviation) of reaction time (ms) for each group and condition on the dot-probe task

Note: WS, Williams syndrome; DS, Down syndrome; TD, typically developing comparison group.
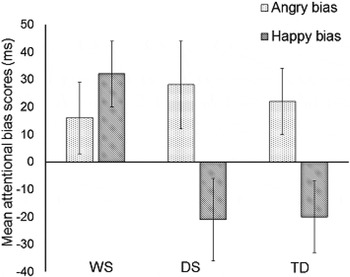
Univariate analyses of variance were used to compare groups on mean bias scores. The mean RT for all trials was entered as a covariate due to a significant difference between the groups on overall RT, F (2, 49) = 3.571, p = .036, with the Williams syndrome group displaying faster RTs. No effects were found for either CA or gender. Effects that were found for groups are reported below. Bias scores for all groups are displayed in Figure 2.
Mean attentional bias scores with standard error (ms).

Happy bias
A comparison of the participants with Williams syndrome, the participants with Down syndrome, and the MA-matched typically developing participants showed a difference in mean attention bias toward happy faces among the three groups, F (2, 48) = 3.54, p = .037, partial η2 = 0.129. Post hoc pairwise comparisons revealed that this finding resulted from a greater bias toward happy faces among the participants with Williams syndrome than among the participants with Down syndrome (p = .019) or the typically developing participants (p = .021). One-sample t tests indicated that the happy bias for the participants with Williams syndrome (M = 32 ms) differed from zero, t (12) = 2.54, p = .026, whereas the happy face avoidance bias for the participants with Down syndrome (M = –21 ms) did not differ from zero, t (20) = 1.42, p = .171. The avoidance bias for the happy face in the case of the typically developing children (M = –19 ms) also did not differ from zero, t (18) = 1.55, p = .139. Further, comparing the number of participants in each group with a bias away from or toward the happy face indicated that only 2 of the 13 participants with Williams syndrome showed a bias away from happy faces, whereas 11 participants with Down syndrome and 12 of the typically developing participants displayed this bias, χ2 (2) = 7.68, p = .021.
Based on Dodd and Porter's (Reference Dodd and Porter2010) analysis of attention bias among persons with Williams syndrome, the attention bias toward happy faces observed here was analyzed to ascertain whether it arose from a process of vigilance and engagement with the happy face or from a difficulty with disengagement. This analysis revealed a mean score of 36 ms (SD = 51.88) for engaging attention and –5 ms (SD = 68.75) for difficulty with disengaging attention from the happy face. The engagement score was significantly different from zero, t (12) = 2.53, p = .026.
Angry bias
When the mean bias scores for angry faces were compared for the three groups, no difference was found, F (2, 48) = 0.029, p = .971, partial η2 = 0.0001. One-sample t tests revealed that the mean angry bias did not differ from zero for the participants with Williams syndrome group (M = 16 ms), t (12) = 1.22, p = .246, the participants with Down syndrome (M = 28 ms), t (19) = 1.77, p = .092, nor for the typically developing children (M = 23 ms), t (18) = 1.93, p = .07. No difference was found between the groups in the proportion of participants allocating attention toward or away from angry faces, χ2 (2) = 2.27, p = .32.
Discussion
The allocation of attention to emotional expressions was examined among individuals with Williams syndrome and Down syndrome, two groups who show an affinity for social interactions. However, despite this commonality, the groups differed in significant ways. Relative to the participants with Down syndrome and those with typical development, the participants with Williams syndrome showed a specific attentional bias toward happy faces.
In contrast, the participants with Down syndrome appear to behave similarly to the children with typical development in all respects. Mean happy bias for both these groups indicated a numerical trend for their attention to be directed away from happy expressions that was not statistically indicative of attention bias. This finding is inconsistent with our hypothesis that the participants with Down syndrome would show a bias toward happy expressions, but to a lesser extent than that seen among the participants with Williams syndrome. In addition, participants with Down syndrome and participants with typical development displayed a tendency for attention to be directed toward angry facial expressions, although this bias was not statistically significant. This trend for attention to be directed toward angry faces is consistent with that found in Elam et al.'s (Reference Elam, Carlson, DiLalla and Reinke2010) study of attention bias in typically developing 5-year-olds, suggesting both an allocation of attention toward threat at this age and that the findings here are consistent with the MA of the individuals with Down syndrome. The present research is an initial study of attention allocation to facial expressions of emotion in persons with Down syndrome and, similar to other evidence regarding attention abilities among persons with Down syndrome (Goldman, Flanagan, Shulman, Enns, & Burack, Reference Goldman, Flanagan, Shulman, Enns and Burack2005; Randolph & Burack, Reference Randolph and Burack2000), the response of the participants appears comparable to the response of typically developing children of the same MA. Thus, attentional functioning in persons with Down syndrome appears intact at this developmental level, and the present study extends this conclusion to selective attention in interaction with emotion processing.
The finding of a significant happy bias in the Williams syndrome group is consistent with Dodd and Porter's (Reference Dodd and Porter2010) findings of a bias toward happy faces in individuals with Williams syndrome of a similar CA, and a MA of 8 years. Contrary to the earlier study, the findings here indicate that the happy bias among the participants with Williams syndrome is a result of attention being captured by happy faces rather than a problem with disengaging from the happy face (Dodd & Porter, Reference Dodd and Porter2010), although the extent to which the dot-probe paradigm enables the inference of engagement versus disengagement effects is debated (Bar-Haim et al., Reference Bar-Haim, Lamy, Pergamin, Bakermans-Kranenburg and IJzendoorn2007). Riby et al. (Reference Riby, Jones, Brown, Robinson, Langton, Bruce and Riby2011) suggest that persons with Williams syndrome experience difficulty in disengaging attention from faces in general. However, the current finding of a bias to happy faces arising as a result of attention capture and no bias to angry faces is consistent with Haas et al.’s (2009) observation of a heightened amygdala response to happy expressions in Williams syndrome, and thus appears to indicate that the neurological finding is reflected in attention processes. Citing evidence from a functional imaging study (Todd, Evans, Morris, Lewis, & Taylor, 2010) in which typically developing children aged 3–8 years were seen to exhibit greater amygdala activation for happy than for angry faces, Haas and Reiss (Reference Haas and Reiss2012) suggest that amygdala development may be delayed in Williams syndrome. If greater amygdala activation for happy faces is typical of young children's development and results in enhanced attention to happy faces, then it might be expected that the typically developing comparison group as well as the participants with Williams syndrome would show a bias toward happy faces when performing the dot-probe task. However, no happy bias was seen in the typically developing children aged 4–7 years, indicating that the bias seen in Williams syndrome may have sources other than, or in addition to, the postulated delay in amygdala development (Haas & Reiss, Reference Haas and Reiss2012).
The amygdala has strong anatomical connections with the orbitofrontal cortex (OFC), which is also involved in social cognition, including recognition of facial expressions. Meyer-Lindenberg et al. (Reference Meyer-Lindenberg, Hariri, Munoz, Mervis, Mattay, Morris and Berman2005) found that there was an abnormal pattern of activation of the OFC in individuals with Williams syndrome such that it did not participate in regulatory interactions with the amygdala. In further investigating the functioning of the OFC in people with Williams syndrome, Mimura et al. (Reference Mimura, Hoef, Kato, Kobayashi, Sheau, Piggot and Reiss2010) used functional magnetic resonance imaging to compare the response of seven adults with Williams syndrome and typically developing individuals of a similar age, to happy and angry faces. Individuals with typical development showed a differentiated level of activation in the medial and lateral OFC in the monitoring of reinforcers and punishers, respectively. The data from the individuals with Williams syndrome indicated reduced activation of the medial OFC when viewing happy faces relative to the activation seen in the typically developing participants (Mimura et al., Reference Mimura, Hoef, Kato, Kobayashi, Sheau, Piggot and Reiss2010), suggesting a reduction in the moderating effect on the amygdala's response to potential rewards. This lends support to the view that the unusual allocation of attention to happy faces seen in the present study may arise from neural networks involving both the amygdala and the prefrontal cortex.
In contrast to the happy bias found in the dot-probe task, the participants with Willliams syndrome did not show a bias to angry faces, and no difference was found in the comparison with the other groups. Null findings can be difficult to interpret, and it is possible that the similar trend observed among all the participants of a bias toward threat has different origins for each. Among persons with Williams syndrome, evidence for an increased activation of the medial OFC in response to negative emotional faces, in contrast to the more typical activation of this region in response to positive stimuli (Mimura et al., Reference Mimura, Hoef, Kato, Kobayashi, Sheau, Piggot and Reiss2010), suggests that the participants with Williams syndrome may have processed the angry faces as more rewarding than did the typically developing participants. Thus, participants with Williams syndrome might allocate attention to angry faces for their perceived reward value, whereas individuals with Down syndrome, similarly to young typically developing children and consistent with their MA, might show vigilance for threat arising from activation of the amygdala (Elam et al., Reference Elam, Carlson, DiLalla and Reinke2010).
A significant bias in attention allocation for happy faces, a bias not found in other groups, has now been found in two studies with individuals with Williams syndrome. Moreover, individuals with Williams syndrome show a striking level of homogeneity in their response bias in comparison to other groups of a similar developmental level (Broeren, Munis, Bouwmessler, Field, & Voerman, Reference Broeren, Munis, Bouwmessler, Field and Voerman2011). The difference in the pattern of attention bias to happy faces in the individuals with Williams syndrome and the individuals with Down syndrome potentially suggests that the tendency to the social approach behavior that is so predominant in people with Williams syndrome and that is also present in people with Down syndrome, is not necessarily the result of similar processes. Specifically, an attentional bias toward happy facial expressions, which is not sufficiently regulated by the OFC, could support approach behavior in persons with Williams syndrome, whereas different processes are involved among persons with Down syndrome. Although the similar approach behavior may have different origins in the two syndromes, other commonalities in cognition, such as poor response inhibition (Costanzo et al., Reference Costanzo, Varuzza, Menghini, Addona, Gianesini and Vicari2013; Porter et al., Reference Porter, Coltheart and Langdon2007), may contribute to the similarities in social approach. Evidence that poor response inhibition is a contributing factor in social approach behavior in children with Williams syndrome was found by Little et al. (Reference Little, Riby, Janes, Clark, Fleck and Rodgers2013). In their study, 25 children with Williams syndrome were tested on measures of emotion recognition, social approach, and response inhibition. Cluster analytic techniques used to reveal subgroups based on social approach behavior indicated that response inhibition, an ability associated with the prefrontal cortex, was the key differentiating variable. Similarly, in a study of persons with Williams and Down syndromes, as well as comparison groups of typically developing children and adults matched for MA and CA, respectively, Porter et al. (Reference Porter, Coltheart and Langdon2007) concluded that the tendency to approach strangers among both persons with Williams syndrome and persons with Down syndrome is most likely due to poor response inhibition. Thus, the neurological overarousal to happy faces observed among persons with Williams syndrome (Haas et al., Reference Haas, Mills, Yam, Hoeft, Bellugi and Reiss2009; Meyer-Lindberg et al., Reference Meyer-Lindenberg, Hariri, Munoz, Mervis, Mattay, Morris and Berman2005) may affect attention processes, but it is not necessarily a causal factor in social approach behavior. This would explain why our hypothesis concerning the participants with Down syndrome was not supported by the findings here.
Although the mechanisms behind social approach behavior likely result from a combination of factors, children with Williams syndrome might benefit from being trained to moderate their exaggerated response to happy faces using attention bias modification treatment (please see Bar-Haim, Reference Bar-Haim2010). The desired behavioral outcome would be a decrease in indiscriminate social approach in order to safeguard children with Williams syndrome in potentially dangerous social situations (Riby et al., Reference Riby, Kirk, Hanley and Riby2014). The relationship between approach behavior and allocation of attention after a period of training could provide a fruitful way of exploring further the mechanisms of social approach behavior. Intervention programs that seek to strengthen the inhibitory response of individuals with Williams syndrome (and with Down syndrome) in simulations of social situations might also contribute to a decrease in inappropriate social approach behavior (e.g., Fisher, Reference Fisher2014).
The results of the present study should be viewed in the light of potential limitations resulting from small sample sizes. Although the sample size here is typical in studies of people with Williams syndrome, the small numbers in the groups may have reduced statistical power and thus detection of effects. This problem arises from the relatively low incidence of Williams syndrome and the difficulty in locating study participants. In addition, the range of CAs and MAs within the group of participants with Williams syndrome was wide and contributed to the difficulty in matching the groups. A further potential limitation relates to the selection of the participants with typical development for the comparison group. More stringent screening would have contributed to greater control over the makeup of this group, although this might have resulted in a group that would be less representative of the typical population and thus limit generalizability.
In conclusion, this study replicated evidence of attention bias to happy faces among individuals with Williams syndrome, and extended it by contrasting it with attention allocation among individuals with Down syndrome. Thus, these findings facilitate greater precision in identifying the uniqueness of the social functioning observed among both persons with Williams syndrome and those with Down syndrome.