Introduction
The likelihood of parasitoids establishing in new geographic regions depends upon the availability of suitable host species. Identifying these hosts and the degree of their suitability is particularly important when they include species that are economically important as pests. Cotesia vanessae (Reinhard) (Hymenoptera: Braconidae) is a multivoltine, gregarious parasitoid of lepidopteran species in the families Noctuidae and Nymphalidae (Nixon, Reference Nixon1974; Papp, Reference Papp2011–2012). It has been commonly reported from the Palaearctic region (Hervet et al., Reference Hervet, Murillo, Fernández-Triana, Shaw, Laird and Floate2014), especially Europe and northern Africa, where populations may be either bisexual or parthenogenetic (Stefanescu et al., Reference Stefanescu, Askew, Corbera and Shaw2012). The first report of C. vanessae in North America was made from parthenogenetic specimens reared from tomato looper, Chrysodeixis chalcites (Esper) (Noctuidae), and cabbage looper, Trichoplusia ni (Hübner) (Noctuidae), collected in southern Ontario, Canada, in 2009 (Hervet et al., Reference Hervet, Murillo, Fernández-Triana, Shaw, Laird and Floate2014). The occurrence of C. vanessae in North America is probably the result of an accidental introduction. Both C. chalcites and T. ni are pests of economic concern (see Lindgren and Green, Reference Lindgren and Green1984; Murillo et al., Reference Murillo, Hunt and VanLaerhoven2013; Pacheco et al., Reference Pacheco, Vanlaerhoven, García and Hunt2018 and references therein; Pacheco et al., Reference Pacheco, Vanlaerhoven and Garcia2021). Given its reported host range, which includes pestiferous Noctuidae as well as some Nymphalidae, C. vanessae may potentially help suppress populations of pest species in North America. C. vanessae has previously been reported from species in the families Notodontidae, Lasiocampidae, Crambidae, and Pterophoridae but these records are old and possibly erroneous. Nixon (Reference Nixon1974) reported the ‘replacement of black by bright reddish yellow on the gaster’ in some C. vanessae specimens. Recent molecular advances clarifying the taxonomy of Microgastrinae provide evidence that when such differences are observed between specimens they likely represent different species, and a number of accepted names in the genus Cotesia are, or are suspected to be, complexes of cryptic species (Fernández-Triana et al., Reference Fernández-Triana, Shaw, Boudreault, Beaudin and Broad2020).
Family Noctuidae (armyworms, cutworms, semi-loopers, and others) includes numerous species that are pests of horticultural and agricultural crops (Zhang, Reference Zhang1994; Zahiri, Reference Zahiri2012; Floate and Hervet, Reference Floate, Hervet and Reddy2017). Common examples include cotton bollworm (Helicoverpa armigera (Hübner)) (Sharma et al., Reference Sharma, Gaur, Srinivasan and Gowda2014), African armyworm (Spodoptera exempta Walker) (Rose et al., Reference Rose, Dewhurst and Page1995), and fall armyworm (Spodoptera frugiperda (J. E. Smith)) (reviewed in Ramirez-Cabral et al., Reference Ramirez-Cabral, Kumar and Shabani2017). Economic damage can be particularly severe during outbreaks, which are typically sporadic but may last for several years and affect large geographic regions. In the northcentral USA, outbreaks of pale western cutworm (Agrotis orthogonia Morrison) and army cutworm (Euxoa auxiliaris (Grote)) from ~1965 to 1975 caused annual production losses estimated at about US$ 120 million (in 2021 dollars) (USDA, 1977). Production losses and operation costs associated with outbreaks of pale western cutworm in western Canada from 1929 to 1932 were estimated at about US$ 290 million (in 2021 dollars) (McMillan, Reference McMillan1935). Reports of local outbreaks affecting agricultural crops in the Canadian prairie provinces are common and typically are associated with army cutworm, armyworm (Mythimna unipuncta (Haworth)), bristly cutworm (Lacinipolia renigera (Stephens)), dingy cutworm (Feltia jaculifera (Guenée)), glassy cutworm (Apamea devastator (Brace)), pale western cutworm, red-backed cutworm (Euxoa ochrogaster (Guenée)), and variegated cutworm (Peridroma saucia (Hübner)) (Floate, Reference Floate2017).
The overall intent of this study was to examine the development of C. vanessae on different lepidopteran species present in North America with a twofold objective. First and foremost, we wanted to assess this parasitoid as a potential biological control agent of economic pest species. Second, we wanted to assess the risk that this adventive parasitoid might pose to native non-pest species of Lepidoptera. Fitness is ideally measured as lifetime reproductive success but obtaining this metric can be logistically difficult. In such cases, fitness can be measured indirectly using parameters that can include parasitism success, individual mass, size, and developmental time (Godfray, Reference Godfray1994; Roitberg et al., Reference Roitberg, Boivin and Vet2001; Harvey, Reference Harvey2005).
To achieve this objective, we report results on the suitability of 47 species of Lepidoptera as potential hosts for C. vanessae, most of which are noctuid species that are pests of agricultural crops in North America. For species that supported parasitoid development, we also recorded successful parasitism rate, development time, brood size, brood mass, and individual parasitoid mass. Non-pest species and species in families other than Noctuidae were included to investigate the limits of C. vanessae's host range. C. vanessae completed development in 34 species, of which three were known hosts (Noctuidae) and 31 (30 Noctuidae, 1 Nymphalidae) were not. The suitability of many lepidopteran species as hosts suggests that C. vanessae will become established throughout North America and contribute to the suppression of noctuid pest populations.
Materials and methods
Selection of species
We selected species using an approach similar to that of Wapshere (Reference Wapshere1974), in which species that are tested are increasingly more distantly related to the known hosts until the limit of the host range is reached. Previous work reported that C. vanessae had been reared from field-collected species in the subfamilies Plusiinae, Noctuini, Leucaniini, and Prodeniini (family Noctuidae), and in the tribe Nymphalini (family Nymphalidae) (Nixon, Reference Nixon1974; Shaw et al., Reference Shaw, Stefanescu, van Nouhuys, Settele, Shereeve, Konvicka and van Dyck2009; Stefanescu et al., Reference Stefanescu, Askew, Corbera and Shaw2012; Hervet et al., Reference Hervet, Murillo, Fernández-Triana, Shaw, Laird and Floate2014). Thus, we sought to obtain a broad range of species from different subfamilies of Noctuidae, from the family Erebidae (closely related to Noctuidae) and from different subfamilies of Nymphalidae, including Nymphalinae (incl. tribe Nymphalini) plus more distantly related species whenever the opportunity arose. However, because of difficulties obtaining a range of species in a number of these taxonomic groups, most species tested were pests in the family Noctuidae, which were easier to procure.
Insect sources and species verification
C. vanessae were obtained from a colony held at the Lethbridge Research and Development Centre (LRDC), Agriculture and Agri-Food Canada, in Lethbridge, AB, Canada. Source material for the colony was obtained in 2011 from H. Murillo Pacheco, who established it with adults reared from caterpillars of C. chalcites and T. ni collected in southern Ontario in 2009 and 2010 (Hervet et al., Reference Hervet, Murillo, Fernández-Triana, Shaw, Laird and Floate2014; Pacheco et al., Reference Pacheco, Vanlaerhoven, García and Hunt2018). The colony was maintained on T. ni reared on a modified McMorran diet (McMorran, Reference McMorran1965; Grisdale, Reference Grisdale1973; Hervet et al., Reference Hervet, Laird and Floate2016). Eggs of T. ni and diet were purchased from Insect Production Service, Natural Resources Canada, Sault Ste., Marie, ON, Canada. Rearing methods are described in Hervet (Reference Hervet2017) and Hervet et al. (Reference Hervet, Laird and Floate2016). For clarity, in subsequent text, larval stages of C. vanessae are referred to as ‘larvae’, whereas larval stages of lepidopteran species are referred to as ‘caterpillars’.
Lepidoptera were field-collected or purchased as described in table 3-1 of Hervet (Reference Hervet2017). Some species were obtained as eggs recovered from gravid females collected in UV light traps operated at Lethbridge in the summers and autumns of 2012–2014. Other species were purchased as eggs from Benzon Research Inc., Carlisle, PA, USA (Canadian Food Inspection Agency Import Permits No. P-2011-04397, P-2013-02134, P-2014-02394). A smaller number of species were collected in the field as eggs or caterpillars. When numbers permitted (ca. 50+ individuals per species), field-collected material was used directly for host testing; i.e., Apamea sordens (Hufnagel), Dargida diffusa (Walker) (Noctuidae), Aglais milberti (Godart) (Nymphalidae), Malacosoma disstria Hübner (Lasiocampidae), and Pieris rapae (L.) (Pieridae). Otherwise, caterpillars were reared to produce a second generation that was used for host testing. Caterpillars of most species were successfully reared on a modified McMorran diet using methods described in Hervet et al. (Reference Hervet, Laird and Floate2016).
Species' identifications were determined by their morphological traits and use of DNA barcoding. Species were initially identified using taxonomic keys (Eichlin, Reference Eichlin1975; Eichlin and Cunningham, Reference Eichlin and Cunningham1978; Schmidt, Reference Schmidt2015) and with reference to preserved specimens in the main insect collection at the LRDC. Species identifications were subsequently verified with cytochrome c oxidase subunit 1 (COI) barcodes, using primers and general methods described in Hebert et al. (Reference Hebert, Cywinska, Ball and deWaard2003). DNA extractions and amplifications were done at the LRDC; sequencing was done at the University of Calgary (University Core DNA Services, Calgary, Alberta, Canada).
The sole exception to the above procedures was limited to parasitoids recovered by the senior author (VADH) in 2019 at Winnipeg, Manitoba from a caterpillar of the painted lady butterfly, Vanessa cardui (Nymphalidae), feeding on creeping thistle, Cirsium arvense (L.) Scopoli (Asteraceae). The morphology of these parasitoids was consistent with C. vanessae, but physical specimens of this species have not been reported in North America from outside of Ontario (but see Hervet et al., Reference Hervet, Murillo, Fernández-Triana, Shaw, Laird and Floate2014). To confirm this determination, DNA was extracted, amplified, and sequenced at the University of Manitoba in Winnipeg using the general methods and primers (LepF and LepR) described in Hajibabaei et al. (Reference Hajibabaei, Janzen, Burns, Hallwachs and Hebert2006).
Host testing
Host suitability was assessed in no-choice tests in which fourth-instar caterpillars were individually exposed to C. vanessae females. Preliminary studies showed fourth-instars to be most readily parasitized and to produce larger parasitoid broods relative to earlier instars. Use of later instars increased the risk that caterpillars might pupate before parasitoids were able to complete development. When fourth-instars were unavailable, fifth-instars typically were used instead. Most species were assessed for host suitability using 30–35 caterpillars, but numbers ranged from 1 (Amphipyra tragopoginis (Clerck) (Noctuidae)) to 75 (Helicoverpa zea (Boddie) (Noctuidae)) depending upon availability.
Caterpillars were subjected to parasitism by holding them with soft metal forceps in a colony cage of adult C. vanessae in contact with a parasitoid's antennae. This usually resulted in the parasitoid immediately inserting its ovipositor into the caterpillar, typically for ~10–20 s, accompanied by the upward positioning of wings, and the middle and hind legs (see video entitled ‘Parasitoid Cotesia vanessae parasitizing a cabbage looper (Trichoplusia ni) caterpillar’ at https://www.youtube.com/watch?v=CvOe5dy0c1s). We interpreted this behaviour as parasitism; i.e., eggs being laid in the host. Occasionally, this response did not occur. In this case, the caterpillar was exposed to a different parasitoid for ~3 s. This was repeated until parasitism was observed. If parasitism was still not observed after exposure to about ten parasitoids, a parasitoid was aspirated into a small plastic container containing a caterpillar (BioQuip Products, Rancho Dominguez, California, USA, catalogue no. 1135A). This process usually triggered immediate parasitism. If parasitism was still not observed, exposures were repeated using older parasitoids available as we observed that parasitoids eclosed from cocoons for some time were more likely to parasitize certain lepidopteran species. Parasitoids used in experiments were typically 1–3 weeks old. Ultimately, all caterpillars of all lepidopteran species subjected to parasitism did experience parasitism, excluding Spilosoma virginica Fabricius (Erebidae: Arctiinae) caterpillars. Exposure of 30 individuals of this species failed to produce parasitism, possibly because of protection conferred by their dense pubescence.
During parasitism, the caterpillar and the attached parasitoid were carefully transfered from the C. vanessae colony cage to a translucent plastic ‘test’ cup (240 ml, Polar Plastic Ltd, Saint Laurent, QC). The parasitoid remained in this cup for 48 h to allow potential further parasitism (although this was rarely observed), then was removed. The same method was used for S. virginica although no parasitism was observed prior to placing a caterpillar in a cup with a parasitoid. The bottom of each cup contained a disc of filter paper (55 mm diameter) on which a block (7.3 ml) of artificial diet (modified McMorran diet; see Hervet et al., Reference Hervet, Laird and Floate2016) was placed. Pieces of wax paper (3 × 3 cm2) were placed in contact with the upper and lower surfaces of the diet block to reduce desiccation. To prolong parasitoid longevity during the 48 h that the parasitoid was retained in the cup with the host, the inside of the cup was lightly misted with water, and a drop of honey was placed on top of the upper piece of wax paper. Air holes (ca. 0.5 mm diameter) in the bottom and in the lid of the cup allowed for airflow and reduced moisture accumulation. On an approximate 5-day cycle (more often if required), diet blocks were replaced and frass within the cup was discarded. Foliage from host plants were used to rear species that did not develop on the artificial diet; i.e., A. milberti, P. rapae, Habrosyne scripta (Gosse) (Drepanidae), and Hyles euphorbiae (Linnaeus) (Sphingidae). Leaves attached to short sections of stem were placed onto a piece of wax paper to avoid contact with the filter paper and misted daily with water to reduce wilting. Foliage was replaced every 2–4 days (more often if required). Cups were held under conditions of 20 °C, 70–80% humidity, with a 12:12 h light:dark cycle. Rearing conditions were monitored with a data logger placed inside an empty cup in contact with test cups.
Parasitized caterpillars were held in test cups until either parasitoid larvae emerged (=successful parasitism; note the explicit distinction between ‘parasitism’ and ‘successful parasitism’), the caterpillars died from other reasons, or until adult metamorphosis. Adult metamorphosis for almost all Lepidoptera species tested was observed, but required up to 8 months for Mamestra configurata Walker (Noctuidae). No adults emerged from apparently healthy pupae formed by H. euphorbiae and H. scripta, suggesting that an obligatory cold treatment was required to break pupal diapause.
Oviposition experiment
Although the caterpillars of some species readily supported egg-to-adult development of C. vanessae (e.g., T. ni), caterpillars of other species survived parasitism to metamorphose into adults (e.g., H. zea). We subsequently performed an oviposition experiment to determine if these latter cases reflected a lack of oviposition by the parasitoid or an immune response by the caterpillar that prevented parasitoid development. Caterpillars of H. zea (n = 20) and T. ni (n = 20) were exposed to C. vanessae, as previously described, until parasitism by adult parasitoids was observed. Five caterpillars of each species were then immediately dissected and examined for parasitoid eggs. The remaining caterpillars were held in individual cups, as previously described, with subsets dissected during the next 11 days for observations of parasitoid larvae and host immune reaction. For these dissections, the head and the last rear abdominal segments of each caterpillar were excised and the digestive system removed. Haemolymph was then squeezed from the haemocoel onto a microscope slide, diluted with one drop of saline solution, topped with a coverslip, and examined using a compound light microscope (400×). Caterpillars dissected immediately after parasitism had large fat bodies that clouded the haemolymph and hindered observations. Thereafter, caterpillars were starved for 2 days prior to dissection to shrink their fat bodies.
Nonreproductive killing
For nearly all host species tested, several caterpillars died following parasitism but without parasitoid emergence. A few caterpillars used in tests were field collected and could have died of diseases but most caterpillars used in tests were reared to at least one generation in the lab and came from healthy colonies. We therefore suspected that exposure to parasitism somehow induced the death of most caterpillars that died without parasitoid emergence – a phenomenon that has been referred to by previous authors as ‘nonreproductive killing’, which is part of parasitoids ‘nonreproductive effects’ (Abram et al., Reference Abram, Brodeur, Urbaneja and Tena2019). This phenomenon was particularly evident for S. frugiperda for which all caterpillars subjected to parasitism in host trials died without producing parasitoids. To test if nonreproductive killing took place, fourth-instar S. frugiperda were haphazardly removed from a colony cage and at this ‘initial time’ (T 0) they were either subjected (n = 35 caterpillars) or not subjected (n = 35 caterpillars) to parasitism. The caterpillars were then reared individually using methods previously described and monitored to record time to death, time to pupation, and (or) time to adult emergence. To better understand the cause of this phenomenon, the haemolymph of S. frugiperda caterpillars was observed with a compound light microscope (400×) immediately after their death.
Host suitability
Species for which no caterpillars that experienced parasitism produced parasitoids were classified as non-hosts; those that did produce parasitoids were classified as hosts.
We measured the suitability of Lepidoptera species for C. vanessae using a suite of up to seven fitness parameters. The first of these was percentage of successful parasitism (parameter 1). This was defined as the percentage of caterpillars that experienced parasitism from which parasitoid larvae emerged (excluding caterpillars that died without producing parasitoids). Third-instar C. vanessae larvae typically emerge en masse from the host to immediately begin spinning cocoons in which they pupate and subsequently emerge as adults (see video entitled ‘Parasitoid larvae (Cotesia vanessae) emerging from their caterpillar host (Trichoplusia ni)’ at https://www.youtube.com/watch?v=JCDbJMLE2JU) (Hervet et al., Reference Hervet, Murillo, Fernández-Triana, Shaw, Laird and Floate2014). Thus, we measured the following six additional parameters: parameter 2 = time for egg + larval development (i.e., the number of days from parasitism to emergence of larvae); parameter 3 = time for pupal development (i.e., the number of days from larval emergence from the host to emergence of adults from the cocoon mass); parameter 4 = time for egg-to-adult development (i.e., parameter 2 + parameter 3); parameter 5 = brood size (i.e., the number of adult parasitoids from an individual host, excluding adults that failed to emerge from cocoons); parameter 6 = average adult mass per brood (i.e., for each brood, the average mass of individual parasitoids dried at 20 °C and 20% relative humidity for at least 1 month); parameter 7 = total adult mass per brood (i.e., parameter 5 × parameter 6). For parameter 6, average adult mass was initially calculated by averaging the mass of ten individual adults under pristine conditions weighed separately. When this process proved to be too time consuming, average adult mass was calculated by weighing 30 adults simultaneously and then dividing by 30. The bulk mass approach was used for Abagrotis reedi Buckett, Actebia balanitis (Grote), Agrotis ipsilon (Hufnagel), Anagrapha falcifera (Kirby), Anaplectoides prasina (Denis & Schiffermüller), A. devastator, Apamea lignicolora (Guenée), Caradrina morpheus (Hufnagel), Chrysodeixis includens (Walker), D. diffusa, Feltia herilis (Grote), H. zea, Heliothis virescens (Fabricius), Lacanobia grandis (Guenée), M. unipuncta, and Spaelotis clandestina (Harris) (Noctuidae).
Phylogeny of lepidopteran species
To measure the genetic relatedness of the Noctuidae and Erebidae species that we tested in our study, we generated COI sequences. These sequences were supplemented with additional sequences from GenBank (http://www.ncbi.nlm.nih.gov/genbank/) (Benson et al., Reference Benson, Karsch-Mizrachi, Lipman, Ostell and Wheeler2005) and Barcode of Life Data Systems (BOLD) (https://www.boldsystems.org/) (Ratnasingham and Hebert, Reference Ratnasingham and Hebert2007) for species that are considered reliable hosts for C. vanessae (Hervet et al., Reference Hervet, Murillo, Fernández-Triana, Shaw, Laird and Floate2014), but which we did not test. A neighbour-joining tree (Kimura two-parameter distance) was generated to assess the host quality of different clades of Noctuidae according to the maximum likelihood of evolutionary distance among species based on their COI sequences (Kimura, Reference Kimura1980), and to predict the suitability of non-tested species as hosts for C. vanessae (Supplementary fig. 1).
Data analyses
A Fisher's exact test was used to determine whether the percentage of S. frugiperda caterpillars that died without producing parasitoids was contingent on C. vanessae parasitism. A Welch's two-sample t-test was used to compare time to death of the parasitized group with the time to emergence of adult moths of the non-parasitized group.
A \chi2 contingency test was used to test whether the percentage of successful parasitism differed among host species, followed by post-hoc comparisons using Fisher's exact tests with Bonferroni corrections (parameter 1). Because of uncertainty regarding its cause for most species, data associated with caterpillars dying without producing parasitoids were excluded from this analysis and subsequent analyses. Caterpillars dying without producing parasitoids may have been a consequence of C. vanessae parasitism; i.e., nonreproductive killing. However, it may have instead or additionally reflected infection by pathogens or, in the case of field-collected material, parasitism by other parasitoid species. Excluding these data from consideration may have inflated our estimates of percentage of successful parasitism. For example, if 30 caterpillars of a given species were parasitized and ten each either survived to become adults, produced adult parasitoids (i.e., successful parasitism), or died without producing parasitoids, percentage of successful parasitism would be calculated as 50% (10/20) rather than as low as 33% (10/30; i.e., if caterpillar deaths were a result of nonreproductive killing, rather than other incidental, unrelated causes not caused by parasitism). In any case, this did not affect our determination of whether a given test species was a host for C. vanessae.
Prior to examining the effect of host species on the remaining fitness parameters 2 through 6, data were assessed for assumptions of normal distribution and homoscedasticity using residual-by-predicted plots. These assumptions were met for measures of time for pupal development (parameter 3), brood size (parameter 5), and average adult mass per brood (parameter 6). The effect of host species on these parameters was therefore examined using one-way analysis of variance (ANOVA). When a host effect was detected, Tukey's range tests were performed to identify statistically significant differences among host species. Assumptions of normal distribution and homoscedasticity were not fully met for measures of time for egg + larval development (parameter 2), time for total development (parameter 4), or estimated total brood mass (parameter 7). The effect of host species on these latter three parameters was therefore examined using Kruskal–Wallis tests. When a host effect was detected, post-hoc tests were performed using Dunn tests (pairwise multiple comparisons using rank sums, corrected according to Bonferroni) to identify the species between which differences occurred.
Degrees of freedom sometimes varied among statistical tests depending upon the parameter being measured. For example, a lack of data on development time for a specific brood did not impede the measurement of its mass.
All analyses were conducted in R version 3.3.0 (Fox and Weisberg, Reference Fox and Weisberg2011; Dinno, Reference Dinno2016; R Core Team, 2016). Unless otherwise stated, all values are reported as means ± SEMs.
Results
With one exception, the determination of species examined in the current study was unambiguous and supported by both morphological characters and COI barcodes. For the exception, the morphology of Abagrotis sp. was most similar to Abagrotis orbis (Grote), but had closest genetic similarity to the morphologically similar Abagrotis baueri McDunnough (Noctuidae). COI sequences obtained in the current study for test species as potential hosts were deposited in GenBank (https://www.ncbi.nlm.nih.gov/genbank/) under accession numbers as reported in table 1. The COI sequence obtained for a parasitoid recovered in Winnipeg confirmed its morphological determination as C. vanessae (accession no. MW417940).
Host suitability of lepidopteran species exposed to parasitism by C. vanessae

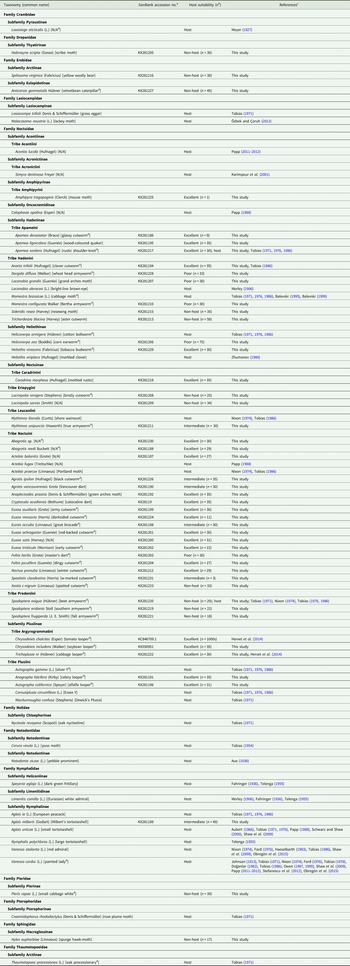
Host suitability categories reflect the percentage of successful parasitism (parameter 1) in the current study: excellent ([parameter 1] ≥80%), intermediate (20% ≤ [parameter 1] < 80%), poor (0% < [parameter 1] < 20%), or non-host (egg-to-adult development not supported). A host suitability of ‘Host’ is based on published reports that otherwise provide no indication of suitability.
a The identity of species tested in the current study was verified using COI gene sequences that were deposited in GenBank under the specified accession number.
b n = number of caterpillars that experienced parasitism (with the exception of S. virginica, on which parasitism could not be observed).
c Nearly all the references cited for host records are from Yu et al. (Reference Yu, Van Achterberg and Horstmann2015). Where possible, we tried to verify the information in the original source.
d Occasional or common pest of economic significance.
Results identified egg-to-adult development of C. vanessae on 34 of the 47 lepidopteran species tested, including 31 species not previously reported to be hosts (table 1). Previous reports of C. vanessae developing in Anarta trifolii, A. sordens, and T. ni (Tobias, Reference Tobias1971, Reference Tobias1976, Reference Tobias and Medvedev1986; Hervet et al., Reference Hervet, Murillo, Fernández-Triana, Shaw, Laird and Floate2014) were confirmed. For species on which C. vanessae did not develop (table 1), the parasitized hosts either survived to complete development or died prior to pupation. At one extreme, 27 of 29 parasitized individuals of Spodoptera exigua (Hübner) survived to become adults and two died without producing parasitoids, whereas at the other extreme only 19 of 58 parasitized Trichordestra lilacina (Harvey) survived (Supplementary table 1).
Oviposition experiment
Results of the oviposition experiment showed that all caterpillars that experienced parasitism contained parasitoid eggs. The ability of caterpillars to survive and become moths was therefore attributed to the effectiveness of the host's immune system, rather than due to a lack of parasitism. Eggs and (or) larvae were observed in each of the T. ni and H. zea caterpillars that experienced parasitism (images in Hervet et al., Reference Hervet, Laird and Floate2018). Eggs were observed for up to 4 days post-parasitism with the appearance of larvae starting 5 days post-parasitism. Encapsulation of parasitoid eggs and larvae by the host's haemocytes is a normal immune response of lepidopteran larvae to parasitism (Lavine and Strand, Reference Lavine and Strand2002). In T. ni, a host with a high percentage of successful parasitism, encapsulation of eggs or larvae was not observed. In H. zea, a host with a low percentage of successful parasitism, encapsulation of eggs was observed 4 days after parasitism. All H. zea caterpillars dissected 11 days post-parasitism contained numerous dead first-instar larvae encapsulated by haemocytes. Only one dissected H. zea contained non-encapsulated live larvae alongside dead encapsulated smaller larvae, indicating that some parasitoid larvae evaded the host's immune response while others didn't within the same caterpillar.
Nonreproductive killing
In the experiment that tested the association between caterpillars that died not producing parasitoids and parasitism, all 35 parasitized S. frugiperda died not producing parasitoids, whereas all 35 non-parasitized S. frugiperda survived to become adults. These two outcomes were significantly different (Fisher's exact test, P < 0.001), confirming a case of parasitoid nonreproductive killing. Caterpillars from the parasitized group matured to their last instar, but did not pupate. Instead, they stopped excreting frass, became bloated until their integuments were tightly stretched, and eventually slowly turned dark and shrunk. The time taken for parasitized individuals to die (50 days ± 1.97 after T 0) was significantly longer than that required for non-parasitized individuals to metamorphose to adults (Welch's two-sample t-test, t = −7.45, df = 40.35, P < 0.001) (pupated in 18 days ± 0.34 after T 0, and emerged as moths in 37 days ± 0.61 after T 0). Dissection of parasitized individuals at time of death showed that their gut was full of food and was so bloated it nearly occupied the entire haemocoel. Their bodies were nearly depleted of haemolymph, which contained dead encapsulated first instar parasitoids.
Host suitability
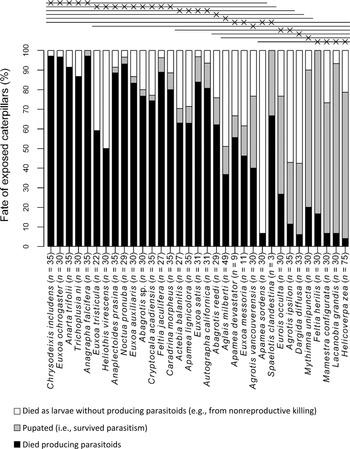
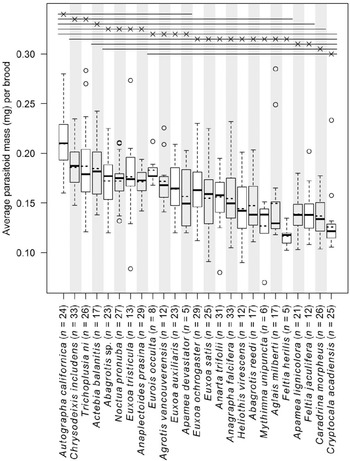
An effect of host species was detected for each of the seven fitness parameters measured for C. vanessae. Across host species, percentage of successful parasitism (parameter 1) ranged from <10% to close to 100% (${\rm \chi }_{32}^2$ = 451.98, P < 0.001; fig. 1). Effects of host species were detected for eggs + larval development time (parameter 2) (Kruskal–Wallis test, ${\rm \chi }_{24}^2$
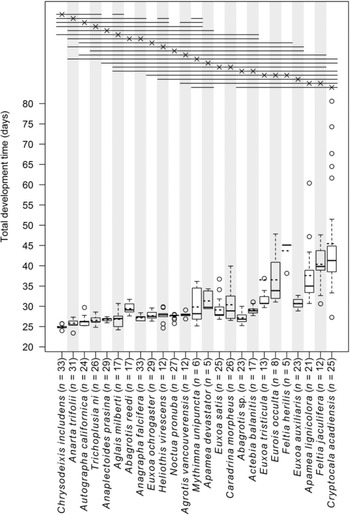
 = 415.94, P < 0.001), pupal development time (parameter 3) (ANOVA, F 24, 474 = 7.08, P < 0.001), and egg-to-adult development time (parameter 4) (Kruskal–Wallis test, ${\rm \chi }_{24}^2$
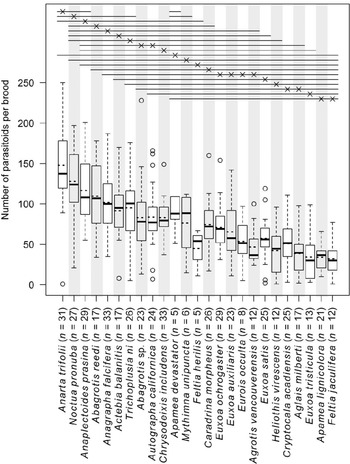
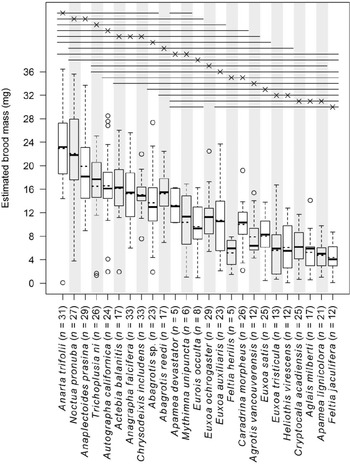
 = 383.41, P < 0.001; fig. 2). Parasitoids developing in F. herilis (n = 5) exhibited the longest times observed for both egg + larval development (32.7 ± 1.4 days) and for pupal development (11.1 ± 0.1 days). Brood size (parameter 5) showed a strong effect of host species (ANOVA, F 24, 445 = 19.5, P < 0.001; fig. 3), but varied considerably even within a host species. For example, the size of broods emerging from A. trifolii ranged from 1 to 250 individuals, this latter brood being the largest observed in the study. Host species also affected the average mass of individual parasitoids (parameter 6) (ANOVA, F 24, 484 = 13.13, P < 0.001; fig. 4), and the total mass of individuals in the same brood; i.e., brood mass (parameter 7) (Kruskal–Wallis test, ${\rm \chi }_{24}^2$
 = 310.24, P < 0.001; fig. 5). Within broods, however, the mass of individual parasitoids was relatively constant. For example, the maximum difference in mass for parasitoids of the same brood developing in T. ni ranged between 0.02 mg (0.11 vs. 0.13 mg, n = 10) and 0.12 mg (0.14 vs. 0.26 mg, n = 10). Across broods, however, the observed maximum difference in individual mass was 0.25 mg (0.08 vs. 0.33 mg, n = 251 individuals combined across 26 broods from T. ni). Perhaps not surprisingly, the three host species that produced the heaviest broods also produced the largest broods; i.e., A. trifolii, Noctua pronuba, and A. prasina.
Fate of caterpillars of Lepidoptera species that produced C. vanessae. Rate of successful parasitism (i.e., per cent caterpillars that died producing parasitoids from all caterpillars of a particular species that experienced parasitism, not including these that died without producing parasitoids) of each host species was analysed with Fisher's exact tests comparing pairs of species (α = 0.05, corrected according to Bonferroni). Significance is indicated by horizontal lines above the boxes. Each ‘x’ refers to a particular species, and the line it stands on indicates the species that did not have a significantly different successful parasitism rate from the species represented by the ‘x’. Species order was chosen according to the most parsimonious display of the results of the statistical analysis. A. tragopoginis (Clerck) also produced C. vanessae but is not shown here because only one individual experienced parasitism.

C. vanessae time for egg-to-adult development (total development time) in different host species. The boxes delimit the 25th and 75th percentiles (Q1 and Q3, respectively). The upper and lower whiskers indicate the highest observed value not greater than Q3 + 1.5 IQR and the lowest observed value not less than Q1 − 1.5 IQR, respectively (where IQR = interquartile range). Medians and means are represented by solid lines and dotted lines, respectively. Significance (Kruskal–Wallis test followed by post-hoc Dunn test, α = 0.05 corrected according to Bonferroni) is indicated by horizontal lines above the boxes. Each species is represented by an ‘x’ standing on a line that indicates other species with similar successful parasitism rates. Species order was chosen according to the most parsimonious display of the results of the statistical analysis. For statistical rigour, analyses exclude species for which data derived from fewer than five parasitized individuals. Total development times (mean ± SE) in these latter species was: A. ipsilon (26.8 ± 0.2 days, n = 4), A. sordens (30.7 ± 0.8, n = 2), D. diffusa (31.3 ± 1.3, n = 3), E. messoria (Harris) (29.0 ± 2.5, n = 3), H. zea (27.6 ± 0.6, n = 3), L. grandis (28.2 ± 24.5, n = 2), M. configurata (27.8 ± 0.02, n = 2), and S. clandestina (28.5 ± 0.2, n = 2).

C. vanessae brood sizes on each host species. The boxes delimit the 25th and 75th percentiles (Q1 and Q3, respectively). The upper and lower whiskers indicate the highest observed value not greater than Q3 + 1.5 IQR and the lowest observed value not less than Q1 − 1.5 IQR, respectively. Medians and means are represented by solid lines and dotted lines, respectively. Significance (one-way ANOVA followed by post-hoc Tukey's HSD, α = 0.05) is indicated by horizontal lines above the boxes. Each species is represented by an ‘x’ standing on a line that indicates other species with similar brood sizes. Species order was chosen according to the most parsimonious display of the results of the statistical analysis. For statistical rigour, analyses exclude species for which data derived from fewer than five parasitized individuals. Average brood size (mean ± SE) in these latter species was: A. ipsilon (71.5 ± 18.0, n = 4), A. tragopoginis (42, n = 1), A. sordens (1, n = 1), D. diffusa (28.0 ± 23.17, n = 3), H. zea (24.0 ± 16.3, n = 3), L. grandis (130.0 ± 24.5, n = 2), M. configurata (119.0 ± 16, n = 2), and S. clandestina (120.0 ± 20.5, n = 2).

C. vanessae average adult individual dry mass per brood (average of 30 or fewer wasps per brood) on each host species. The boxes delimit the 25th and 75th percentiles (Q1 and Q3, respectively). The upper and lower whiskers indicate the highest observed value not greater than Q3 + 1.5 IQR and the lowest observed value not less than Q1 − 1.5 IQR, respectively. Medians and means are represented by solid lines and dotted lines, respectively. Significance (one-way ANOVA followed by post-hoc Tukey's HSD, α = 0.05) is indicated by horizontal lines above the boxes. Each species is represented by an ‘x’ standing on a line that indicates other species with similar individual parasitoid mass. Species order was chosen according to the most parsimonious display of the results of the statistical analysis. For statistical rigour, analyses exclude species for which data derived from fewer than five parasitized individuals. The average mass of individual parasitoids per brood (mean ± SE) in these latter species was: A. ipsilon (0.15 ± 0.003 mg, n = 4), A. sordens (0.24 mg, n = 1), D. diffusa (0.14 ± 0.023 mg, n = 3), H. zea (0.17 ± 0.023 mg, n = 3), L. grandis (0.13 ± 0.004, n = 2), M. configurata (0.15 ± 0.010 mg, n = 2), and S. clandestina (0.16 ± 0.024 mg, n = 2).

C. vanessae estimated brood mass per host (average mass of 30 or fewer wasps per brood × brood size) on each host species. The boxes delimit the 25th and 75th percentiles (Q1 and Q3, respectively). The upper and lower whiskers indicate the highest observed value not greater than Q3 + 1.5 IQR and the lowest observed value not less than Q1 − 1.5 IQR, respectively. Medians and means are represented by solid lines and dotted lines, respectively. Significance (Kruskal–Wallis test followed by post-hoc Dunn tests, α = 0.05 corrected according to Bonferroni) is indicated by horizontal lines above the boxes. Each species is represented by an ‘x’ standing on a line that indicates other species with similar individual parasitoid mass. Species order was chosen according to the most parsimonious display of the results of the statistical analysis. For statistical rigour, analyses exclude species for which data derived from fewer than five parasitized individuals. The average brood mass (mean ± SE) in these latter species was: A. ipsilon (10.6 ± 2.4 mg, n = 4), A. sordens (0.2 mg, n = 1), D. diffusa (3.9 ± 3.1 mg, n = 3), H. zea (4.4 ± 3.1 mg, n = 3), L. grandis (17.2 ± 3.7 mg, n = 2), M. configurata (18.4 ± 3.6 mg, n = 2), and S. clandestina (18.7 ± 0.5 mg, n = 2).

Many suitable hosts were identified in families Noctuidae and Nymphalidae in the current study and from previous reports in the literature (table 1). For example, of 18 species tested in the current study for tribe Noctuini (subfamily Noctuinae), only Xestia c-nigrum was identified as a non-host. However, membership in closely related tribes was not necessarily an indicator of host suitability. None of the three species of Spodoptera (tribe Prodeniini: subfamily Noctuinae) tested in the current study supported C. vanessae development.
Discussion
Host range and host suitability
Our overall results show that C. vanessae has a broad fundamental host range with many host species in families Noctuidae and Nymphalidae – a finding consistent with previous reports of host associations for this parasitoid. In the current study, we documented egg-to-adult development of C. vanessae on 31 species of Lepidoptera (30 Noctuidae, 1 Nymphalidae) for which this information was previously not known, and confirmed three (Noctuidae) previously reported host records. The literature identifies a further 30 host species in eight lepidopteran families; i.e., Noctuidae (15), Nymphalidae (7), Notodontidae (2), Lasiocampidae (2), Nolidae (1), Pterophoridae (1), Crambidae (1), Thaumetopoeidae (1) (table 1). However, some of the earlier reports (i.e., those outside of family Noctuidae and subfamily Nymphalinae) should be interpreted with caution. C. vanessae previously has been reported to develop in S. exigua (Tobias, Reference Tobias1971), but neither it nor its congeners Spodoptera eridania and S. frugiperda supported parasitoid development in the current study (table 1). This does not necessarily negate the previous report, as exposure to parasitism may lead to different outcomes. During our tests of A. trifolii, subjection to parasitism of one cohort of caterpillars (n = 30) from adults collected in Lethbridge in 2013 resulted in all individuals dying of nonreproductive killing. In contrast, subjection to parasitism for a second cohort of caterpillars (n = 35) from adult A. trifolii collected in Lethbridge in 2014 (fig. 1) resulted in parasitoids emerging from almost all individuals. COI sequences of one specimen from both cohorts confirmed the identity as A. trifolii (GenBank accession numbers: KX281193 and KX281194). The larger concern is that previous reports of parasitoid–host associations rarely provide strong evidence of accurate identification of species, either for field-collected caterpillars or emerged parasitoids (Nixon, Reference Nixon1974). For this reason, we place greatest weight on reports of C. vanessae developing in species of Noctuidae and Nymphalinae, for which species determinations of both parasitoid and host either were verified with DNA barcoding (current study) or which derive from other reliable sources (Shaw et al., Reference Shaw, Stefanescu, van Nouhuys, Settele, Shereeve, Konvicka and van Dyck2009; Stefanescu et al., Reference Stefanescu, Askew, Corbera and Shaw2012; Hervet et al., Reference Hervet, Murillo, Fernández-Triana, Shaw, Laird and Floate2014). Given its broad host range within these two taxonomic families, it is reasonable to suggest that C. vanessae has generalist tendencies, possibly allowing it to also develop in lepidopteran species of other families. However, we suggest that previous reports of hosts, particularly in Crambidae, Lasiocampidae, Nolidae, Notodontidae, Pterophoridae, and Thaumetopoeidae be validated further before acceptance. The broad fundamental host range of C. vanessae and the difficulties in collecting sufficient specimens of species in certain taxonomic groups means that more study is required to clearly delineate C. vanessae's fundamental host range.
For consideration in future validation studies, we note that investigations of host range typically only use adult parasitoids recently emerged from cocoons (McCutcheon and Harrison, Reference McCutcheon and Harrison1987; Goldson et al., Reference Goldson, McNeill, Phillips and Proffitt1992; Berndt et al., Reference Berndt, Mansfield and Withers2007; Hoddle and Pandey, Reference Hoddle and Pandey2014) or do not indicate parasitoid age. However, host acceptance behaviour by female parasitoids is dynamic; i.e., low-life expectancy females are more likely than high-life expectancy females to accept low-quality hosts (Roitberg et al., Reference Roitberg, Mangel, Lalonde, Roitberg, van Alphen and Vet1992; Roitberg et al., Reference Roitberg, Sircom, Roitberg, van Alphen and Mangel1993; Fletcher et al., Reference Fletcher, Hughes and Harvey1994; Sirot et al., Reference Sirot, Ploye and Bernstein1997). Observations with C. vanessae in this study showed that older adults accepted a broader diversity of caterpillar species than did younger adults. This has direct implications on the way host-range tests are conducted and suggests preferential use of low-life expectancy females.
Host species that supported more rapid parasitoid development tended to produce larger parasitoid broods and heavier individual parasitoids. This phenomenon has been reported by others (Doyon and Boivin, Reference Doyon and Boivin2005; Gao et al., Reference Gao, Tang, Wei, Wang, Yang and Zhang2016) and documents the effect of host species on a range of fitness parameters (Greenblatt and Barbosa, Reference Greenblatt and Barbosa1981). Conversely, host species characterized by prolonged larval development within the host also were associated with prolonged larval–pupal development outside of the host within cocoons. The two exceptions to this latter observation were for the host species A. lignicolora and Cryptocala acadiensis, wherein larval development in the host was prolonged, but larval–pupal development within cocoons was abbreviated, relative to other host species.
Comparison of genetic relatedness allows for tentative predictions regarding which lepidopteran species in North America are likely to be hosts for C. vanessae. Of particular interest from an economic perspective are results for tribe Noctuini and subfamily Plusiinae. Within the tribe Noctuini, we identified the host suitability for species of Abagrotis, Agrotis, and Euxoa as ‘intermediate’ or ‘excellent’ (fig. 1, table 1, Supplementary fig. 1). These genera include many species that are economic pests of crops in North America and elsewhere (Floate, Reference Floate2017). All four species tested in the subfamily Plusiinae were identified as excellent hosts (fig. 1, table 1, Supplementary fig. 1). Our findings suggest that further research is warranted on use of C. vanessae as a potential biocontrol agent against the pest species tested in the current study plus congeneric pest species that we did not test; e.g., pale western cutworm (A. orthogonia), granulate cutworm (Feltia subterranea (Fabricius)), and grey looper (Rachiplusia ou (Guenée)) (Lepidoptera: Noctuidae).
Nonreproductive killing and its implications for host suitability
Our observations of nonreproductive killing – wherein parasitism kills both the host and the parasitoid(s) within – have been reported in a number of studies but the underlying mechanisms are poorly understood (see Abram et al., Reference Abram, Brodeur, Urbaneja and Tena2019 and references therein). Parasitoids can overcome the immune system of a host with variable outcomes, by injecting it with calyx fluid, alone or in combination with venom, polydnaviruses, and teratocytes. Larvae of C. includens injected with small amounts of calyx fluid from Microplitis demolitor Wilkinson (Hymenoptera: Braconidae) will form non-viable larval–pupal intermediates, whereas larvae of H. virescens injected with large amounts of this same fluid are little affected (Strand and Dover, Reference Strand and Dover1991). A combination of venom and calyx fluid injected by Cardiochiles nigriceps (Viereck) (Hymenoptera: Braconidae) inhibits its host's ability to produce ecdysteroid and subsequently to pupate (Tanaka and Vincon, Reference Tanaka and Vincon1991). By injecting a polydnavirus (Bracovirus), parasitoids can inhibit feeding and gut contractions by the host to arrest its development at the prepupal stage (Soller and Lanzrein, Reference Soller and Lanzrein1996; Lanzrein et al., Reference Lanzrein, Pfister-Wilhelm, Kaeslin, Wespi, Roth, Beckage and Drezen2012). Braconid teratocytes in the haemocoel of H. virescens can prolong the host's larval development, followed by either its death, normal pupation, or the formation of a non-viable larval–pupal intermediate (Vinson, Reference Vinson1970; Zhang and Dahlman, Reference Zhang and Dahlman1989). In those studies, the type of response was associated with the number of teratocytes injected, the age of these teratocytes, and the maturity of the host (Zhang and Dahlman, Reference Zhang and Dahlman1989). A higher number of teratocytes, and therefore a higher number of parasitoid larvae, would increase chances of overcoming a host's immune defences. This could explain why adult C. vanessae lay more eggs than can survive.
Fundamental vs. ecological niches
Laboratory studies can identify a parasitoid's fundamental niche (operationally defined here as the set of hosts in which it can survive, develop, and reproduce), but not necessarily its realized ecological niche (the smaller subset of hosts in which it actually does survive, develop, and reproduce, given ecologically realistic species interactions). Two factors that highlight this distinction in the current study are host diapause/overwintering dynamics and the role of the plant species on which the host feeds, both of which may affect whether potential hosts are actually utilized successfully under natural conditions.
Variation in use of host species provides insight into the effect of climate on C. vanessae's ecological niche. Nymphalini appear to be the preferred hosts of C. vanessae in the south and western part of its Palaearctic range (Stefanescu et al., Reference Stefanescu, Askew, Corbera and Shaw2012). However, at northern locations, species of Nymphalini commonly either overwinter as adults or migrate to southern latitudes for the winter (Scott, Reference Scott1979; Dvořák et al., Reference Dvořák, Belicek and Fric2002). C. vanessae appears to have solved this issue by overwintering in northern climes within noctuid caterpillars; e.g., Noctuidae parasitized by C. vanessae have been collected in October (Italy) and May (England) (Nixon, Reference Nixon1974).
In the current study, parasitoids were observed to develop more slowly on overwintering hosts, thus supporting the previous claim that they overwinter within overwintering hosts. Individuals of univoltine lepidopteran species that overwinter as larvae necessarily are at the larval stage during the fall. Such species were subjected to parasitism by C. vanessae in the fall while they were diapausing or soon to do so, although they remained at 20 °C under experimental conditions throughout their entire development. In fig. 2, the species between (and including) A. devastator and C. acadiensis (Bethune) (Lepidoptera: Noctuidae) all overwinter as larvae and are univoltine throughout their range, except for Euxoa tristicula (Morrison), a species that can be multivoltine. However, personal observations and previous studies (Jacobson, Reference Jacobson1969) show that E. tristicula must necessarily go through a diapause at the larval stage, which lasts at least 2 months at 20 °C. Parasitoids took the longest time to develop within these diapausing hosts. This indicates that development within overwintering hosts likely triggered parasitoids to initiate overwintering, but after a short diapause (from a few days, up to 2 months in C. acadiensis; fig. 2) parasitoids eventually resumed their development, likely because of conditions non-optimal for overwintering (including too high temperature, too long light cycle, and too strong light intensity). Regarding the other species in fig. 2, only Abagrotis spp., Agrotis vancouverensis, and A. prasina also overwinter as larvae and are likely to be obligately univoltine throughout their range. The reason why parasitoids did not attempt to diapause within these hosts is unknown.
The plant species on which hosts feed are a crucial aspect of parasitoid–host specificity. While this topic is not our central focus here, we include some additional comments about it in Supplementary Text 1. The current study focuses on host suitability. Therefore, results reflect the fundamental host range of C. vanessae. Future studies should attempt to bridge this gap by studying host range under more natural conditions.
Speculation on the fate of C. vanessae in North America
We expect C. vanessae to become broadly established across North America beyond its current known distribution; i.e., southern regions of Ontario, Manitoba, and Alberta (this study, Hervet et al., Reference Hervet, Murillo, Fernández-Triana, Shaw, Laird and Floate2014). C. vanessae can develop in numerous host species. Into each host, they lay a supernumerary egg load to optimize offspring production for hosts of varying size and possibly also to increase their chances of overcoming the host immune system. The larvae display an antagonistic behaviour that potentially confers inter-specific competitiveness and increase their ability to develop in a broader range of hosts (Hervet et al., Reference Hervet, Laird and Floate2018). Finally, larvae have a facultative diapause that allows for multiple generations until cooler temperatures induce a larval overwintering period.
We do not know the extent to which C. vanessae will suppress pest populations, although recent work identifies it as a potential biocontrol agent of the pests T. ni and C. chalcites (Pacheco et al., Reference Pacheco, Vanlaerhoven, García and Hunt2018; Pacheco et al., Reference Pacheco, Vanlaerhoven and Garcia2021). Future studies will be required to characterize the effects of C. vanessae on populations of both pest and non-pest species of Lepidoptera and to provide greater insight into its expansion and establishment as a new member of the North American parasitoid community.
Supplementary material
The supplementary material for this article can be found at https://doi.org/10.1017/S0007485322000025.
Acknowledgements
For technical support and enthusiasm, we thank Kayla Johnson, Jayden Dyck, Briana Smith, Braidon Schaufert, and Marko Mićović. Bob Byers and Paul Coghlin were instrumental in helping to collect and identify species and provided additional support. We thank Patrick M. Barks for the montage of the video ‘Parasitoid larvae (Cotesia vanessae) emerging from their caterpillar host (Trichoplusia ni)’. This research was supported by the Canola Council of Canada (Canola Agronomic Research Program Project 2012-1, to K.D.F.), Alberta Conservation Association (Grants in Biodiversity, to V.A.D.H.), and the Natural Science and Engineering Research Council of Canada (NSERC Discovery Grant RGPIN-2015-05486 to R.A.L.).
Conflict of interest
The authors declare none.