INTRODUCTION
Maize vegetative development is divided into juvenile and adult phases, based on differences in leaf and stem morphology, anatomy and physiology, such as the presence of epicuticular wax in juvenile leaves (Poethig Reference Poethig1990). Earlier vegetative phase transition is associated with resistance to maize diseases and pests (Abedon & Tracy Reference Abedon and Tracy1996; Williams et al. Reference Williams, David, Buckley, Hedin, Baker and Luthe1998; Revilla et al. Reference Revilla, Malvar, Velasco, Butrón, Tracy, Abedon and Ordás2005a, Reference Revilla, Tracy, Soengas, Ordás, Ordás and Malvarb; Chandler & Tracy Reference Chandler and Tracy2007a; Basso et al. Reference Basso, Hurkman, Riedeman and Tracy2008; Riedeman et al. Reference Riedeman, Chandler and Tracy2008).
The genetics of phase transition was initially studied in maize with mutants (Poethig Reference Poethig1990). Abedon et al. (Reference Abedon, Revilla and Tracy1996) found that general combining ability was larger than specific combining ability for phase-transition-related traits; Abedon & Tracy (Reference Abedon and Tracy1998) observed that these traits were unaffected by inbreeding depression and concluded that the genetic effects were mainly additive. In wild-type maize, Revilla et al. (Reference Revilla, Malvar, Butrón, Tracy, Abedon and Ordás2002) obtained a significant and clear response to divergent selection for early phase transition (EPT) and late phase transition (LPT), suggesting that additive effects were important and few genes were involved. Revilla et al. (Reference Revilla, Malvar, Butrón, Tracy, Abedon and Ordás2004) found that additive genetic variances were more important than dominance variances and the heritability of phase-transition-related traits was high. Chandler & Tracy (Reference Chandler and Tracy2007b) found one simple sequence repeat (SSR) marker, bnlg127, significantly associated with vegetative phase change traits in a maize population, which mapped to the long arm of chromosome 9 near the gene Glossy15.
The inconsistencies among the published results could be due to the weakness of the genetic models used, the inadequacy of experimental designs, or the use of diverse materials, which were not purposely obtained for genetic studies. In a recent review of temperate crops, McMaster (Reference McMaster2005) concluded that further studies are needed in order to understand the mechanisms controlling the phyllochron and phenology. In maize, a conclusive study of the genetics of phase transition is still lacking. In the present work, three cycles of divergent selection were conducted, inbred lines from the respective third cycles of selection were obtained and two generation mean analyses were designed, along with a molecular marker study for investigating the genetic effects and variances, and the genomic regions potentially associated with vegetative phase transition.
MATERIALS AND METHODS
Field trials
Inbred lines were released from the third cycles of a divergent selection programme for EPT and LPT in the maize synthetic EPS5 (Revilla et al. Reference Revilla, Malvar, Butrón, Tracy, Abedon and Ordás2002). Inbred selection followed an ear-to-row selection programme by self-pollinating the plants, over 6 years, with fewer (EPT) or more (LPT) leaves with epicuticular wax from the respective third cycles of selection.
In order to analyse genetic effects, two pairs of inbreds with early (EPT1 and EPT2) and late (LPT1 and LPT2) phase transition were crossed. Crosses were self-pollinated and backcrossed, obtaining six generations per cross: EPTi, LPTi, EPTi×LPTi, (EPTi×LPTi)F2, (EPTi×LPTi)EPTi and (EPTi×LPTi)LPTi. The 12 entries were evaluated in 2007 at Pontevedra (42°24′N, 8′38′W, 20 m asl) and Pontecaldelas (42°23′N, 8°32′W, 300 m asl). Both locations have a humid climate with an annual rainfall of 1600 mm and are located in the northwest of Spain.
Trials followed a factorial design with three replications. Rows had 13 hills, each hill with two kernels that were later reduced to one plant. The distance between rows was 0·8 m and between hills 0·2 m, giving a final plant density of 60 000 plants/ha. Plots consisted of three rows for inbreds and hybrids, and five rows each for F2 and backcross generations.
Traits related to the juvenile phase were last node with adventitious roots and number of leaves with epicuticular wax; traits related to the adult phase were first node with ear shoot, number of nodes with ear shoots and node of the uppermost ear, and other vegetative traits were plant and ear height and days to male and female flowering. Individual and combined analyses of variance across locations were calculated for each trait using SAS Proc MIXED (2000). Generations were considered fixed factors. For the mean generation analyses, each cross was considered a separate experiment. Since the number of plants evaluated for each entry was variable, the number of degrees of freedom (d.f.) used for the F-tests was obtained by the method of Satterthwaite (SAS 2000). The adjustment of the generation means to a genetic model was tested with a χ2 test. The test was applied to the simplest model and, if the χ2 revealed lack of fit, the next model was tried. The models considered were an additive model, an additive-dominant model, an additive-dominant model with epistasis, an additive-dominant model with environmental effects and interactions and, finally, an additive-dominant model with both epistasis and environmental effects and interactions. If the data did not fit any of the first three models, the fourth one was assumed. After choosing the appropriate model, the genetic parameters estimated were m=mid-homozygote value, a=additive effects, d=dominance effects and the non-allelic interactions: aa=additive×additive epistatic effects, ad=additive×dominance effects and dd=dominance×dominance epistatic effects, along with the corresponding interactions with environment (e) (Mather & Jinks Reference Mather and Jinks1982).
The variances were calculated according to four different models, after choosing the model that fitted the data. The adjustment of the variances to a model was tested with a χ2 test. The test was applied to the simplest model and, if the χ2 revealed lack of fit, the next model was tried. The models considered were Model 1: the error variances of the parents and the hybrid were not significantly different, Model 2: the three error variances were different, Model 3: the error variances of the parents were not different but the error variance of the hybrid was different, Model 4: the error variances of the parent with late transition and of the hybrid were not different, but they differed from that of the parent with early transition, Model 5: the error variances of the parent with early transition and of the hybrid were not different, but they differed from that of the parent with late transition. For each model, there were three different sub-models, 1: only the environmental variances were significant, 2: the environmental and the additive variances were significant, and 3: the environmental, the additive and the dominance variances were significant. After choosing a model, up to six variances were estimated: the three error variances of the LPT and EPT parents and the hybrid, and the additive, dominance and additive×dominance epistatic variances, along with the appropriate standard errors.
Molecular markers
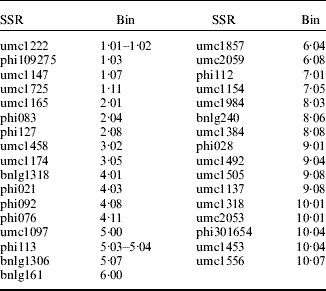
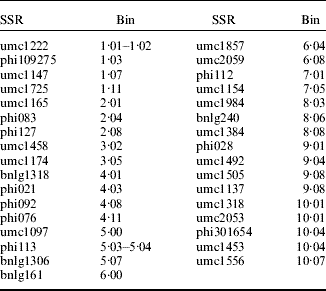
Extractions of DNA were made from 96 plants from each population, EPS5 (the original synthetic), EPS5(EPT)C3 (the third cycle of selection for EPT) and EPS5(LPT)C3 (the third cycle of LPT), as well as from 10 plants for each of the seven inbred lines, following Liu & Whittier (Reference Liu and Whittier1994). SSR amplifications were performed as described by Butrón et al. (Reference Butrón, Tarrio, Revilla, Malvar and Ordás2003). SSR products were separated by electrophoresis using 1× TBE on a 60 mg/g non-denaturing gel of acrylamide (c. 250 V for 3 h). Thirty-three SSR loci were chosen from among those provided in the Maize Genetics and Genomics Database (available online at http://www.maizegdb.org (verified 5 May 2009)). These markers, distributed throughout the genome, were used to determine allelic frequencies in EPS5 and allele differences between the three and the four inbreds with LPT and EPT (Table 1). Fragments for each SSR locus were ordered and numbered according to increasing size. SAS software (SAS 2000) was used to perform the test of Schaffer (Schaffer et al. Reference Schaffer, Yardley and Anderson1977), which checks whether the changes in allelic frequency between the original population and the cycles of selection could be explained solely by random drift. Departures from the model based on random drift were checked using a χ2 with one d.f. for comparisons between each third cycle of selection and the original population. The sum of squares for departures from the model based on random genetic drift involves a linear component the significance of which reveals whether allelic frequency changes are due to directional selection.
Microsatellites (SSR) and chromosome location (bin) used to identify genome regions associated with vegetative phase transition in seven inbred lines derived from a divergent selection programme to delay and advance phase transition in the maize synthetic EPS5
RESULTS
Field trials
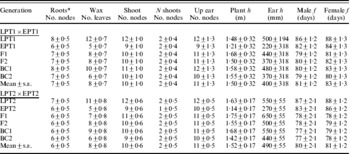
Differences between generations were significant for most traits except number of nodes with ear shoots for both crosses and plant and ear height for the first cross (Table 2). The mean number of leaves with epicuticular wax of the six basic generations was clearly distributed from the late-transition parent (with the largest number of leaves with epicuticular wax) to the early-transition parent (with the lowest value), being intermediate for the other generations, depending on the proportion of each parent. Number of nodes with adventitious roots, node with the first ear shoot and node with the uppermost ear followed similar distributions to that of juvenile wax, although differences among generations were not so apparent (Table 2).
Means (±s.e.) from generation mean analyses derived from LPT1×EPT1 and LPT2×EPT2
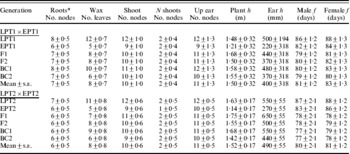
* Roots, last node with adventitious roots; wax, number of leaves with epicuticular wax; shoot, first node with ear shoots; N shoots, number of nodes with ear shoots; up ear, number of nodes of the uppermost ear; plant h, plant height; ear h, ear height; male f, days to male flowering; female f, days to female flowering.
Plant and ear height did not differ significantly among the generations of the first cross and the means of the generations for the second cross were not related to the phase-transition traits. Similarly, the means for male and female flowering were not related to phase transition.
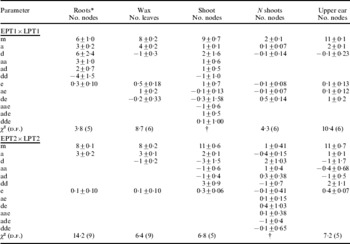
For both crosses, the additive genetic effects were highly significant for all phase-transition traits significantly differing among generations (Table 3). Furthermore, for all traits the estimate values of the additive effect were similar for both crosses: about 3 for last node with adventitious roots and number of leaves with epicuticular wax and 1·5 for first node with ear shoots and for the number of the nodes of the uppermost ear. For three of the phase-transition traits the dominance effects were consistent in both crosses, either significant but smaller than additive effects or not significant, while for the last node with adventitious roots the dominance effect was important in one cross, but not in the other. For number of leaves with epicuticular wax the epistatic effects were not important in either cross, whereas for the other phase-transition traits some epistatic effects were detected in one of the crosses. For EPT1×LPT1, interaction of genetic effects with environments was detected for number of leaves with epicuticular wax and for number of nodes of the uppermost ear, but for EPT2×LPT2, interaction of genetic effects with environments were not detected for any of the phase-transition traits.
Estimates of mid homozygote (m), additive (a), dominance (d), epistasis (aa, ad and dd), environmental (e) and parameter×environment interaction pooled effects±s.e. and χ2 test from generation mean analysis derived from EPT1×LPT1 and EPT2×LPT2

* Roots, last node with adventitious roots; wax, number of leaves with epicuticular wax; shoot, first node with ear shoots; N shoots, number of nodes with ear shoots; up ear, number of nodes of the uppermost ear; plant h, plant height; ear h, ear height; male f, days to male flowering; female f, days to female flowering.
† The χ2 could not be calculated because these data did not fit any model; therefore, d.f. cannot be stated.
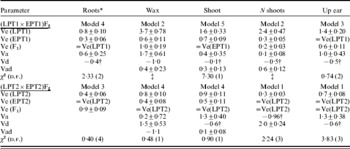
Additive variance was significant for all the phase-transition traits in at least one of the crosses, while the dominance and the epistatic variance were only significant for one trait and only for one of the crosses (Table 4). The components of genetic variance were less consistent for different genotypes than the genetic effects.
Estimates of variance components corresponding to the error (Ve), additive (Va), dominance (Vd) and epistatic (Vad) terms, for (EPT1×LPT1)F2 and (EPT2×LPT2)F2 following the models 1–5 described in materials and methods

* Roots, last node with adventitious roots; wax, number of leaves with epicuticular wax; shoot, first node with ear shoots; N shoots, number of nodes with ear shoots; up ear, number of nodes of the uppermost ear; plant h, plant height; ear h, ear height; male f, days to male flowering; female f, days to female flowering.
† The standard error was not calculated because the variance estimate is negative.
‡ The χ2 cannot be calculated because there are no d.f. left after calculating six parameters.
All the error variance terms were significant and most of them were heterogeneous between both inbreds and between inbreds and hybrids (Table 4). Since hybrids are more stable than inbreds, a lower error variance would be expected for hybrids than for inbreds; however, the inbred with EPT had the lowest error variance more often than the hybrid, and the inbred with LPT had generally the largest error variance.
Molecular markers
The original screening showed clearly distinguishable variability within the maize synthetic EPS5 and among its 16 inbred parents for SSRs. Among the 33 SSRs used to compare the three and the four inbred lines with LPT and EPT, respectively, four SSRs differed for allele composition between LPT and EPT groups: umc1725, phi112, phi028 and umc1453.
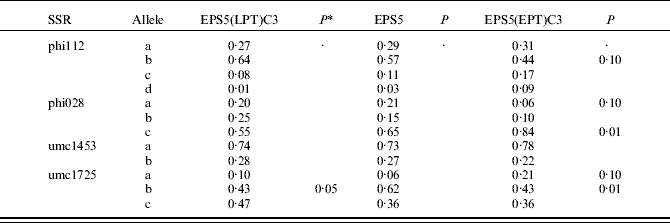
These four SSRs were used for screening the respective third cycles of early EPS5(EPT)C3 and late EPS5(LPT)C3 phase transition. The SSR alleles detected in EPS5 were maintained through selection and none of the alleles disappeared or was fixed (Table 5). Some of the modifications in allele frequencies were consistent, i.e. decreased with EPT and increased with LPT or vice versa; in particular, all the alleles of phi112 varied consistently, whereas none of the alleles of umc1725 did so. Some of the alleles increased or decreased simultaneously in both the directions of selection, particularly the allele umc1725-b.
Allele frequencies in the maize synthetic EPS5 and the third cycles of early [EPS5(EPT)C3] and late [EPS5(LPT)C3] phase transition for the four SSR differing between the three and four inbred lines with LPT and EPT
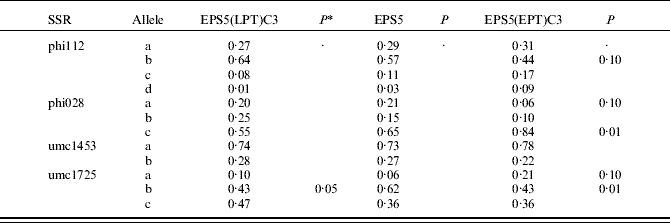
* Significantly different from the changes in allele frequencies expected solely by random drift (Schaffer et al. Reference Schaffer, Yardley and Anderson1977). Blank cells indicate P>0·05.
The significance of allele changes was checked following Schaffer et al. (Reference Schaffer, Yardley and Anderson1977). None of the changes of allele frequencies detected for umc1453 was significant, whereas for umc1725 two of the three alleles suffered significant modifications of frequency (Table 5). Five of the six significant changes of allele frequencies were associated with selection for EPS, whereas only one with LPT.
Frequencies varied consistently with selection for all the alleles of phi112, although only phi112-b varied significantly for EPS5(EPT)C3. For phi028, the frequency of the allele phi028-c significantly (P=0·01) increased with selection for EPS and varied accordingly for LPT. Moreover, the allele phi028-a could be related to selection for EPT (P=0·10), although it did not vary consistently for LPT.
DISCUSSION
Field trials
Most phase-transition traits differed between genotypes and the comparisons of means agreed with expectations based on the values of the parents. However, differences among genotypes for the agronomic traits did not follow a similar distribution. Therefore, no clear relationship was found between phase-transition and agronomic traits. Chandler & Tracy (Reference Chandler and Tracy2007a) also did not find a relationship between phase-transition and some agronomic traits, such as plant and ear height. However, Revilla et al. (Reference Revilla, Malvar, Butrón, Tracy, Abedon and Ordás2004) reported a significant additive correlation between phase transition and plant and ear height and flowering dates in the original synthetic before selection was carried out. Correlations could have changed due to the selection process. Abedon et al. (Reference Abedon, Revilla and Tracy1996) found some significant correlations between last leaf with juvenile wax and other phase-transition traits, but phase transition was not significantly correlated with vegetative or agronomic traits. Abedon et al. (Reference Abedon, Revilla and Tracy1996) reported high positive correlation between ear leaf number and days to male and female flowering and plant and ear height, which were not apparent in the present work. Tojo Soler et al. (Reference Tojo Soler, Sentelhas and Hoogenboom2005) explained that the number of leaves depends on the phyllochron or thermal interval between the appearances of successive leaves, which in turn affects the duration of the vegetative development; therefore, environmental differences between trials could explain most discrepancies between experiments. Abedon et al. (Reference Abedon, Revilla and Tracy1996) calculated simple correlations in six distinct populations and the current report presents a correlated response to selection in a single synthetic. Therefore, the relationships, and hence the correlated responses to selection, strongly depend on the genetic material involved. Inbred lines were used in the present study, whereas varieties were used in the earlier experiments, and Abedon & Tracy (Reference Abedon and Tracy1998) found that phase-transition traits are relatively unaffected by inbreeding and heterosis, while most agronomic traits are significantly affected.
The additive effects were the most important for phase-transition traits and the additive variance was consistently the main component of genetic variance for phase transition. However, some dominance and epistatic effects were also detected and those effects produced for some particular traits and for each cross a significant genetic variance. Accordingly, most maize traits are generally regulated by additive genetic effects, with minor contribution of dominance or epistatic effects; although yield and other traits significantly affected by heterosis show larger dominance effects (Alonso Ferro et al. Reference Alonso Ferro, Malvar, Revilla, Ordás, Castro and Moreno-González2008).
Revilla et al. (Reference Revilla, Malvar, Butrón, Tracy, Abedon and Ordás2004) calculated the genetic variances with the same maize synthetic used for the present study and found that only the additive variance was significant for last leaf with juvenile wax, whereas the dominance and the epistatic variances were not significant, and their magnitudes were lower than the additive variance. The results of Revilla et al. (Reference Revilla, Malvar, Butrón, Tracy, Abedon and Ordás2004) partially agree with the present results based on genetic effects, except that the dominance variances were not significant in the 2004 study and the dominance effects were significant in the present one, along with the dominance variance for the second cross. This disagreement could be explained by the large errors associated with calculations of dominance variances with the North Carolina Design I, and also by the non-significant effects of heterosis and inbreeding on phase-transition traits, compared to the usually high effect on agronomic traits. In addition, the intermediate frequencies produced in the mean generation analysis as a consequence of crossing two inbred lines derived from divergent selection tend to maximize the dominance effects. The present results are in agreement with the previous report by Abedon et al. (Reference Abedon, Revilla and Tracy1996), who found significant general combining ability for leaves with juvenile wax and other phase-transition-related traits, while neither specific combining ability nor interactions with environment were significant. Similarly, Abedon & Tracy (Reference Abedon and Tracy1998) suggested that additive effects were more important than dominance effects on the genetic variability of phase transition. Also, in other crops the duration of vegetative development has been found to be quite predictable across environments and unaffected by genotype×environment interactions (Hurley et al. Reference Hurley, Gilliland and O'Donovan2008).
The present results suggest that the reduction of the juvenile phase increases stability. Interestingly, Revilla et al. (Reference Revilla, Velasco, Malvar, Soengas and Ordás2000) detected a reduction on juvenility in cultivated maize compared with the wild relatives and in the most productive maize race, Corn Belt Dent, compared with its ancestors. Such reduction on juvenility has paralleled an increase in stability during maize breeding, which was a correlated response to the yield increase continuously experienced (Tollenaar & Lee Reference Tollenaar and Lee2002). The importance of variability along the growing cycle for increasing yield stability has been emphasized also for other crops (Browne et al. Reference Browne, White and Burke2006). Therefore, it might be worthwhile to pay attention to vegetative phase transition as a component of stability.
Molecular markers
Three of 33 markers exhibited changes in allele frequency associated with the selection programme. Not all of the significant molecular changes can be attributed to selection for phase transition because some of those changes could be due to selection for performance that unavoidably accompanies any selection programme rather than to phase transition.
Among the four SSRs differing between inbred lines, umc1725, phi112, phi028 and umc1453, the last one did not show significant differences on allele frequencies between EPS5 and EPS5(EPT)C3 or EPS5(LPT)C3. Averaged over the four SSRs, there were three alleles per locus in EPS5, some of them with low frequency, such as umc1725-a (0·06), or with large frequency, as umc1453-a (0·73); and none of them was lost or fixed through selection, meaning that the presumed effect of these genome regions on phase transition was not as important as the effect of other genes previously described (Poethig Reference Poethig1988).
The consistent modifications of allele frequencies are compatible with a linear association with selection for phase transition, at least when deviations from random drift are significant (Schaffer et al. Reference Schaffer, Yardley and Anderson1977). However, some allele frequencies diverged significantly for EPS5(EPT)C3 and not significantly for EPS5(LPT)C3. The allele umc1725-b decreased significantly in both directions of selection, whereas the allele umc1725-a increased, though not significantly, for LPT. This SSR is located in a genomic region that should have some selective value since the frequencies of those alleles were affected by selection.
Differences among populations for leaves with juvenile wax were quite important, with a reduction of 15% for EPS5(EPT)C3 and an increase of 42% for EPS5(LPT)C3, particularly for LPT. In contrast, at the molecular level, the magnitude and proportion of changes of allele frequencies were more important for the early than for the late selection. Therefore, selection to reduce the juvenile phase is more difficult but causes more genetic changes that tend to increase the number of leaves with epicuticular wax.
In conclusion, it appears that a longer juvenile phase involves a reduction in stability. This implies not only greater susceptibility to stresses, pests and diseases, but also a rise of the variance and experimental error, as reported by Revilla et al. (Reference Revilla, Tracy, Soengas, Ordás, Ordás and Malvar2005b). This rationale is consistent with the larger impact of pests on genotypes with shorter juvenile phase observed by Abedon & Tracy (Reference Abedon and Tracy1996, Reference Abedon and Tracy1998) and Revilla et al. (Reference Revilla, Malvar, Velasco, Butrón, Tracy, Abedon and Ordás2005a), as well as with the reduction of juvenile vegetative features observed during the domestication of maize (Revilla et al. Reference Revilla, Velasco, Malvar, Soengas and Ordás2000) and along breeding history.
Some particular genes have significant effects on phase transition; standing out some loci showing major mutants that alter phase transition (Poethig Reference Poethig1988), along with other mutants with primary effects on a diverse phenotypic aspect but with epistatic effects on phase transition, as shrunken2 (Revilla et al. Reference Revilla, Tracy, Soengas, Ordás, Ordás and Malvar2005b). Moreover, other loci, which wild-type alleles have minor effects, as the potential candidate gene associated with the marker reported by Chandler & Tracy (Reference Chandler and Tracy2007b) or those reported here. In all those previous reports, the number of loci explaining variability for phase transitions was very limited, but the loci identified depended on the genotype. This was particularly evident for the isogenic su1/sh2 couples of inbreds (Revilla et al. Reference Revilla, Tracy, Soengas, Ordás, Ordás and Malvar2005b). Therefore, phase transition usually depends on few genes with large additive effects, but the genes involved are not consistent across genotypes.
This research was supported by the Spanish National Plan for Research and Development (AGF2004-06776).