Implications
Breeding sheep for resistance against nematode has been promisingly tackling the issue of anthelmintic resistance and nematode infection. This will also save expenses on deworming drugs and produce chemical residual-free sheep for consumers. Evidence for further possibility for improvement toward parasitic resistance using genetic means is present. Due importance to genotype by environment (G×E) interaction is necessary for accurate selection of the best animals for breeding and avoid re-ranking of sires. Selecting nematode resistant sheep for higher growth can further enhance the economic gains of sheep industry.
Introduction
Infection of Haemonchus contortus is one of the most important health hazards in sheep flock owing to its haematophagous habit in abomasal mucosa. This compromises the production potential of the sheep to a great extent. Haemonchosis is the universal problem and the cost of controlling the infection through anthelmintic treatments has been estimated to be millions of dollars in several parts of the world (Assenza et al., Reference Assenza, Elsen, Legarra, Carré, Sallé, Robert-Granié and Moreno2014). In one of the estimates obtained in the flock under study, an average of 5.06 kg loss in live weight per sheep was reported in extreme cases where eggs per gram (epg) count was more than or equal to 2000 (Singh et al., Reference Singh, Swarnkar, Prince and Pathak2011). It has been repeatedly observed by several researchers that increasing use of anthelmintic results in emergence of anthelmintic resistance (Kaplan and Vidyashankar, Reference Kaplan and Vidyashankar2012; Leathwick and Besier, Reference Leathwick and Besier2014) that also increase cost of prophylaxis. The growing concern for use of chemicals in food triggered the research on alternative strategies or combinations to control helminthiasis in sheep.
Several studies have reported genetic variation for resistance to nematodes both within and between sheep breeds (Prince et al., Reference Prince, Gowane, Swarnkar, Singh and Arora2010b; Karlsson and Greeff, Reference Karlsson and Greeff2012; Assenza et al., Reference Assenza, Elsen, Legarra, Carré, Sallé, Robert-Granié and Moreno2014; Brown and Fogarty, Reference Brown and Fogarty2017; Ngere et al., Reference Ngere, Burke, Morgan, Miller and Notter2018). Thus, the selective breeding of sheep with enhanced resistance to worm infection is possible and provides alternative tool to manage nematode infection in sheep. Genetic selection alters the population’s genetic structure for resistance toward nematode infection for the long term. However, how the selection for low fecal egg count (FEC) alters other economic traits is still a researchable issue.
Malpura is a mutton type sheep breed native to Jaipur, Sawai Madhopur, Tonk districts of Rajasthan, India and known for its adaptability and high growth rate (Gowane et al., Reference Gowane, Chopra, Prakash and Arora2010). Similarly, Avikalin is a crossbred sheep developed by crossing exotic Rambouillet with native Malpura sheep and maintaining 50% exotic inheritance. This breed is primarily a carpet-wool-type breed, also getting popularized for its mutton characteristics (Prince et al., Reference Prince, Gowane, Chopra and Arora2010a). These two breeds are primarily reared at semi-arid region of Rajasthan which is mostly dry. However, Avikalin has also been recently bred at southern regional research station, Mannavanur, Tamil Nadu, with favorable climate for larval load.
The genetic improvement for any trait is subject to the genetic parameters of the trait under selection, which should be precise for unbiased and accurate prediction of the breeding values. The genetic parameter estimates for FEC in Indian sheep breeds are rare. The primary objective of the present study was to obtain the genetic parameters for FEC in Malpura and Avikalin sheep using Animal model. We also aimed at constructing a suitable selection criterion for improving the growth characteristics along with resistance to H. contortus in Avikalin and Malpura sheep maintained at the Institutional farm.
Material and methods
Location of study and breeding program management
The present work was carried out at the ICAR-Central Sheep and Wool Research Institute, Avikanagar, located in the hot semi-arid region of India, 75o28′ E latitude and 26o17′ N longitude at an altitude of 320 m above mean sea level. The soil of this area is sandy, and the vegetation is composed of natural pasture and bush. The climatological parameters for the data set of 13 years revealed wide range of temperature (4°C to 44°C) and average annual rainfall around 536 mm. The relative humidity varied from 40% to 90% across the year.
The sheep flocks were closed type where around 250 to 300 breeding females were maintained over the years. Male to female ratio for breeding was around 1:25. Regarding supplementary feeding, concentrate mixture was offered ad libitum to suckling lambs from 15 days of age until weaning (90 days). After nearly 3 weeks, lambs were sent for grazing in morning and evening. During post-weaning period in addition to 8 to 10 h grazing and dry fodder supplementation, 300 g concentrate mixture was provided. In the grazing area, fodder trees viz. Prosopis cineraria, Ailanthus and Azadirecta indica are available. Improved pasture of Cenchrus ciliaris was cultivated and available along with natural bushes and surface vegetation. Hay of Cenchrus, Cowpea and Dolichos were also supplied along with pala leaves (Zizyphus) and fodder tree lopping during scarce season.
Animals were housed separately according to their age, sex, physiological and health status. Typically, 12 square feet confined space was available for each sheep with double the open corral area. Nearly 70 animals were housed together in a shed with large open corral. Usually rainfall occur during July to August each year and immediately after that the controlled breeding was practiced with the ewes being bred during mid-August to September. Lambs born during spring are given identification number with its details recorded in the database. Weaning is practiced at the age of 3 months. Prophylactic health measures against Enterotoxaemia, Peste des Petits Ruminants and Sheep Pox were practiced in the flock.
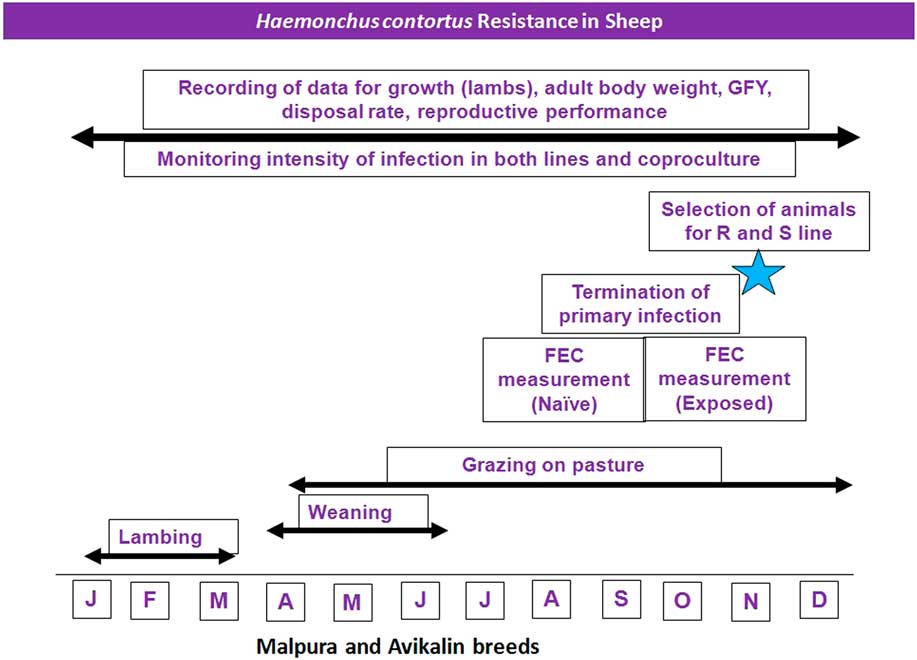
A breeding program was initiated in 2004 to build divergent lines in Avikalin and Malpura sheep for resistance or susceptibility to H. contortus on the basis of phenotypic marker – ‘FEC’ under natural conditions of infection. In short, since July 2004, spring born lambs were regularly monitored for intensity of the H. contortus infection (July to November) every year by using quantitative examination of individual fecal samples. Progeny born were evaluated for FEC at naive and exposed stage of infection and two divergent lines were created by selecting progenies from sires with low mean FEC (R line) and from sires with high mean FEC (S line) in Avikalin as well as Malpura population (Figure 1). The selected sires were again evaluated based on the performance of their progeny as and when the data are available. The consistent performing sires are kept in the breeding scheme. The sire is typically used for 2 to 3 years in the flock for breeding purpose. The generations overlapped. In the breeding program, efforts were made to avoid mating of animals within same sire line. The average inbreeding for Malpura was 2.80% and for Avikalin 1.68%.
Screening and selection strategy for Malpura and Avikalin nematode resistant sheep (Source: Swarnkar et al., Reference Swarnkar, Singh, Kumar, Mishra and Arora2009). GFY = greasy fleece yield; R line = resistant line against nematode infection; S line = susceptible line for nematode infection; FEC = fecal egg count.

Data
Data for this study were collected for 13 years on the animals born between years 2004 and 2016 from experimental breeding flock of Avikalin and Malpura sheep following natural challenge. Fecal egg count data on 1240 Avikalin and 2172 Malpura sheep, aged mostly between 5 and 9 months, descended from 135 sires, and 605 dams in Avikalin and 226 sires and 994 dams in Malpura sheep were used for this study. Characteristics of the data structure used in this study are given in Table 1. Analyses were performed separately for each breed. The favorable period for translation of exogenous stages of H. contortus from June to mid-September in semi-arid Rajasthan was reported on the basis of bioclimatograph (Singh et al., Reference Singh, Swarnkar and Khan2018). Owing to semi-arid region, mostly the pasture availability depends on rainfall during July to August. Before rains, the grazing land is literally devoid of pasture. Significantly (P < 0.001) higher larval burden on pasture was observed during July to September (Singh et al., Reference Singh, Swarnkar and Khan2018). Based on coproculture, the generic composition (FEC) consisted primarily of H. contortus (>95%). The rest of <5% consisted of both the Trichostrongylus spp and Oesophagostomum spp. Due to occasional occurrence and insignificant proportion of strongyle nematodes other than H. contortus, the rest were not excluded from FEC. All the progenies born during spring season (2004–16) were monitored for intensity of nematode infection from July to November through quantitative examination of individual fecal samples using modified Mc Master Technique (Ministry of Agriculture, Fisheries and Food, 1986). During July to August we collected the fecal samples for the FEC examination, which were called as pre-drenching records. Primary infection was terminated in the month of September by drenching animals with Tetramisole or Closantel, and animals were again allowed to graze on contaminated pasture. The subsequent records on the FECs were now called as post-drenching records. The number of post-drench records were 1230 for Avikalin and 2058 for Malpura sheep. Due to differences in the expression of these two FEC measurements (Pre- and Post-), which are mostly due to application of the anthelmintic drug and also ability of animals to respond differently to these drugs, these were considered as two different traits. The FEC was averaged for individual animal over the period of infection. As FEC data were not normally distributed, data were log-transformed to loge (FEC+100) for statistical analysis. All statistical tests were applied to the log transformed fecal egg count (LFEC) data for analysis (Prince et al., Reference Prince, Gowane, Swarnkar, Singh and Arora2010b).
Characteristics of data on fecal egg count of Avikalin and Malpura sheep

FEC (SE) = fecal egg count in terms of eggs per gram along with standard error in parentheses; LFEC = natural log transformed for 100+FEC data; LSM = least squares mean.
Statistical analyses
Due to limited number of candidates post-selection, it was found that in each R and S line, the number available were low (<200), hence analysis was not carried out for R and S separately. The FEC data on Avikalin and Malpura sheep were categorized as pre-drenching and post-drenching observations as detailed above. The data sets were first analyzed by least squares ANOVA using SPSS (IBM Corp, 2017) to identify the fixed effects to be included in the model. The statistical model included fixed effects of sampling year (13 levels), sex of animal (2 levels) and dam age as covariate within each breed. All the animals were in same age group, and samples were taken in same season every year. Year of sampling and sex of animal effects were significant (P⩽0.05) and, hence, were included in the analytical model for genetic analysis. The mixed model analyses were performed with WOMBAT (Meyer, Reference Meyer2007) using an average information algorithm. We could not use the repeatability model owing to small proportion of repeated observations (<25%). Convergence was assumed when change of value of the natural logarithm of the likelihood function in two consecutive iterations was lower than 5×10⁻⁴. Single trait linear model used for analysis was
 $${\bf y}{\equals}{\bf X\rbeta }{\plus}{\bf Z}_{{\bf a}} {\bf a}{\plus}{\bf {\repsilon}}$$
where y is the vector of records; β, a and ε are vectors of fixed (sampling year and sex of animal), direct additive animal genetic effect and residual effects, respectively; with association matrices X and Za,. A is the numerator relationship matrix between animals. The analysis used standard assumptions and definitions. V(a) = Aσ2a and V(I) = Iσ2e; where I is an identity matrix, and σ2a and σ2e are additive direct and residual variances, respectively. Direct heritability was estimated using single-trait analysis. The genetic, residual and phenotypic correlation was estimated using bivariate analysis for the growth traits and LFEC for pre as well as post-drench stage. The growth traits used were live weight at 6 month (6WT) and live weight at 12 months (12WT).
Construction of selection indices
Two production traits viz. 6WT and 12WT were used along with pre-drenching LFEC to construct different selection indices. Selection objective included enhancing the growth performance of the sheep along with resistance to H. contortus. Selection indices were constructed as follows (Falconer and Mackay, Reference Falconer and Mackay1996):
 $${\bf b}{\equals}{\bf P}^{{{\minus}{\bf 1}}} {\bf Ga}$$
where, b is the vector of regression coefficient for respective traits and a the vector of relative economic values for traits under study. P is the phenotypic variance co-variance matrix and G the genetic variance co-variance matrix.
Relative economic values
Economic weights were assigned to the traits on the basis of returns from the sale of per kilogram meat. Average along with SD for 6WT and 12WT from the data for both breeds were 21.77 (2.19) kg and 28.14 (6.15) kg for Malpura and 21.26 (4.51) kg and 28.0 (5.51) kg for Avikalin, respectively. For the sake of simplicity, we assumed 22 and 29 kg as average weight at 6 and 12 months for both the breeds. The price of 1.0 kg meat in the local market is Rs. 350/ kg (nearly 5 US$). Given 50% carcass yield, the revenue generated from sale of animal at 6 months is Rs. 3850/− (55US$) and at 12WT, Rs. 5075/− (72.5US$), giving the index ratio of 1 : 1.3 for 6WT and 12WT. The cost on rearing is kept constant for both the ages due to complication in the computation in existing system. The literature revealed complex computation for the economic value for FEC. However, previous exercise on FEC and losses in yearling sheep were considered, where 5.06 kg/head loss in live weight was estimated in extreme cases where epg is ⩾2000 (Singh et al., Reference Singh, Swarnkar, Prince and Pathak2011). Now incorporating the mutton price in this estimate, the loss per animal with high epg is Rs. 885.5~886/− ( = 5.06×0.5×350), or nearly 12.7US$. This results in 23% loss in actual price for 6WT and 17.5% loss in actual price for 12WT. Rounding the figures for ease of calculation, we fixed the losses as 25% and thus, the economic value fixed for FEC is −0.25 for construction of selection index. Accuracy of selection and expected genetic gain was calculated using standard formulae. The intensity of selection in males was 25% (i = 1.3).
Results
Fecal egg count studies
There was significant difference between the mean of pre-drench and post-drench estimates of FEC in both the breeds. In Avikalin sheep, the mean for FEC was 4071±104.2 and 892±103.9 epg for pre- and post-drench sampling, respectively. Similarly, the estimates in Malpura sheep were 3307±78.1 and 818±80.5 epg, respectively (Table 1). The least squares mean for LFEC were 7.703 and 6.247 in Avikalin sheep for pre- and post-drench estimates, respectively. These estimates were 7.318 and 6.110 in Malpura sheep for pre- and post-drench, respectively. Coefficient of variation (%) was moderate to high (16.67 to 19.47). Year and sex influenced the LFEC significantly (P < 0.01).
Genetic studies
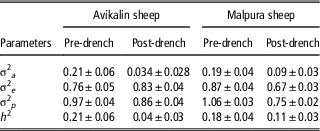
Estimates of variance components and genetic parameters for LFEC for animals as derived by Average Information Restricted Maximum Likelihood (AIREML) are presented in Table 2. Direct additive heritability for LFEC from the animal model varied between pre-drench and post-drench groups between the breeds. For Avikalin sheep the pre-drench h 2 was 0.21±0.06 and post-drench h 2 was 0.04±0.03. However, for Malpura sheep, the pre-drench h 2 was 0.18±0.04 and post-drench h 2 was 0.11±0.03.
Estimates of genetic parameters for fecal egg count in Avikalin and Malpura sheep

σ2a, σ2e and σ2p = additive direct, residual and phenotypic variance, respectively; h 2 = heritability.
The estimates of genetic, residual and phenotypic correlation between the LFEC and growth traits were estimated and presented in Table 3. For Avikalin sheep, it was observed that there was moderate additive genetic variance for 6WT and 12WT with h 2 estimate of 0.12±0.02 and 0.15±0.02, respectively. The estimate of genetic and phenotypic correlation between 6WT and 12WT were high and positive. Genetic correlation of LFEC (Pre-drench) with growth traits were −0.11±0.20 for 6WT and 0.31±0.20 for 12WT. These estimates had high standard error and hence are not reliable. The phenotypic correlation of LFEC was −0.09±0.03 with 6WT and −0.11±0.03 with 12WT.
Estimates for heritability, genetic correlation, residual and phenotypic correlations for LFEC and growth traits obtained from multivariate analysis in Avikalin and Malpura sheep

FEC = fecal egg count in terms of eggs per gram; LFEC = natural log transformed for 100+FEC data; 6WT = live weight at 6-month age; 12WT = live weight at 12-month age.
For the Malpura sheep, h 2 estimate for 6WT and 12WT were 0.16±0.03 and 0.19±0.03, respectively. The genetic and phenotypic correlation of 6WT with 12WT was 0.95±0.03 and 0.71±0.01, respectively. The estimate of genetic correlation of LFEC (pre-drench) with 6WT and 12WT were 0.35±0.16 and 0.26±0.15, respectively, which are positive and hence not desired. The estimate of phenotypic correlation for LFEC with 6WT and 12WT were −0.04±0.03 and −0.03±0.03, respectively.
Genotype by environment interaction for nematode resistance across time
The genetic correlation between pre- and post-drench LFEC for Avikalin sheep was 0.99±0.29, indicating maintenances of the ranks based on breeding values for the animals over two different environments such as high worm count (pre-drench) and low worm count (post-drench). However, for the Malpura sheep, the genetic correlation of LFEC for pre-drench and post-drench estimates was 0.65±0.15, indicating presence of significant G×E interaction.
Genetic progress in the breeding scheme
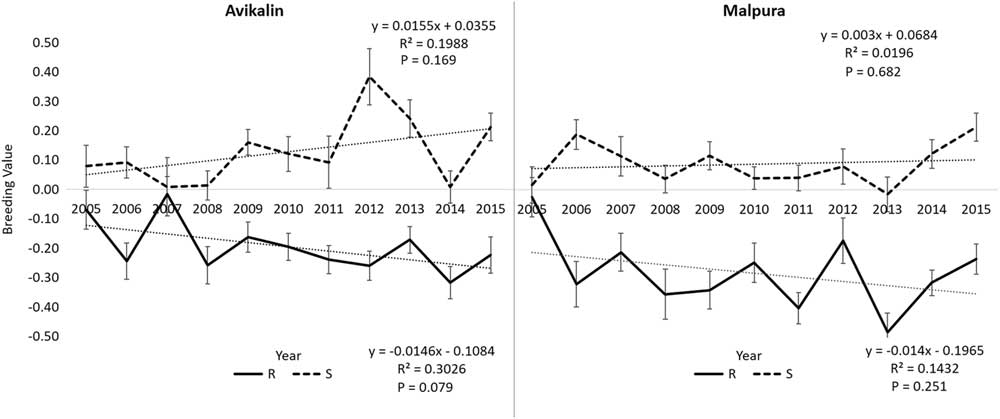
The breeding values of the selected candidates for resistance as well as susceptibility to H. contortus has been plotted for each year since 2005 (Figure 2). Breeding values were obtained for the transformed FEC as described in methods. Results revealed divergence in the estimates of breeding values for R and S lines in Malpura as well as Avikalin population over the years. The trend over the years for R line of Malpura and Avikalin was negative and desirable. Similarly, the trend over the years for S line of Malpura and Avikalin was positive and desirable.
Genetic trend for fecal egg count in R and S lines of Malpura and Avikalin sheep. R line = resistant line against nematode infection; S line = susceptible line for nematode infection.

Development of the selection indices
In spite of the unreliable genetic correlation of LFEC with growth traits, the selection indices were constructed for the selection of sheep based on combination of LFEC (pre-drench) with growth traits (Table 4). Three indices were constructed for both the breeds. In Avikalin sheep, Index 3 [I = 0.23 (LFEC)+0.151 (12WT)] resulted in relatively better accuracy with expected genetic gain of 0.834 kg after one generation of selection in 12WT and 0.168 LFEC increment. The expected genetic gain in FEC after one generation of selection would be nearly −98.8 epg as the Δg contains natural log of epg+100, which needs to be back transformed or rescaled to anti-log transformation of LFEC and thus derives to be nearly −98.8 eggs (1.189 to 100). Moreover, the expected genetic gain in live weight seems generous. Index 2 [I = −0.08 (LFEC)+0.116 (6WT)] gave less accurate but more attractive estimates. This index will result in 0.552 kg increment in 6WT after one generation of selection and reduction in LFEC by −0.070 or reduction in epg by −101.07 eggs (−1.0725 to 100) per generation of selection.
The b values, accuracy of the index and expected genetic gain1 after one generation of selection for Avikalin and Malpura sheep

FEC = fecal egg count in terms of eggs per gram; LFEC = natural log transformed for 100+FEC data; 6WT = live weight at 6-month age; 12WT = live weight at 12-month age.
b 1, b 2, b 3 are regression coefficients and Δg 1, Δg 2, Δg 3 are estimates of expected genetic gains for traits 1, 2 and trait 3, respectively, using the index.
Intensity of selection was assumed to be 1.3, indicating selection of 25% top animals.
1 Genetic gain in ‘kilogram’ for all the traits except LFEC, where it is in natural log of eggs per gram of feces.
In Malpura sheep, highest accuracy was obtained for index 1 [I = 0.139 (LFEC)+0.882 (6WT)+1.065 (12WT)]. This index had accuracy of 0.492 and expected to give the genetic gain of 0.882 and 1.065 kg in 6WT and 12WT, respectively, after one generation of selection along with reduction of 98.85 eggs in epg (1.1491 to 100) after one generation of selection.
Discussion
The data on FEC revealed sizable variation between and within groups in both the breeds. The significant influence of the year on FEC may be attributed to differences in environmental conditions such as temperature, humidity, rainfall, etc. over the years. Similar to our study, Aguerre et al. (Reference Aguerre, Jacquiet, Brodier, Bournazel, Grisez, Prévot, Michot, Fidelle, Astruc and Moreno2018) reported significant influence of Year × Season effect on FEC. Sex of the animal also affected the LFEC significantly, where males were more prone to infection than females. Similar observation related to sex differences, where males had significantly higher FEC as compared to females was reported by Stear et al. (Reference Stear, Bairden, Duncan, Gettinby, McKellar, Murray and Wallace1995) and Abuargob et al. (Reference Abuargob, Stear, Mitchell and Benothman2015) in Scottish black face lambs, Traoré et al. (Reference Traoré, Notter, Soudre, Kaboré, Álvarez, Fernández, Sanou, Shamshuddin, Periasamy, Tamboura and Goyache2017) in Djallonké sheep. The difference may be attributed to the variable growth rate and probable influence of endocrine hormones on the immune system. In case of male lambs, the higher requirement for greater lean tissue growth and thus associated protein requirements during active growth stage may have compromising effect on immune system in relation to females (Houdjik et al., 2001).
Genetic studies
The moderate estimate of h 2 in pre-drench group of both the breeds revealed scope for further selection of sheep for resistance toward H. contortus infection. The genetic improvement program for resistance to H. contortus infection for these two sheep breeds is in progress since year 2004. The existence of genetic variability is therefore a good sign toward achieving the objectives of the breeding program. Following anthelmintic drench, the worm load drastically reduced by 1/4th to 1/5th of pre-drench status, thus reducing the overall variability in the trait. This also declined the genetic variability to the minimum level. However, still 11% genetic variability for LFEC in post-drench Malpura sheep was appreciable. Sometimes it is difficult to know why there is variation at genetic level between the pre-drench and post-drench estimates. However, it is always better to select the candidates on the basis of data where the estimates for additive genetic variance are on higher side. Hence the pre-drench estimates will be the primary criteria for selection in Malpura sheep and post-drench estimates will be used as secondary information. At present the Avikalin flock has sizable additive variance with precise estimate of h 2 (0.21±0.06) and hence can be directed selectively for developing the resistant lines successfully. Similarly, h 2 of 0.18±0.04 at pre-drench stage in Malpura sheep is robust and suggestive of future selection experiments for nematode resistance. The genetic trend in Malpura and Avikalin R and S lines for FEC was in right direction owing to the sizable additive genetic variance and proper selection.
Several reports revealed sizable additive genetic variance for the FEC. Earlier study in Avikalin sheep revealed h 2 of 0.149±0.096 (Prince et al., Reference Prince, Gowane, Swarnkar, Singh and Arora2010b), however, the estimates were based on small data size (year 2004–07). Similar to the present estimate, the little moderate value was reported for Scottish Blackface ewes with h 2 estimates of 0.25±0.04 (Bishop and Stear, Reference Bishop and Stear2001). Gauly et al. (Reference Gauly, Kraus, Vervelde, Van Leeuwen and Erhardt2002) a wide range of h 2 (0 to 0.35) for Rhon and German Merino lambs. Vanimisetti et al. (Reference Vanimisetti, Andrew, Zajac and Notter2004) reported 0.10 and 0.19 h2 in lambs of 50% Dorset, 25% Rambouillet and 25% Finnsheep ancestry and 0.31 h 2 in ewes of same sheep. Beraldi et al. (Reference Beraldi, McRae, Gratten, Pilkington, Slate, Visscher and Pemberton2007) reported estimates of >0.10 to 0.26 in Soay sheep. Goldberg et al. (2012) reported h 2 for lamb FEC to be 0.25±0.03 and for ewe FEC 0.08±0.03 in Uruguayan Merino sheep. Estimate of 0.21±0.06 was reported for h 2 of FEC during first infestation by Assenza et al. (Reference Assenza, Elsen, Legarra, Carré, Sallé, Robert-Granié and Moreno2014) for sheep using pedigree model, however, for the same trait the h 2 reported was higher (0.38±0.04) using single nucleotide polymorphism model, indicating improved estimate by using genomic information. Estimates of 0.20 to 0.30 were reported by Brown and Fogarty (Reference Brown and Fogarty2017) in Australian Merino sheep flock. In accordance with our study, estimate of h 2 for FEC in the naturally infected ewes was reported by Cloete et al. (Reference Cloete, Olivier, du Toit and Dreyer2017) in South African Merino sheep (0.18±0.03) and by Aguerre et al. (Reference Aguerre, Jacquiet, Brodier, Bournazel, Grisez, Prévot, Michot, Fidelle, Astruc and Moreno2018) in Manech sheep (0.18±0.04). Moderate h 2 (0.18 to 0.26 for pre-weaning FEC and 0.23 to 0.46 for post-weaning FEC) in Katahdin lambs were also reported by Ngere et al. (Reference Ngere, Burke, Morgan, Miller and Notter2018). Notter et al. (Reference Notter, Ngere, Burke, Miller and Morgan2018) reported moderate estimate at peri-parturient rise FEC of the ewe at lambing (h 2 = 0.35±0.06) and 30 days postpartum (h 2 = 0.24±0.07). The h 2 for worm egg count was reported to be 0.20±0.03 by Hollema et al. (Reference Hollema, Bijma and van der Werf2018). However, they reported different h 2 estimates in the low worm environment (0.19±0.03) and h 2 in high worm environment was 0.37±0.03. This was similar to our study where estimates of h 2 for pre-drench (high worm) environment were always higher than the post-drench (low worm) environment. The drenching reduces the worm load and most of the animals report 0 FEC or minimum FEC. This therefore reduces the variance at phenotypic and genetic level. In our study (Table 1), we can see >75% decline in the average estimate of FEC post drenching. Variable heritability estimate (0.04 to 0.27) for FEC over the first challenge period was reported by Lobo et al. (Reference Lobo, Vieira, de Oliveira, Muniz and da Siva2009) in Santa ‘Ines lambs. This was due to the fact that the animals underwent pasture contamination during the challenge resulting in the increase in heritability.
Our study revealed non-significant genetic correlations between growth and FEC. The estimates agreed with several studies where the genetic correlations between FEC and live weights were not significantly different from zero or little low to moderate or with high standard error (Pollott and Greeff, Reference Pollott and Greeff2004; Safari et al., Reference Safari, Fogarty and Gilmour2005; Lobo et al., Reference Lobo, Vieira, de Oliveira, Muniz and da Siva2009; Brown and Swan, Reference Brown and Swan2016; Brown and Fogarty, Reference Brown and Fogarty2017; Notter et al., Reference Notter, Ngere, Burke, Miller and Morgan2018). Desirable genetic correlations (negative) have been reported (−0.23) by Ciappesoni et al. (Reference Ciappesoni, Goldberg and Gimeno2013). Cloete et al. (Reference Cloete, Olivier, du Toit and Dreyer2017) reported estimate with high SE −0.119±0.098 for genetic correlation of FEC with live weight at two-tooth stage. Similarly, in a study by Hollema et al. (Reference Hollema, Bijma and van der Werf2018), the genetic correlation of −0.14±0.11 was reported between growth rate and worm egg count. The genetic correlation obtained therefore is not consistent across several reports. This is indicative of the yet non-existing strong evidence for the genetic relationship between the growth and the FEC. In the present study, estimate of genetic correlation for both the breeds were not encouraging for LFEC with growth traits. Thus, predicting response in growth, if selection for FEC is carried out, cannot be accurate. The estimate of negative phenotypic correlation between LFEC and 6WT or 12WT in the present study was in accordance with the several reports (Vanimisetti et al., Reference Vanimisetti, Andrew, Zajac and Notter2004; Cloete et al., Reference Cloete, Olivier, du Toit and Dreyer2017; Traoré et al., Reference Traoré, Notter, Soudre, Kaboré, Álvarez, Fernández, Sanou, Shamshuddin, Periasamy, Tamboura and Goyache2017). Higher worm load is indicative of higher stress on lambs resulting in poor growth and hence managemental interventions to reduce the worm load are essential for better growth in lambs.
Genotype by environment interaction
In the Avikalin sheep, the G×E was absent for pre-drench and post-drench trait, thus selection for pre-drench LFEC will also result in similar performance for post-drench LFEC in Avikalin sheep. However, presence of G×E for pre-drench and post-drench LFEC in Malpura sheep expresses LFEC as two different traits in time. This influences the ranking of the individuals with respect to their breeding values. The candidates with higher ranks for pre-drench LFEC do not retain their ranks for breeding values for post-drench LFEC. The evidence for G×E interaction for nematode resistance was also reported by Pollott and Greeff (Reference Pollott and Greeff2004) and Li et al. (Reference Li, Swan, Brown and Van der Werf2015), where change in the breeding values of rams was evident in different environments. The rank differences were low to high, indicating substantial existence of G×E effects. Hollema et al. (Reference Hollema, Bijma and van der Werf2018) reported the genetic correlation between worm egg count in the low and the high worm environment as 0.30±0.16, indicating presence of G×E and hence significant re‐ranking of sires between both environments. In the present study, genetic correlation of 0.65±0.15 indicates high G×E, as the estimate is much lower than 0.80, below which the genetic correlation is considered to have moderate-to-severe G×E interaction (Mulder and Bijma, Reference Mulder and Bijma2005). Our study indicates that the top sires in the pre-drench environment are not necessarily the top sire in the post-drench. Thus, to reduce the G×E impact on the individuals, the information on performance of FEC in pre-drench and post-drench environments will be taken into consideration for Malpura sheep. This observation also reveals another important inference that given the existence of G×E, the breeding values will be highly sensitive to environment and hence efficient selection decisions must take G×E in to consideration.
Proposed selection strategy
The indices derived were based on the genetic covariance and phenotypic covariance between the traits. However, it was observed (Table 3), that the genetic correlation for Avikalin sheep was favorable only for LFEC and 6WT, however, SE of prediction was very high (−0.11±0.20), resulting in un-reliable estimate. For LFEC-12WT the genetic correlation was positive (not desirable) and with high SE (0.31±0.20). Similarly, for Malpura sheep, the genetic correlation of LFEC with 6WT as well as 12WT was positive and also with high SE (0.35±0.16 and 0.26±0.15), which is not desirable. In our study, the unreliable genetic relationships between the traits discouraged the use of developed selection indices for selection program as the expected gains will not be realistic.
Looking into the genetic structure of the traits under consideration, following selection strategy is being proposed for the Avikalin and Malpura sheep for strengthening the resistance against H. contortus and achieving higher growth rate. The analysis on the data generated over 12 years (2004–15) for Malpura and Avikalin resistant lines developed for resistance against H. contortus revealed the estimates of FEC for cut-off. The data on repeated measures of 176 animals (5010 records) in Malpura sheep had mean FEC (SE) of 667.72 (17.3) epg for resistant line. Similarly, for Avikalin sheep, 204 animals having 5628 repeated records had average mean (SE) of 534.91 (11.53) epg for resistant line. Therefore, a stringent threshold of maximum 650 epg in Malpura and 550 epg in Avikalin will be set for selection of the candidates. Following multistep approach will be used for selection of the candidates for growth as well as resistance to nematodes.
1. Selection will be breed specific.
2. All naive lambs will be screened for FEC regularly.
3. Selection for FEC.
a. Avikalin lambs will be selected and ranked based on corrected pre-drench FEC.
b. Malpura lambs will be selected based on their corrected pre-drench FEC.
c. The Malpura lambs that are preliminarily selected based on pre-drench FEC will be ranked on the basis of estimated breeding value (EBV) obtained after combination of corrected pre-drench FEC as well as post-drench FEC.
EBV for Malpura = pre-drench FEC+(0.65) post-drench FEC.
4. Selection for growth: after the preliminary selection based on FEC in both the breeds, candidates will be selected for corrected 6WT.
Conclusion
Selection for the nematode resistance has become need of the hour. The moderate additive genetic variance for pre-drench environment poses favorable response in future selection experiments. Along with the resistance for nematodes, the growth performance of these lines can further be improved, given the proper selection strategy. The presence of G×E in Malpura sheep for FEC warrants the need to account for re-ranking of sires for pre-drench and post-drench environments. As we could not show significant association of FEC with growth, the two-stage selection addressing nematode resistance and growth needs to be adopted to achieve higher growth along with nematode resistance in sheep flock being studied.
Acknowledgments
The authors are grateful to the Director, ICAR-Central sheep and Wool Research Institute (Avikanagar) for providing facilities to carry out this study. The insightful comments by Dr Raphael Mrode, ILRI Kenya for analysis of data are duly acknowledged by authors. The authors also acknowledge all the previous contributors in this project for their efforts to develop the flock and record data. The critical review by anonymous reviewers that helped improve the paper, is highly acknowledged.
Declaration of interest
The authors do not have any conflicts of interest.
Ethics statement
Prior approval of the Institute Animal Ethics Committee was already sought.
Software and data repository resources
All the data used for the analysis is available with the data repository of Animal Genetics & Breeding Division, ICAR-Central Sheep & Wool Research Institute, Avikanagar. Access rights to the data are available with the Director ICAR-CSWRI Avikanagar.