Introduction
There is a significant debate in progress within academic social policy as to the evolving differences in meaning between ‘welfare’ and ‘wellbeing’, and the sense in which ‘happiness’ is a sufficient measure of either (e.g. Dean, Reference Dean2010; Daly, Reference Daly2011; Dolan and Metcalfe, Reference Dolan and Metcalfe2012). The terms ‘welfare’ and ‘wellbeing’ are often considered together, especially ‘wellbeing’ and ‘state welfare’. The aggregate level of wellbeing is believed to be higher within social democratic welfare states (Scandinavian countries), and its distribution more equitable (e.g. Castles et al., Reference Castles, Leibfried, Lewis, Obinger and Pierson2010; Wilkinson and Pickett, Reference Wilkinson and Pickett2010; Kvist et al., Reference Kvist, Fritzell, Hvinden and Kangas2011). This theory is put to the test in this article. Here we focus on one main research question: to what extent does welfare state regime classification explain variations in wellbeing, when individual- and country-level characteristics are controlled for?
The wellbeing of citizens is measured in terms of the degree to which they lead happy lives. Self-reported happiness data are taken from the World Values Survey (WVS). There may be limits on the reliability of responses to standard happiness questions at the individual level, with responses varying according to mood or the context of the survey. Nevertheless, we may expect such idiosyncrasies to average out in representative population samples as Kahneman and Krueger (Reference Kahneman and Krueger2006) observe. Before describing the study methods and results and discussing their implications, we consider the worlds of welfare theory and discuss what advancing a contribution on ‘happiness’ might add to social policy debate.
Different worlds of welfare capitalism
Arguments about the size and role of the state have long been a source of political tension, at least in party political terms, in many market democracies such as the United Kingdom (UK), as societies grapple to find the acceptable balance between ‘excessive’ and ‘insufficient’ government involvement in people's everyday lives (e.g. Norman, Reference Norman2010; Glasman et al., Reference Glasman, Rutherford, Stears and White2011). Although an over-simplification, too much state intervention may impose on individual freedoms, undermine people's resilience and self-reliance − all of which might have a negative effect on population wellbeing (Welzel and Inglehart, Reference Welzel and Inglehart2010). People may resent having to pay higher taxes for more expansive social provision, and higher tax ‘burdens’ may mean there is less individual freedom to choose. This is the classic argument usually advanced by those on the centre-right of the political spectrum, who tend to argue for smaller governments. On the other hand, people may feel dissatisfied if everyday life risks become understood as issues of personal failure and responsibility rather than social problems to be addressed through collective action (Taylor-Gooby, Reference Taylor-Gooby2011a). The universal welfare statist position has historically been associated with the left. Our study is particularly timely in the present era of welfare retrenchment (Taylor-Gooby and Stoker, Reference Taylor-Gooby and Stoker2011), and the challenge facing social policy in trying to square the circle of maintaining established welfare state collectivism despite increasing liberal individualism (Knight, Reference Knight2011; Yeates et al., Reference Yeates, Haux, Jawad and Kilkey2011).
The core business of a welfare system, broadly conceived at the country level, must be the production of population ‘wellbeing’ (Dean, Reference Dean2012).Footnote 1 Welfare state policies and architectural arrangements for education, health and the social services may help to promote population wellbeing for all citizens, including vulnerable groups; for example, the unemployed, the sick, people with a disability and pensioners who have retired from employment. However, it does not automatically follow that a commitment to welfare necessarily means more wellbeing. High levels of social expenditure may expose a nation's inability to deal effectively with high levels of unemployment (unemployment is a factor which we control for in our statistical modelling as we explain below).
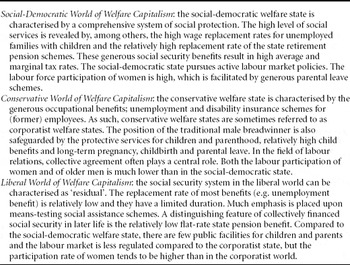
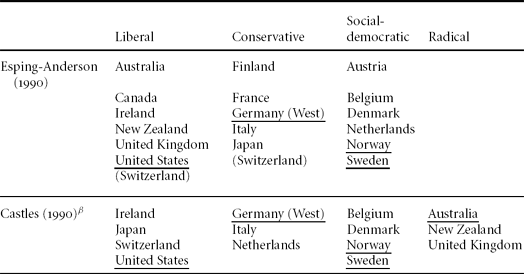
Attempts to analyse and categorise the ‘welfare state’ can be traced to Titmuss (Reference Titmuss1958). The landmark work in this field by Esping-Andersen (Reference Esping-Andersen1990) presents a typology of welfare regimes: the Social-Democratic, Conservative and Liberal Worlds of Welfare Capitalism that reflect the dominant political movements and forms of political economy identified during the last century (described in Table 1). In this literature, the Conservative World is sometimes referred to as corporatist or christian-democratic. These are ‘ideal types’: heuristic devices against which no real World of Welfare Capitalism or country as the unit of analysis actually conforms to (Powell and Barrientos, Reference Powell and Barrientos2011). Nevertheless, some OECD countries come much closer than others and can be considered prototypical. These countries are shown underlined in Table 2; Sweden and Norway best exemplified the Social-Democratic World of Welfare Capitalism based on Esping-Anderson's decommodification (i.e. generosity of social security) and social stratification indices.Footnote 2 Germany was prototypically conservative and the US was the exemplar of the Liberal Anglo-Saxon World of Welfare Capitalism.
Ideal worlds of welfare capitalism

Real worlds of welfare capitalismα

Notes: αPrototypical welfare regimes are shown underlined.
βFour countries of Austria, Canada, Finland and France did not fit within Castles’ classification.
Francis Castles provided one of the earliest challenges, at least in part, to Esping-Andersen's welfare typology (Castles, Reference Castles1993). Attention turns here to Esping-Andersen's ‘liberal’ category and the critique put forward by Castles. Somewhat counter-intuitively perhaps, Castles identified a ‘radical’ category comprising Australia, New Zealand and the UK. These countries were social policy innovators and belonged to a Fourth World of Welfare Capitalism in the revision offered by Frances Castles (see Table 2). Australia, for example, had regulated the labour market at the turn of the twentieth century; a minimum wage had been introduced as far back as 1907, while a major programme of social security was established in New Zealand in 1938, and a comprehensive welfare state emerged in Britain in the aftermath of the Second World War. Such worldly distinctions − shown in Table 2 − are important in social policy and we explore these further in our empirical strategy. Interestingly, Castles tended to agree with Esping-Anderson on the prototypical worlds of welfare capitalism (again these countries are shown underlined in Castles’ ‘families of nations’ classification, Table 2).
There are few studies that have attempted to explore the complex relationship between wellbeing and political intervention in the market economies of the advanced democracies. An early attempt by Veenhoven (Reference Veenhoven2000), using correlation techniques, found little evidence to suggest a link between the size of the welfare state, as measured by social security expenditures, and the level of wellbeing within it. State expenditure on welfare, however, is a poor proxy variable for ‘welfare effort’ and ‘state intervention’, which is why we avoid it. Equal levels of social expenditure may mask critical differences in the institutional makeup of welfare systems, which is partly why we turn to the worlds of welfare framework for our classification of state welfare. A more recent study however, observed a more positive relationship between increased state intervention in the market and wellbeing (Flavin et al., Reference Flavin, Pacek and Radcliff2011). Here government intervention in the economy was assessed by tax revenues, social welfare expenditures, government consumption and benefit replacement rates. Wellbeing was measured using self-reported ‘life satisfaction’ in the WVS, and ordinary least squares (OLS) regression was used to examine the associations between population wellbeing and the size of the state. Again this study is somewhat limited by the heavy reliance on welfare expenditure as a marker for welfare effort and state intervention.
The worlds of welfare framework has been applied to many areas of social policy but not in any rigorous fashion to wellbeing and happiness. It has been used to help explain how the welfare of individuals in three types of welfare state has fared over time, drawing on socio-demographic panel data from Germany, the Netherlands and the US (Goodin et al., Reference Goodin, Headey, Muffels and Dirven1999), as well as variations in health (e.g. Bambra, Reference Bambra2007a; Eikemo et al., Reference Eikemo, Bambra, Judge and Ringdal2008; Bambra et al., Reference Bambra, Netuveli and Eikemo2010) and the social services (e.g. Alber, Reference Alber1995; Anttonen and Sipilä, Reference Anttonen and Sipilä1996; Engster and Stensöta, Reference Engster and Stensöta2011). A number of studies have also focused on the relationship between welfare regime and public attitudes to social welfare and redistribution (e.g. Andreß and Heien, Reference Andreß and Heien2001; Svallfors, Reference Svallfors2011; Taylor-Gooby, Reference Taylor-Gooby2011b). The relevance of the worlds of welfare typology has been called into question at times (e.g. Bambra, Reference Bambra2006, Reference Bambra2007b). However, a recent review helps to strengthen the validity of this framework for understanding the form of welfare states (Ferragina and Seeleib-Kaiser, Reference Ferragina and Seeleib-Kaiser2011). The worlds of welfare thesis has transformed social policy research. It may come as little surprise therefore, to find the names of Gøsta Esping-Andersen and Francis Castles appearing as the most-cited and influential in the field of comparative social policy research (Powell, Reference Powell, Castles, Leibfried, Lewis, Obinger and Pierson2011), and with this in mind we develop Esping-Andersen's model of welfare and the revision proposed by Francis Castles, in relation to the concept of wellbeing considered here.
Methods
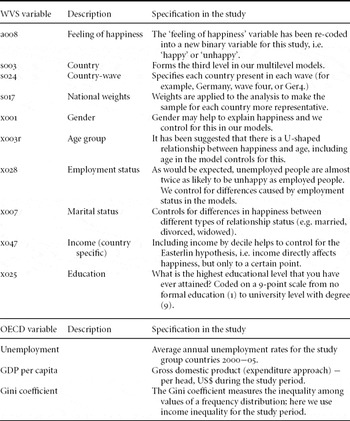
In our analysis, we use data on self-reported happiness taken from the World Values Survey (WVS – described in the Appendix below). The WVS is a cross-national survey that uses a repeated (though not panel) cross-sectional research design. This means that it has enormous potential for cross-national study and for measuring aggregate trends in close to ninety countries and societies. Here we use the latest data from the WVS covering the 2000–05 period, and drawn from two waves: four and five (WVS, 2009). Following Esping-Andersen and Castles, we focus on levels of happiness within the different worlds of welfare capitalism. We acknowledge that attitudinal variations at the aggregate level must result from variations at the individual level. The worlds of welfare capitalism are composed of the eighteen OECD countries shown in Table 2. Just under 30,000 respondents from our selected OECD countries responded to the self-reported happiness question in the WVS, and they form the core sample. Our analysis is weighted using the national weights available in the WVS (Table 3). This ensures that the data for each country are representative, and reduces sampling bias and skewing of the data.
Variables in the model

Notes:
WVS: individual level variables taken from the World Values Survey.
OECD: country level variable taken from online OECD statistical databases http://stats.oecd.org/Index.aspx.
In the WVS, respondents are asked: ‘taking all things into consideration, would you say you are’: ‘very happy’, ‘quite happy’, ‘not very happy’, ‘not at all happy’. In the WVS datasets, this question is a008, the ‘feelings of happiness’ variable (see Table 3). For our analysis, we have created a new binary variable: ‘very happy’ and ‘quite happy’ are recoded as (0) ‘happy’, while ‘not very happy’ and ‘not at all happy’ are recoded as (1) ‘unhappy’. We model the chances of reporting unhappiness; those who report being ‘happy’ (being the majority) form the base. Respondents who did not answer the ‘feelings of happiness’ question are not included in this study.
The hierarchical nature of the WVS data (individuals, over time, in countries) is particularly suited to a multilevel modelling approach, and this is the strategy we adopt here using MLwiN (a software package for fitting multilevel models – see Rasbash et al., Reference Rasbash, Browne, Goldstein, Yang, Plewis, Healy, Woodhouse, Draper, Langford and Lewis2000). Multilevel models are increasingly used within the social sciences because they allow the possibility of modelling outcomes as a function of explanatory variables at different hierarchical levels. Researchers have turned to multilevel analysis to examine the impact of welfare state regimes on population outcomes, such as self-perceived health (e.g. Eikemo et al., Reference Eikemo, Bambra, Judge and Ringdal2008), and here we extend this analysis to wellbeing. In our model, the hierarchy is individuals, nested within ‘country-waves’, nested within countries.Footnote 3 By controlling for individual- and country-level predictor variables in our multilevel binomial logit model, we hope to identify and quantify the influence of each welfare state classification on levels of wellbeing. Logistic regression is a statistical technique that belongs to the theoretical framework of the general linear models (GLM). It is ideally suited to situations where a response variable, such as ‘feelings of happiness’, has been categorised as a dichotomy (Hosmer and Lemeshow, Reference Hosmer and Lemeshow2000).
Multilevel models have parameters that can vary at more than one level, and we can quantify effects at levels higher than the individual (for example over time, and between countries). They differ from regression models in that the unexplained variation is not treated as a ‘nuisance’, but is explicitly modelled. It is also possible to estimate not just the impact of individual explanatory variables on happiness, but also higher-level (or ‘country-level’) variables (for example, GDP per capita). The amount of variation in self-reported happiness that can be attributed to higher-level explanatory variables can be separated from the individual-level explanatory variables, so it is possible to quantify the impact that different worlds of welfare have on self-reported wellbeing, after controlling for individual characteristics. The multilevel approach adds significant value to the analysis as it allows us to model variation in self-reported happiness both between individuals and between countries.
We developed our model following logical sequential steps: the baseline (null) model established the probability of an individual over all country-waves and in all countries reporting unhappiness without any controls. Next we add individual-level characteristics and higher country-level characteristics (Table 3). The research literature suggests that a range of socio-demographic characteristics (e.g. age, gender, income, relationship status and employment status) are likely to be important explanatory variables (e.g. Stack and Eshleman, Reference Stack and Eshleman1998; Layard, Reference Layard2005; Clark, Reference Clark2006; Blanchflower and Oswald, Reference Blanchflower and Oswald2008; Dolan et al., Reference Dolan, Peasgood and White2008); country-level characteristics such as gross domestic product (GDP) and unemployment rates (e.g. Easterlin, Reference Easterlin, David and Reder1974; Di Tella and MacCulloch, Reference Di Tella and MacCulloch2006; Deaton, Reference Deaton2008; Stevenson and Wolfers, Reference Stevenson and Wolfers2008; Graham et al., Reference Graham, Chattopadhyay, Picon, Diener, Kahneman and Helliwell2010) have also been identified as being important. Next we fit three welfare typologies in the model: first the classic Esping-Andersen representation of the worlds of welfare capitalism, then the revision with four welfare typologies proposed by Castles (Table 2) and finally a model of the prototypical worlds of welfare capitalism identified by both Esping-Andersen and Castles, where the researchers are in agreement. This model considers the ‘ideal types’, in Max Weber's terms, of welfare regime. The US is regarded as prototypically liberal, Germany as prototypically conservative, with Norway and Sweden as prototypically social-democratic as previously discussed.
Results
A first step in the analysis was to examine the WVS data relating to happiness. Our first (null) model included the OECD countries and suggested that the chance of an individual reporting unhappiness in the sample is around one in ten. Using a basic variance partitioning method,Footnote 4 we found that about 9 per cent of the variation in self-reported unhappiness is attributable to the country level, and very little of the variation is explained by the two waves (i.e. over time). This level of variation is rather low, but may be expected as we are modelling relatively similar high income OECD countries over a short period of time (i.e. 2000–05).
Next, we include in our model all of the individual and country-level characteristics which we know are likely to be important for helping to explain happiness (Table 3). We consider the relative odds in more detail below, unsurprisingly, females are less likely to be unhappy than males (see OECD, 2012). People who are married are less likely to be unhappy compared to those who are single, as we know (Stack and Eshleman, Reference Stack and Eshleman1998); those who have separated (but not divorced) appear to be the most unhappy. People who work full-time report the highest levels of happiness, as expected (Clark, Reference Clark2006), while, unsurprisingly, those who are unemployed are the most unhappy. The familiar U-shaped relationship was apparent amongst the age groups, with happiness higher in younger and older age groups, with unhappiness peaking at middle age (see Blanchflower and Oswald, Reference Blanchflower and Oswald2008). We observe the familiar relationship between income and happiness (discussed by Easterlin, Reference Easterlin2001; Layard, Reference Layard2005), between GDP per capita and happiness (see Deaton, Reference Deaton2008; Stevenson and Wolfers, Reference Stevenson and Wolfers2008) and between employment rates and happiness (Di Tella and MacCulloch, Reference Di Tella and MacCulloch2006). Those in the lowest income groups are more likely to be unhappy, as are countries with a lower GDP per capita and those countries with higher rates of unemployment.Footnote 5 All of the socio-demographic and country-level characteristics shown in Table 3 were found to be important for predicting happiness, and we hold these constant in our worlds of welfare models.
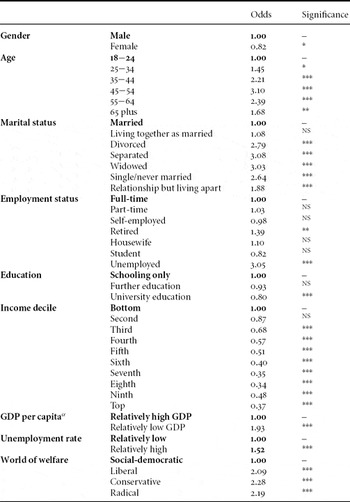
In the Esping-Andersen model (output not tabularised here for brevity), and holding the Social-Democratic World of Welfare Capitalism constant, we find that those living in conservative countries experience twice the odds of being unhappy compared to respondents in the Social-Democratic World (OR 2.01 after controlling for individual- and country-level factors). The difference between levels of unhappiness in social-democratic and liberal societies was not statistically significant; we say more about this in the discussion below. Next we consider the worlds of welfare classification developed by Castles; the results from this model are shown in Table 4. In the third column, we see the odds ratio; the relative odds in this case compare the odds of being unhappy relative to the reference category. The odds ratios show the strength and direction of the predictors, asterisks indicate the level of significance and the ‘base category’ is always one (1.00). For example, the odds of being unhappy for those who report their relationship status as single are more than two and a half times greater than for those who are married. Those who are unemployed experience three times greater odds of being unhappy relative to those respondents who are employed. The odds of unhappiness amongst respondents in the middle-age groups (ages 35–44 and 45–54) are two or three times greater than those in the youngest age group (18–24). The odds of being unhappy for respondents in the older age group (65 plus) are over one and a half times greater than those in the youngest age group, but the older age group are less likely to be unhappy compared to the middle age groups – thus confirming the familiar U-shaped relationship with age (though only after controlling for other factors). The relative odds of being unhappy in the bottom income decile group are nearly three times greater than the top income group. Females are slightly more likely to report happiness than males. Respondents living in countries with a lower GDP per capita experience twice the odds of being unhappy relative to countries with a higher GDP per head. Respondents in countries with a relatively high unemployment rate experience one and a half times the odds of being unhappy relative to those in countries with a relatively low unemployment rate. After controlling for all of the individual and country factors in the Castles model, again we find that the Conservative World of Welfare Capitalism is the least happy. The odds of a person living in a conservative society like Germany or Italy reporting unhappiness are now 2.3 times greater than those in a Social-Democratic society. Those living in a Liberal World of Welfare Capitalism are likely to be happier than those living in a Conservative World, but have twice the odds of reporting unhappiness compared with someone from a social-democratic society. Finally, the odds of being unhappy amongst respondents living in the fourth (Radical) World of Welfare Capitalism, including countries such as the UK and Australia, are 2.2 times greater than respondents living in the Social-Democratic World. All results in relation to the worlds of welfare classification are significant to the p < 0.01 level.
The relative odds of reporting unhappiness (multivariate analysis)

Notes:
Significance levels: * <0.05; **<0.01; ***<0.001.
NSNot significant.
BOLD − base category.
αBinary coded.
Unsurprisingly, we find very little (less than 4 per cent) of the unexplained variation in self-reported happiness can be attributed to the country level. This may be expected as the country-level variables of GDP per capita and unemployment and welfare state typology have been controlled for in the models, which have accounted for most of the unexplained variation at this higher level. Interestingly, the Social-Democratic World does lose some of its predictive power for happiness against the other worlds when inequality at the country level is controlled for in the model (we use the Gini coefficient which is the standard measure of income inequality in a society).Footnote 6 This is not altogether surprising given the primary function of the welfare state can be seen as ensuring socio-economic security and socio-economic equality. It is questionable therefore whether we would wish to dilute some of the welfare state effects that we actually wish to capture and observe in our models however. Therefore inequality is not included in the model we discuss here.
Finally, we include only the prototypical worlds of welfare capitalism (output not tabularised here for brevity), identified by Esping-Andersen and Castles in our model (i.e. the countries underlined in Table 2). Here we observe even greater effects as might be expected, at least if we follow the theory of the worlds of welfare capitalism. After controlling for individual and country factors, we find the results are even more pronounced and suggest that the odds of respondents living in the prototypical Conservative World of Welfare Capitalism (Germany) experiencing unhappiness are nearly four times greater than those living in the prototypical Social-Democratic World (consisting of Norway and Sweden).
Discussion
It is now widely accepted that the measurement of wellbeing is central to the development of social policy. Measures capturing personal experience, such as ‘happiness’, when aggregated at the general population level are an important component of the concept of wellbeing and its application in policy (Diener et al., Reference Diener, Lucas, Schimmack and Helliwell2009; Dolan et al., Reference Dolan, Layard and Metcalfe2011; Graham, Reference Graham2011). There are three uses for any measure of wellbeing (here conceived as happiness) applied to social policy; these are: monitoring social progress overtime, informing the design of policies and the appraisal of policies (Dolan et al., Reference Dolan, Layard and Metcalfe2011). These applications are not mutually exclusive and there is overlap between them. Our particular interest in this article has been with the appraisal of social policy at the macro level, through the examination of welfare state regimes from a happiness perspective. Here we draw out relevant observations from the findings which may help inform the design or promotion of social policies. We also consider some of the limitations of our approach and the potential for future research in this area.
In our study ‘happiness’ has been defined using the ‘feelings of happiness’ data from the WVS. Although this is a well established and accepted measure of general happiness, we note that there is a vast literature and debate on the measurement of happiness itself (e.g. Veenhoven, Reference Veenhoven1993; Kahneman, Reference Kahneman, Kahneman, Diener and Schwarz1999; Easterlin, Reference Easterlin2000). Interestingly, our initial examination of the WVS data reveals high levels of happiness overall in our sample of OECD countries. Typically, levels of happiness in the populations average out at about 90 per cent in the country study group (OECD 18). The finding that the vast majority of people living in high income OECD countries appear reasonably happy is to be expected, and is consistent with recent findings that show life satisfaction rises with average income level all along the national income scale (Deaton, Reference Deaton2008). However, by employing a more robust – multilevel – approach to understanding the relationship between welfare typology and happiness we get a very different story. Our multilevel model is able to separate out effects due to the observed and unobserved individual and welfare state characteristics at the individual level and at the country level, and in doing so we are able to make more reliable inferences about welfare typologies and happiness. As mentioned earlier, the unobserved effects refer to the unexplained variation in the model, which in multilevel modelling is an important part of the model.
In the Esping-Andersen model, we find that people in conservative societies are, controlling for other characteristics, more likely to be unhappy compared to those living in social-democracies, and the difference was found to be significant. We found no statistical difference between happiness in the Liberal and Social-Democratic Worlds. This finding is interesting and may come as a surprise to many working in social policy who have tended to view the Scandinavian Social-Democratic World of Welfare Capitalism as the more desirable for the reasons specified in the introduction. However, we suggest that the model and more specifically the Liberal World is mis-specified, something that is rectified in the (later) Castles model. Francis Castles, while praising Esping-Andersen's highly original work, was also critical; he offered a more nuanced account of the worlds, or ‘families of nations’ as he preferred, and repositioned Australia, New Zealand and the UK to a ‘radical’ fourth world category for the reasons explained earlier (Esping-Andersen, Reference Esping-Andersen1997 also accepted this proposition). From this perspective, our Esping-Andersen model of welfare happiness is mis-specified, and hence we caution against drawing any firm conclusions from this part of the study. In the Castles specification, we observe stark differences in levels of unhappiness by welfare typology. We find that respondents living in the other worlds, after controlling for our explanatory variables, experience at least twice the odds of unhappiness as those living in social-democracies. The observed differences between the worlds of welfare were found to be highly statistically significant. The Conservative World was found to show the highest level of unhappiness, after controlling for individual characteristics and country-level variables. Germany and Italy, the two main countries in this group, experienced relatively high levels of unemployment during the period in question. Over the study period (2000–05) the average rate of unemployment in both countries was close to 10 per cent, which is about twice the OECD country group average of 5 per cent. Unemployment is closely associated with unhappiness as mentioned earlier; significant differences in levels of unhappiness persist between the Conservative and Social-Democratic Worlds however, with unemployment controlled for in the model.
The findings are interesting and provide the opportunity to comment on a number of current debates within the social sciences. Firstly, our findings on happiness appear to support some of the other emerging findings that suggest a link between states of welfare and life satisfaction (e.g. Flavin et al., Reference Flavin, Pacek and Radcliff2011). Secondly, our findings could offer a broad justification for the principles of the welfare state in a more substantive form, at least as a means for promoting wellbeing and happiness in the general population. The findings may also go some way to countering some of the (old and familiar) arguments which have recently resurfaced to suggest there is an element of ‘creep’ in the intellectual case for welfare (Pierson and Leimgruber, Reference Pierson, Leimgruber, Castles, Leibfried, Lewis, Obinger and Pierson2010).Footnote 7 Thirdly, we note that there has been much debate surrounding the evidence provided by Wilkinson and Pickett (Reference Wilkinson and Pickett2010) in their book The Spirit Level: Why Equality is Better for Everyone. Here Wilkinson and Pickett argue that developed countries with less inequality are happier societies, and they provide a range of statistical evidence to support this view, largely using simple (but no less compelling) correlation techniques. Their evidence is fiercely disputed however (Saunders and Evans, Reference Saunders and Evans2010; Snowdon, Reference Snowdon2010). Saunders and Evans (Reference Saunders and Evans2010), for example, speak of ‘wonky statistics’ and ‘spurious correlations’. In sum, the associations in their graphs linking high levels of income inequality with various social problems have been called into question.
Naturally, whatever promotes the harmonious functioning of society and human flourishing is desirable, and social science should be able to assist in helping to identify some of the constituents of wellbeing. In this vein our multilevel approach and findings would add weight to the general observations that more equal capitalist societies are happier, other things having been controlled for. At a more methodological level, this inquiry helps to reveal the power of multilevel analysis for quantifying the relationship between states of welfare and happiness. By combining individual- and country-level effects we are confident in our ability to expose real differences that exist between the different worlds of welfare and happiness, and certainly get beyond what a cursory examination of the data is likely to suggest. Wilkinson and Pickett tend to argue for greater income equality in unequal liberal societies and draw our attention to the failure of social policy in this regard.
Certainly the welfare state is a mechanism for helping to guard against excessive social inequalities and unacceptable living conditions within society. It achieves this to a greater or lesser degree by redistributing resources between members of society as well as redistributing individual resources across the life course, the latter being the ‘piggy bank’ function of a welfare state (Barr, Reference Barr2001). Out of the various worlds of welfare capitalism, the social-democratic one is usually accepted to be the most effective at achieving these welfare functions for the reasons previously discussed, and it is this world that appears to produce the most wellbeing in society (if we accept our general measure of wellbeing). We now turn to the study limitations.
Limitations of study
1. The WVS is a cross-national survey that uses a repeated cross-sectional research design. This means that it has enormous potential for cross-national study as we see here, and for measuring aggregate trends. There are, however, a number of limitations associated with the repeated cross-sectional design, particularly for longitudinal research (Davies, Reference Davies, Dale and Davies1994). Because the same cases are not measured repeatedly, changes in wellbeing over time can only be estimated at the aggregate level, thus making it weak for studying developmental patterns and social change over time.
2. The use of the WVS data for measuring happiness and wellbeing raises cultural issues that deserve comment. Research suggests that the norms and values that people from different cultures attribute to subjective wellbeing and their understandings and reporting of happiness may differ (Jugureanu and Hughes, Reference Jugureanu and Hughes2010). Understandings of happiness may be co-related, at least in part to other culturally contingent tendencies related to states of welfare, e.g. notions of the independent versus interdependent self, personal accomplishment and self-esteem verses social harmony and connectedness.
3. For reasons previously discussed, we have tended to rely on the influential classification proposed by Gøsta Esping-Andersen and the refinement of this thinking offered by Francis Castles. Research and debate in this field, however, continues at a fast pace and the work by Arcanjo (Reference Arcanjo2011) is a recent addition to this vast literature that attempts to reposition countries in light of welfare state reforms. Much of the debate has been concerned with the number of worlds and their composition, and while we are reliant on ‘real worlds’ for our modelling work we also recognise they will inevitably contain a level of impurity compared to ‘ideal worlds’ that is difficult for us to quantify.
4. The WVS data we have modelled in this article predates the global financial crises of 2008 and so the next wave of the WVS in austere times should be interesting.
Further research
We note that the sixth wave of the WVS is currently in progress, covering the period 2010–12, and so it will soon be possible for researchers to revisit self-reported wellbeing in an age of austerity. Additionally, since data from all five waves of the WVS are readily available it will be possible to explore welfare state change and wellbeing over time. This could be an avenue for future research. Pierson's (Reference Pierson2000) work on pathways as well as Jessop's (Reference Jessop1995) work on post-Fordist welfare state regimes is relevant. According to Jessop, the Fordist welfare state, which had been established in the aftermath of the Second World War, was dismantled during the 1980s and 1990s as social policy became subordinated to the demands of the market. Arguments concerning the extent of welfare state convergence in OECD countries are also timely (e.g. Clasen, Reference Clasen2011; Schmitt and Starke, Reference Schmitt and Starke2011). Indeed, some researchers now question the extent to which the distinct Nordic model continues to exist, with more welfare pluralism evident today (e.g. Kvist and Greve, Reference Kvist and Greve2011). The impact of converging welfare models among OECD countries, if this is indeed happening as some suggest, and the impact on social policy and population wellbeing will surely be the subject of ongoing research and speculation.
Conclusions
Our results suggest that the observed differences in happiness have to be explained in terms of overall welfare regime effects. Of course, there is more to measuring our lives than wellbeing and happiness, and governments often have multiple objectives to consider, like growth and sustainable development (Stiglitz et al., Reference Stiglitz, Sen and Fitoussi2010). Whether individual citizens are willing, and feel they can afford, to trade-off more of their individual freedoms to preserve or extend collective welfare and promote the social good is a dilemma facing modern societies. In the real world context, processes of privatisation and financialisation of risk in the industrial and deindustrialising nations will represent a retreat from the kinds of pro-collective welfare best exemplified by the social-democratic ideal; and this, as much as austerity, might portend some reduction in self-reported happiness.
Acknowledgements
We are grateful to referees and JSP editors for helpful comments and suggestions on an earlier version of this paper.
Appendix: World Values Survey (WVS)
The WVS is a global assessment of social, political and economic attitudes and changes. It is the most comprehensive and wide-ranging survey of human values ever taken (the survey data are freely available to download from the WVS website: http://www.worldvaluessurvey.org/). The first study in 1981 evolved from the European Values Survey. Initially, only 22 countries were included, and the survey was clearly Eurocentric. Recognising the need for expansion outside of Europe, a second wave was completed in 1991, a third in 1997, the fourth in 2001 and the fifth in 2007 with eighty-seven countries societies. A sixth wave is currently in progress covering the 2010–12 period. Overall, more than 250,000 individuals constitute the WVS, and the countries surveyed represent almost 80 per cent of the world's population.