The need to obtain products with more attractive appearances dictates the industrial use of dyes. Synthetic dyes are commonly applied in the food, leather, plastic, pharmaceutical, cosmetic and textile industries. In recent years, dyes have caused several environmental problems because they have greater concentrations of coloured effluents than the limit posed by environmental regulations. Therefore, dyes must be treated before being released into wastewater (Aksu, Reference Aksu2005).
New technologies for the degradation or immobilization of dyes in industrial effluents are continually proposed. However, choosing the most efficient and least expensive treatment process depends on the type of dye and how it is used. Dye-containing effluents can be treated by physical (reverse osmosis, nanofiltration, adsorption), chemical (oxidation, ozonation, electrochemistry) and biological methods (biodegradation, biosorption) or by using combined methods, such as coagulation/flocculation and electron beam irradiation (Anvari et al., Reference Anvari, Kheirkhah and Amraei2014). Among these methods, adsorption is the most viable, efficient and economically advantageous (Shen et al., Reference Shen, Fan, Zhou, Gao, Yue and Kang2009).
Much of the research on dye removal describes the adsorption of individual dyes (Yang et al., Reference Yang, Li, Li and Yang2018), but does not address the removal of dyes in multicomponent systems (Al-Duri & McKay, Reference Al-Duri and McKay2007; Turabik, Reference Turabik2008; Shen et al., Reference Shen, Fan, Zhou, Gao, Yue and Kang2009). Studies on the discolouration of multi-solute systems use mostly synthetic effluents that are produced by mixing known dyes at specific concentrations. However, real effluents may present a combination of colours, in addition to various chemicals, such as salts, detergents and surfactants.
The amounts of these chemicals in the effluent vary depending on the industrial process used; therefore, the exact composition of the effluent is unknown (Khlifi et al., Reference Khlifi, Belbahri, Woodward, Ellouz, Dhouib, Sayadi and Mechichi2010). By studying the discolouration of a synthetic effluent composed of ten different dyes, Anvari et al. (Reference Anvari, Kheirkhah and Amraei2014) reported more than one absorption band in the visible region, and they selected the most intense absorption at λ = 540 nm as an index to estimate discolouration efficiency. Moreira et al. (Reference Moreira, Milagres and Mussatto2014) studied the discolouration of real effluents from the textile industry, and they observed two intense absorption bands at 600–700 nm in the electronic spectra of the textile effluents and expressed the discolouration as the percentage reduction in the absorbance of the highest-intensity band at 621 nm. Khlifi et al. (Reference Khlifi, Belbahri, Woodward, Ellouz, Dhouib, Sayadi and Mechichi2010) adopted the same procedure and reported the enzymatic decolourization of textile effluents using laccases, accompanied by absorbance measurements at 600 nm.
Clay materials, such as montmorillonite and bentonite (Roulia & Vassiliadis, Reference Roulia and Vassiliadis2008), palygorskite (Quan et al., Reference Quan, Kong, Lan, Yan and Gao2018; Yang et al., Reference Yang, Li, Li and Yang2018), organobentonite (Baskaralingam et al., Reference Baskaralingam, Pulikesi, Elango, Ramamurthi and Sivanesan2006; Huang et al., Reference Huang, Kazlauciunas, Menzel and Lin2017; Sahnoun & Boutahala, Reference Sahnoun and Boutahala2018), organosepiolite (Karataş et al., Reference Karataş, Senol-Arslan and Ozdemir2018) and modified montmorillonite, have been used as sorbents for dyes (Tireli et al., Reference Tireli, Marcos, Oliveira, Guimarães, Guerreiro and Silva2014; Olivares et al., Reference Olivares, Díaz-Nava and Solache-Ríos2016). The smectitic clays exhibit great sorption capacity because of their large surface area and high cation-exchange capacity (Duarte-Neto et al., Reference Duarte-Neto, Cartaxo, Neves and Menezes2014). In aqueous media, the clay structures usually swell and their basal spacing increases (Leite et al., Reference Leite, Dieguez, San Gil and Menezes2000), rendering the interlamellar cations susceptible to exchange with other cations in a stoichiometric chemical reaction (Duarte-Neto et al., Reference Duarte-Neto, Cartaxo, Neves and Menezes2014). The modification of smectite clays is preferred owing to the rapid substitution of Na+ ions by other ions and the degree of substitution, which may reach 100% (Paiva et al., Reference Paiva, Morales and Díaz2008; Duarte-Neto et al., Reference Duarte-Neto, Cartaxo, Neves and Menezes2014).
The adsorption capacity of a material is closely associated with the surface and surface charge phenomena (Yukselen & Kaya, Reference Yukselen and Kaya2003). When solid particles are immersed in water, the relative movement of the solid particles and water results in the ζ-potential at the solid–liquid interface (Sze et al., Reference Sze, Erickson, Ren and Li2003; Kosmulski, Reference Kosmulski2016). Thus, the ζ–potential of the particles is an indicator of their electrical potential. The pH at which the surface charge of the particles is zero is called the isoelectric point (pHPIE). Below and above the pHPIE, the immersed solid has a positively and negatively charged surface, respectively (Pecini & Avena, Reference Pecini and Avena2013). The pH affects both the behaviour of the adsorbent and the ionization degree of the dyes.
Materials such as smectite have a permanent negative surface charge and are independent of the pH of the medium (Melo & Alleoni, Reference Melo and Alleoni2009). The negative structural charge prevents electrostatic attraction between clay particles and inorganic anions; thus, the application of these clay minerals as sorbents of anionic species is only possible after their surface modification. The exchange of ions with inorganic cations is one possible modification technique (Grygar et al., Reference Grygar, Hradil, Bezdicka, Dousova, Capek and Schneeweiss2007; Borgnino et al., Reference Borgnino, Avena and De Pauli2009). The replacement of crystalline lattice ions with higher-charge ions will produce a positive net charge.
The adsorption of anionic dyes in natural smectites is limited because both the smectite and the dye molecules have a negative surface charge. Therefore, we propose the enrichment of two smectite clays with Fe(III) ions to modify their surface charge, generating sorbent materials for the discolouration of a synthetic effluent containing a mixture of seven anionic dyes. The effluent decolourization efficiency was determined by wavelength readings of the greatest absorption band at 562 nm.
Materials and methods
Materials
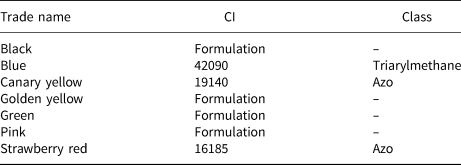
Argel® and Volclay® smectite clays were purchased from Buntech. The reagent used for the enrichment of clays with Fe(III) was ferric chloride hexahydrate (FeCl3.6H2O; Alphatec, P.A.). The selected anionic dyes (yellow, gold, blue, pink, black, green and red) (Saramanil) belong to the dye classes widely used in Brazil. Table 1 lists the trade name and colour index (CI) of each dye, and its classification according to the chromophore group.
Characteristics of the dyes used.

According to the CI, canary yellow, blue and strawberry red dyes refer to tartrazine, Brilliant Blue FCF and amaranth, respectively (Fig. 1). The remaining colours are formed through the combination of several wavelengths. For example, green is obtained with a mixture of yellow tartrazine and Brilliant Blue FCF (Takashima et al., Reference Takashima, Takata and Nakamura1988).
Chemical structures of the dyes amaranth (strawberry red), Brilliant Blue FCF and tartrazine (canary yellow).

Clay-mineral enrichment
The clay minerals (Argel and Volclay) were enriched with Fe(III) ions, forming the modified clays Argel-Fe and Volclay-Fe in aqueous media according to the methodology proposed by Grygar et al. (Reference Grygar, Hradil, Bezdicka, Dousova, Capek and Schneeweiss2007). A suspension of each clay (1% w/v) was prepared in 2.0 L of distilled water and stirred mechanically (500 rpm) for 24 h to achieve complete dispersion and swelling. At this stage, the interlamellar water molecules were absorbed, leading to an expansion that could reach 20 times the initial volume of the clay minerals (Paiva et al., Reference Paiva, Morales and Díaz2008). Then, ~81 g of ferric chloride hexahydrate was dissolved in 100 mL of distilled water, and the solution was added to the suspension in a controlled manner and under constant mechanical stirring. During this addition, the clays were coagulated because of the increase in the ionic charge.
The mechanical agitation was maintained for 4 h to homogenize the colloidal suspension completely (Fig. S1). The enriched clay was vacuum-filtered, washed several times with distilled water and dried at room temperature. The dried samples were hand-sprayed, ground with an agate mortar and sieved (60 mesh) before being stored. At rest, the enriched clay minerals formed a biphasic system, indicating that the clays have been modified.
ζ-potential
The ζ-potential of the clay minerals was measured before and after the enrichment with Fe(III) ions using 400 mg suspensions of each clay mineral dispersed in 30 mL of distilled water. The suspensions were placed in an ultrasonic bath for 8 min and allowed to stand for 15 min. The supernatant was then collected, and the ζ-potential was measured as a function of pH between 2 and 12. The ζ-potential of the enriched clay minerals was also recorded after the adsorption of a stock solution containing the dye mixture. A total of 200 mg of the previously swollen sorbent was added in 5.0 mL of distilled water to a 15 mL aliquot of the stock solution. The mixture was kept under magnetic stirring for 5 min; after adsorption, the supernatant was removed, and the solid sample was dried at 25°C and sprayed. The coloured powder obtained was sieved (60 mesh), suspended in 30 mL of distilled water and placed in an ultrasonic bath for 8 min. After standing for 15 min, the supernatant was collected and the ζ-potential was measured as a function of pH between 2 and 12.
Stock solution of dyes
A stock solution was prepared via a common industrial method of diluting each dye (black, blue, canary yellow, golden yellow, green, pink and strawberry red) at the same concentration (100 mg L–1). The final concentration was 700 mg L–1.
Analytical curve
A solution of 262.5 mg L–1 was prepared from the stock solution. After determining the wavelength of maximum absorbance (λmax), we constructed a calibration curve for the stock solution (Fig. S2). The decrease in absorbance at 562 nm indicated the discolouration of the dye mixture; λmax is commonly selected in the visible wavelength region to estimate the effluent decolourization efficiency (Khlifi et al., Reference Khlifi, Belbahri, Woodward, Ellouz, Dhouib, Sayadi and Mechichi2010; Anvari et al., Reference Anvari, Kheirkhah and Amraei2014; Moreira et al., Reference Moreira, Milagres and Mussatto2014).
Adsorption kinetics study
We performed kinetics studies on the adsorption of the dye mixture to Argel-Fe and Volclay-Fe at the resulting natural pH for each adsorbent/adsorbate system (3.0 ± 0.2) at 298 K. A total of 15 mL of the stock solution was added in 50 mL Falcon tubes, with 0.2 ± 0.001 g of adsorbent previously dispersed in 5 mL of distilled water, in an ultrasonic bath for 8 min. The experiments were conducted under controlled temperature conditions and shaking at 180 rpm. The samples were removed at predetermined time intervals (1, 2, 3, 4, 5, 10, 15, 20 and 30 min) centrifuged for 5 min at 3500 rpm, and the absorbance of the supernatant was monitored using an ultraviolet–visible (UV–Vis) spectrophotometer. The kinetic data were treated mathematically using the non-linearized pseudo-first-order (Eq. 1) and pseudo-second-order (Eq. 2) models.
 $$q_{\rm t} = q_{\rm e}\lpar 1-e^{{-}{\rm k}_1t}\rpar $$
 $$q_{\rm t} = \,\displaystyle{{{\rm k}_2\,q_{\rm e}^2 \,t} \over {1 + {\rm k}_2\,q_{\rm e}\,t}}$$
where q e (mg g–1) is the quantity adsorbed at equilibrium, q t (mg g–1) is the amount adsorbed at time t, t (min) is the time, k1 (min–1) is the rate constant of the pseudo-first-order model and k2 (g mg–1 min–1) is the rate constant of the pseudo-second-order model.
Measurements of removal efficiency and the adsorption isotherm
The batch experiments were carried out in 50 mL Falcon tubes containing 0.2 ± 0.001 g of adsorbent previously swollen in 5 mL of distilled water, and 15 mL of solution with various concentrations of the dye mixture (400–850 mg L–1). The isotherms were constructed under controlled temperature conditions (298 K) and stirring at 180 rpm for 30 min. The samples were centrifuged at 3500 rpm for 5 min, and the concentration of dyes in the solution after adsorption was determined with a UV–Vis spectrophotometer. The isotherm data were analysed based on the Langmuir (Eq. 3), Freundlich (Eq. 4) and dual-site Langmuir–Freundlich (LF) models (Eq. 5).
 $$q_{\rm e} = \displaystyle{{q_{\rm m}{\rm K}_{\rm L}C_{\rm e}} \over {1 + {\rm K}_{\rm L}C_{\rm e}}}$$
 $$q_{\rm e} = {\rm K}_{\rm F}C_{\rm e}^{1/n} $$
 $$q_{\rm e}\;= \;\displaystyle{{b_1\!{\lpar {\rm k}_1\!C_{\rm e}\rpar }^{n_1}} \over {1+ {\lpar {\rm k}_1\!C_{\rm e}\rpar }^{n_1}}} + \displaystyle{{b_2{\lpar {\rm k}_2C_{\rm e}\rpar }^{n_2}} \over {1+ {\lpar {\rm k}_2C_{\rm e}\rpar }^{n_2}}}$$
where q e (mg g–1) is the amount adsorbed at equilibrium, C e (mg L–1) is the concentration of the dye mixture in equilibrium solution, q m (mg g–1) is the maximum adsorption capacity, KL (L mg–1) is the equilibrium constant of Langmuir at equilibrium, KF (mg g–1 (L mg–1)1/n) is the Freundlich constant and n is the heterogeneity factor. The LF model for two adsorption sites has been applied to model adsorption studies on heterogeneous surfaces. In Eq. 5, b (mg g–1) is the maximum adsorption capacity and n is the heterogeneity index, where n = 1 corresponds to a homogeneous material, while n < 1 corresponds to an increase in the heterogeneity of the material (Umpleby et al., Reference Umpleby, Baxter, Chen, Shah and Shimizu2001; Guilarduci et al., Reference Guilarduci, Mesquita, Martelli and Gorgulho2006).
The adsorption capacity at equilibrium (q e) was calculated from Eq. 6. The concentration of the dye mixture in the supernatant solution was analysed, and the percentage removal (R%) was calculated using Eq. 7.
 $$q_{\rm e} = \lpar C_0-C_{\rm e}\rpar \displaystyle{V \over m}$$
 $$R\lpar \% \rpar = \left({\displaystyle{{C_0-C_{\rm e}} \over {C_0}}} \right)\times 100$$
where V (L) is the volume of the solution, m (g) is the mass of the adsorbent and C 0 (mg L–1) is the initial concentration of the dye solution.
Characterization of the clay minerals
The solid–liquid interface was chemically characterized with ζ-potential measurements as a function of pH variation using the Malvern ZetaSizer Nano ZS90 with an automatic titrator. The compositions of modified and unmodified clay minerals were analysed with X-ray fluorescence (XRF) using an energy-dispersion Shimadzu EDX-720 (EDXRF) benchtop spectrometer. The mineralogy of the clays was determined with X-ray diffraction (XRD) using a Bruker D2 PHASER X-ray diffractometer. Fourier-transform infrared (FTIR) spectra were obtained using a Bruker Vertex 70 spectrometer with a Platinum ATR reflectance accessory in the range 400–4000 cm–1 and a 4.0 cm–1 spectral resolution. The spectra were the averages of 16 scans. Electronic spectra (UV–Vis) were obtained using an Ocean Optics USB2000 spectrophotometer in the spectral range of 200–800 nm with a spectral resolution of 1.0 nm.
Colourimetry (CIE L*a*b*)
Colourimetric measurements were obtained using a Konica Minolta portable colourimeter, model CR-400 Chroma Meter, with a D65 light source at an angle of 2°. Colour measurement followed the CIE L*a*b* system. This system describes numerically each element of the composition of a colour, which is represented by the colourimetric parameters of lightness (L*), coordinate on the red–green axis or redness (a*) and coordinate on the blue–yellow axis or yellowness (b*) (Zollinger, Reference Zollinger2003). In addition, quantification of the colour difference between two samples is described by the parameter ΔE (Eq. 8). The higher the value of ΔE, the greater the sensitivity of the human eye to the colour difference. In this study, natural clays were used as references for Fe-clays and Fe-clays as references for Fe-clays/dyes. The saturation parameter (C*) was also determined, which indicates the degree of concentration or purity of a colour (Eq. 9) (Quindici, Reference Quindici2013):
 $$\Delta E\;= \;\sqrt {{\lpar L_1^\ast{-}L_2^\ast \rpar }^2 + {\lpar a_1^\ast{-}a_2^\ast \rpar }^2 + {\lpar b_1^\ast{-}b_2^\ast \rpar }^2} $$
 $$C^\ast = \sqrt {a^{{\ast} 2} + b^{{\ast} 2}} $$
where index 1 indicates the reference colour and index 2 indicates the measured colour.
Results and discussion
ζ-potential
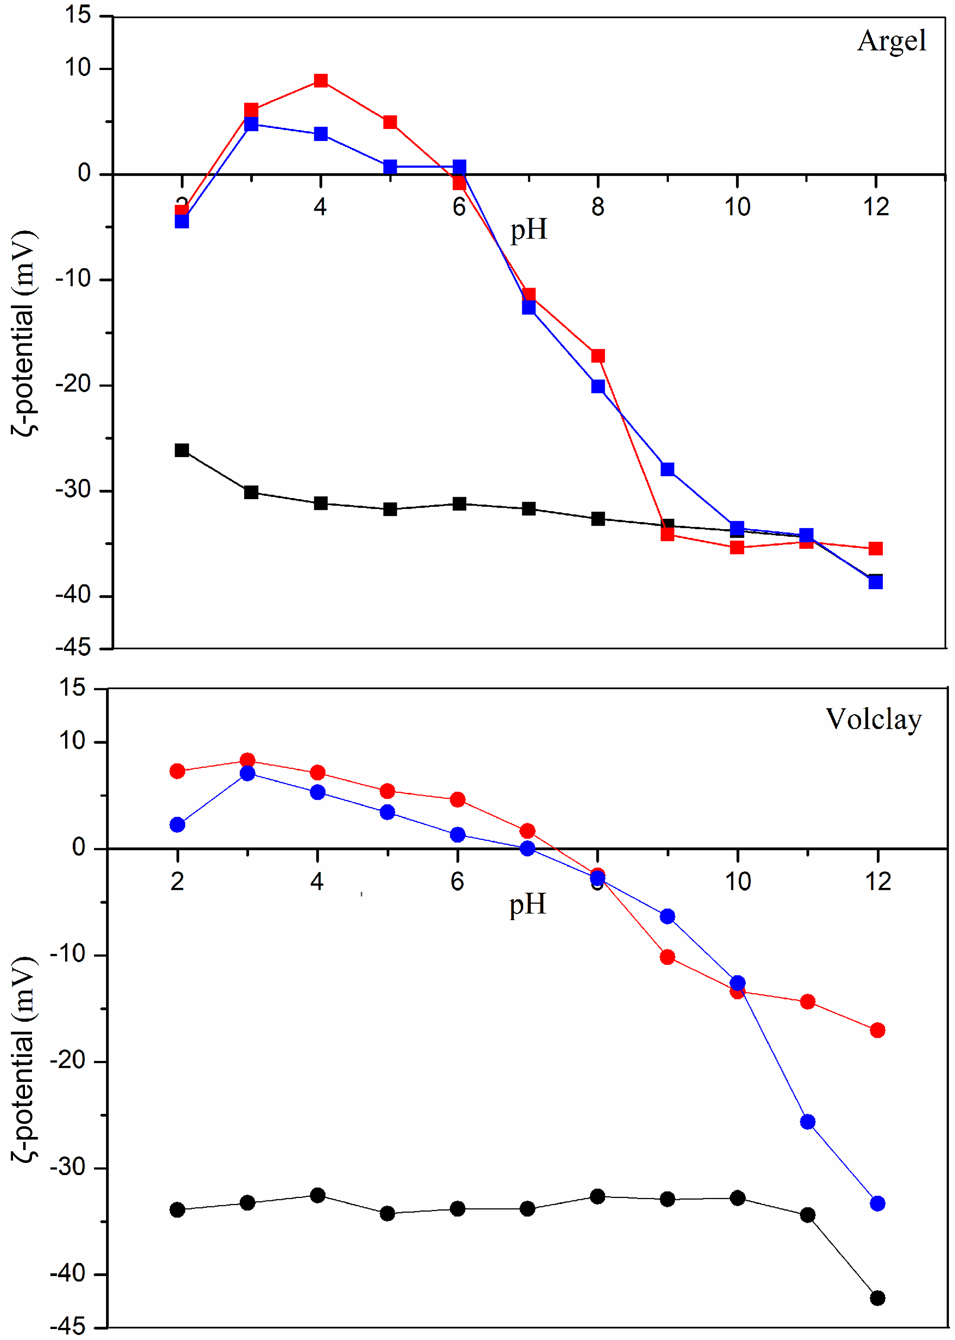
The magnitude of the ζ-potential is an indicator of the stability of the colloidal system. A high ζ-potential generates electrostatic repulsion and confers stability on the particles, preventing aggregation and flocculation occurring in the dispersion (Mekhamer, Reference Mekhamer2010). The ζ-potential of Argel and Volclay in the pH range of 3–12 (Fig. 2) was <–30 mV, indicating that their particles were highly stable in the suspensions, which prevented the flocculation of the particles.
pH vs ζ-potential: Argel (black squares), Argel-Fe (red squares), Argel-Fe/dyes (blue squares), Volclay (black circles), Volclay-Fe (red circles) and Volclay-Fe/dyes (blue circles).
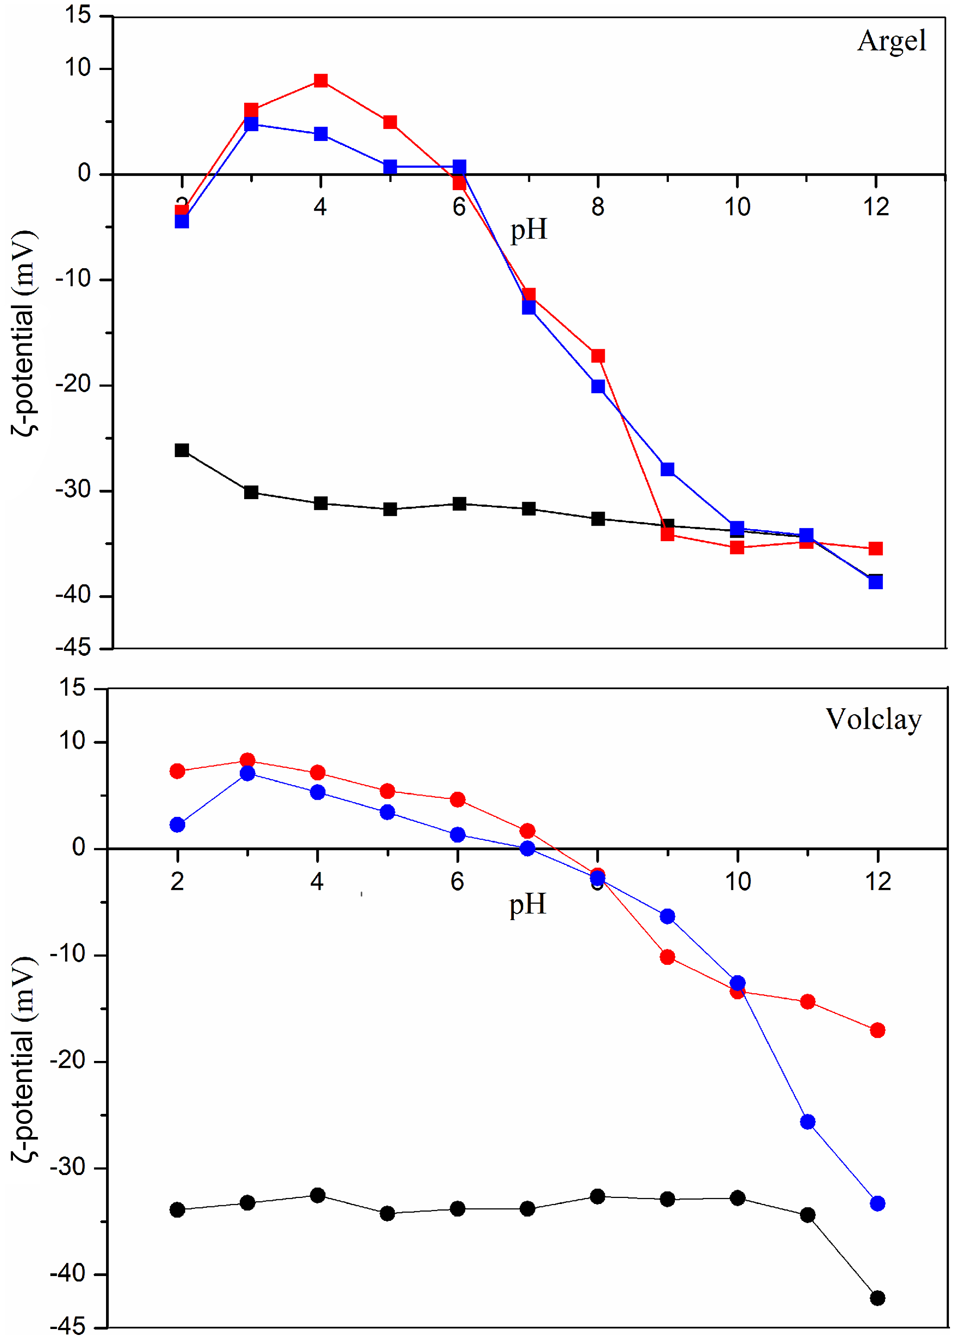
The decanting and formation of a biphasic system, in which a continuous phase and a dispersed phase are distinguishable, reveal the clay modifications (Fig. S1, A3 and V3). The formation of the heterogeneous system can be attributed to the destabilization of the colloidal particles, caused by Fe(III), at pH <8.7 for Argel-Fe and throughout the pH range for Volclay-Fe. The enrichment of the clay minerals decreased the negative surface charge and yielded two pHPIE values of 2.3 and 5.8 for Argel-Fe and a pHPIE value of 7.3 for Volclay-Fe. This variation in the surface charge of the clay minerals may be attributed to the replacement of monovalent or bivalent exchangeable cations of the smectites by Fe(III) ions. As the valence of the incoming Fe(III) ions is greater than that of the exchangeable ions, a positive excess charge occurred on the surface of the clay minerals (Melo & Alleoni, Reference Melo and Alleoni2009).
The adsorption is controlled mainly by the chemical properties of the dyes and the surface of the adsorbent. For efficient adsorption, the surface charge of the clay minerals must be opposite to that of the dyes, promoting an electrostatic interaction between the adsorbent and adsorbate (Huang et al., Reference Huang, Kazlauciunas, Menzel and Lin2017; Karataş et al., Reference Karataş, Senol-Arslan and Ozdemir2018). Thus, the adsorption of dyes will be greater at pH < pHPIE because the surface of the adsorbents will be positively charged and will present a greater number of positive sites, favouring the interaction of the adsorbents with the anionic dyes present in the mixture. However, even if the net surface charge of the adsorbents is negative, the dyes may be adsorbed at pH <9 for Argel-Fe and <11 for Volclay-Fe because of the few positive active sites on the surface of the modified adsorbents (Ortega et al., Reference Ortega, Pandolfelli, Rodrigues and Souza1997). The number of positive sites on the surface of the adsorbents increases with the decrease in pH, rendering them increasingly positively charged, which increases the adsorption capacity for anionic molecules. Previous studies on the influence of pH on the adsorption of anionic dyes show that the adsorption capacity of anionic dyes per positively charged surface is greater at acidic pH values (Aljeboree et al., Reference Aljeboree, Alshirifi and Alkaim2017). This behaviour is due to the increase in the electrostatic attraction between the positive charge of the adsorbent and the molecules of the anionic dyes (Eq. 10) in their dissociated form (Aljeboree et al., Reference Aljeboree, Alshirifi and Alkaim2017; Banerjee & Chattopadhyaya, Reference Banerjee and Chattopadhyaya2017; Karataş et al., Reference Karataş, Senol-Arslan and Ozdemir2018).
 $${\rm Dye\;}- \;{\rm S}{\rm O}_3{\rm N}{\rm a}^0{\rm \;}\mathop \to \limits^{{\rm pH\;}3} {\rm \;Dye\;}- \;{\rm SO}_3^- + {\rm N}{\rm a}^ + $$
Generally, the adsorption of anionic dyes decreases the pHPIE value (Huang et al., Reference Huang, Kazlauciunas, Menzel and Lin2017). However, analysis of the ζ-potential for the adsorbent–dye binary system indicated that the adsorption of the dye mixture did not modify significantly the pHPIE value or the surface charge of the adsorbents, with a predominance of the initial positive charge of the enriched clays, Fe-Argel and Fe-Volclay. With increasing pH, the surfaces of the particles were deprotonated and the magnitude of the negative electrokinetic potential of the particles increased for both the enriched clays and the Fe-clay–dye binary systems.
Compositional analysis using XRF
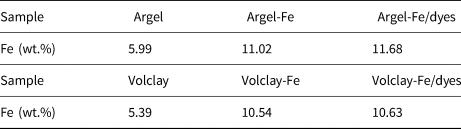
The atomic percentages of iron were 5.99% in Argel, 11.02% in Argel-Fe, 5.39% in Volclay and 10.54% in Volclay-Fe (Table 2). The fact that the iron content in the enriched clays was greater than in the precursor clays suggests that the modification was successful (Borgnino et al., Reference Borgnino, Avena and De Pauli2009) and corroborates the results obtained for the ζ-potential, justifying the increase in its magnitude and the variation in the pHPIE for enriched clay minerals.
Fe content in unmodified and modified clays and after sorption of the dye mixture.
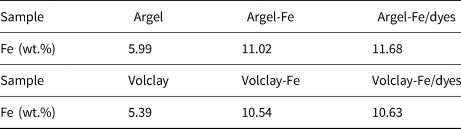
The percentage of iron in the two clay minerals was maintained after the dye-removal phase (Fe-clays/dyes) (Table 2), suggesting that the Fe(III) ions were not leached during dye adsorption; this was attributed to the strong surface electrostatic interaction between the clays, Fe3+ and dyes. The lack of leaching indicated that the Fe3+ cations were intercalated in the clay minerals, proving the chemical stability of the Fe-clays under these conditions (Banković et al., Reference Banković, Milutinović-Nikolić, Mojović, Jović-Jovičić, Žunić, Dondur and Jovanović2012).
XRD and FTIR analysis
The XRD traces of Argel and Volclay (Fig. 3) showed characteristic peaks of the smectite group, quartz and feldspar, in accordance with previous studies on Argel and Volclay (Mariani et al., Reference Mariani, Villalba and Anaissi2013).
XRD traces of Argel, Argel-Fe and Argel-Fe/dyes (top) and Volclay, Volclay-Fe and Volclay-Fe/dyes (bottom).
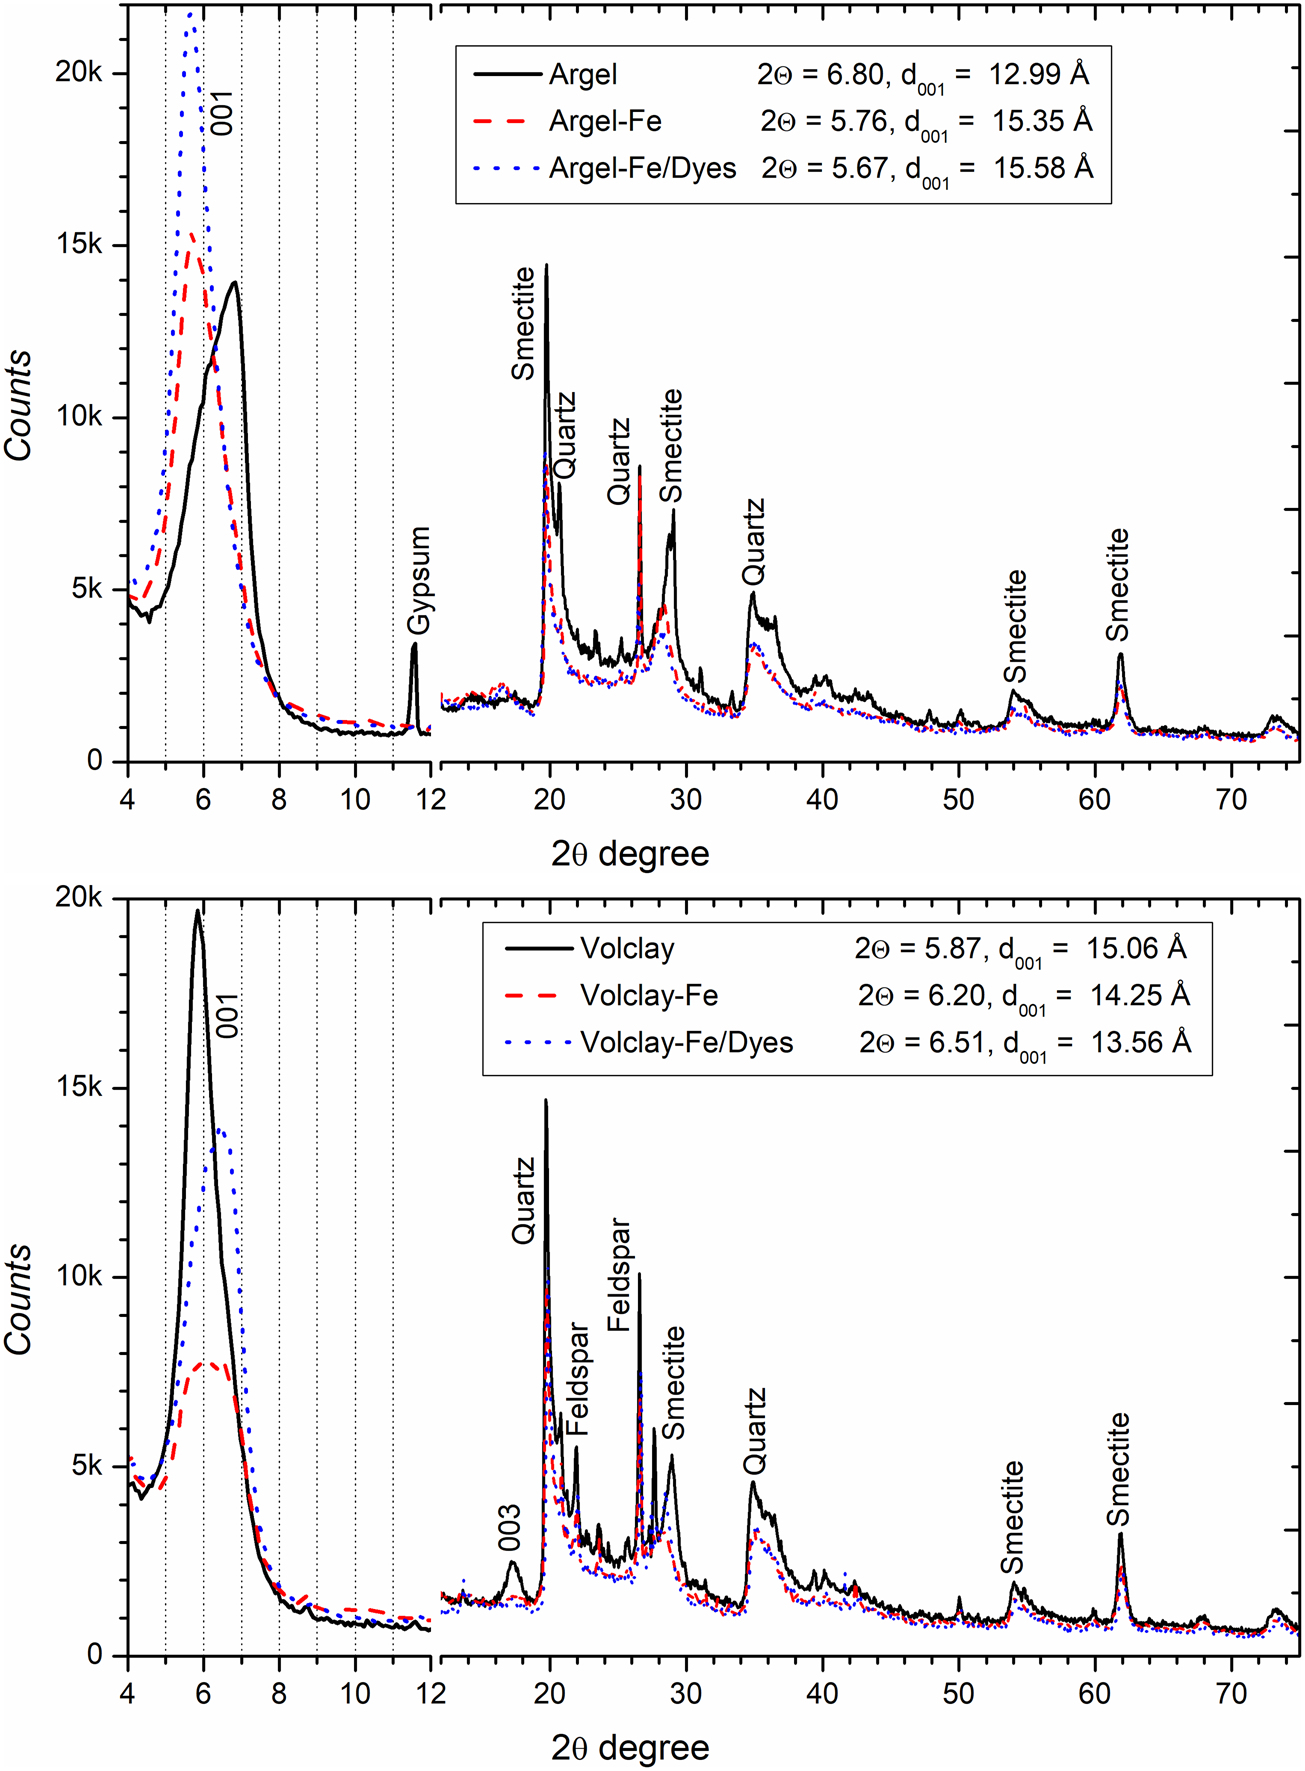
The treatment of clay minerals with concentrated acidic or basic solutions can induce extreme leaching or dissolution of the octahedral sheet, thereby altering their structure (McBride, Reference McBride1994; Dramé, Reference Dramé2005). The reflections of the natural clays are maintained in the XRD patterns of the modified clays, proving the integrity of the smectite layers after the enrichment and adsorption of the dye mixture. Tireli et al. (Reference Tireli, Marcos, Oliveira, Guimarães, Guerreiro and Silva2014) and Hernández-Hernández et al. (Reference Hernández-Hernández, Solache-Ríos and Díaz-Nava2013) reported similar results when working with Fe(III)-modified clays, indicating that the modification was successful. The exchange of Fe(III) ions did not alter particle morphology (Odom, Reference Odom1984; Olivares et al., Reference Olivares, Díaz-Nava and Solache-Ríos2016) and produced a net positive charge on the clays (Barton & Karathanasis, Reference Barton and Karathanasis2002).
The 001 diffraction maximum of Argel at 6.80°2θ (d 001 = 12.99 Å) is typical of Na-smectites (Fig. 3, top). After exchange with Fe(III) ions, the diffraction 001 maximum shifted to lower angles (5.76°2θ, d 001 = 15.35 Å) and its intensity increased. The increase in basal spacing might be due to the Fe(III) polymer species intercalated within the interlayer (Dramé, Reference Dramé2005).
The 001 reflection of Volclay (Fig. 3, bottom) was intense and occurred at 5.87°2θ (d 001 = 15.06 Å). An additional reflection with lower intensity was observed for Volclay-Fe at 6.20°2θ (d 001 = 14.25 Å), in accordance with Borgnino et al. (Reference Borgnino, Avena and De Pauli2009). This result might be attributed to either the radius of the smaller ferric ions compared to that of sodium ions (suggesting that at least part of the added Fe(III) was present in the interlamellar space) or the greater intensity of the attractive forces between the iron in the interlamellar space and the Si tetrahedra (Chen et al., Reference Chen, Han and Yan1998). The decrease in the intensity of 001 reflection after modification with Fe(III) suggested the intercalation of the ferric ions in the interlayer of Volclay smectite, as well as the possibility that structures with more disordered intercalated morphologies were obtained (Luengo et al., Reference Luengo, Puccia and Avena2011).
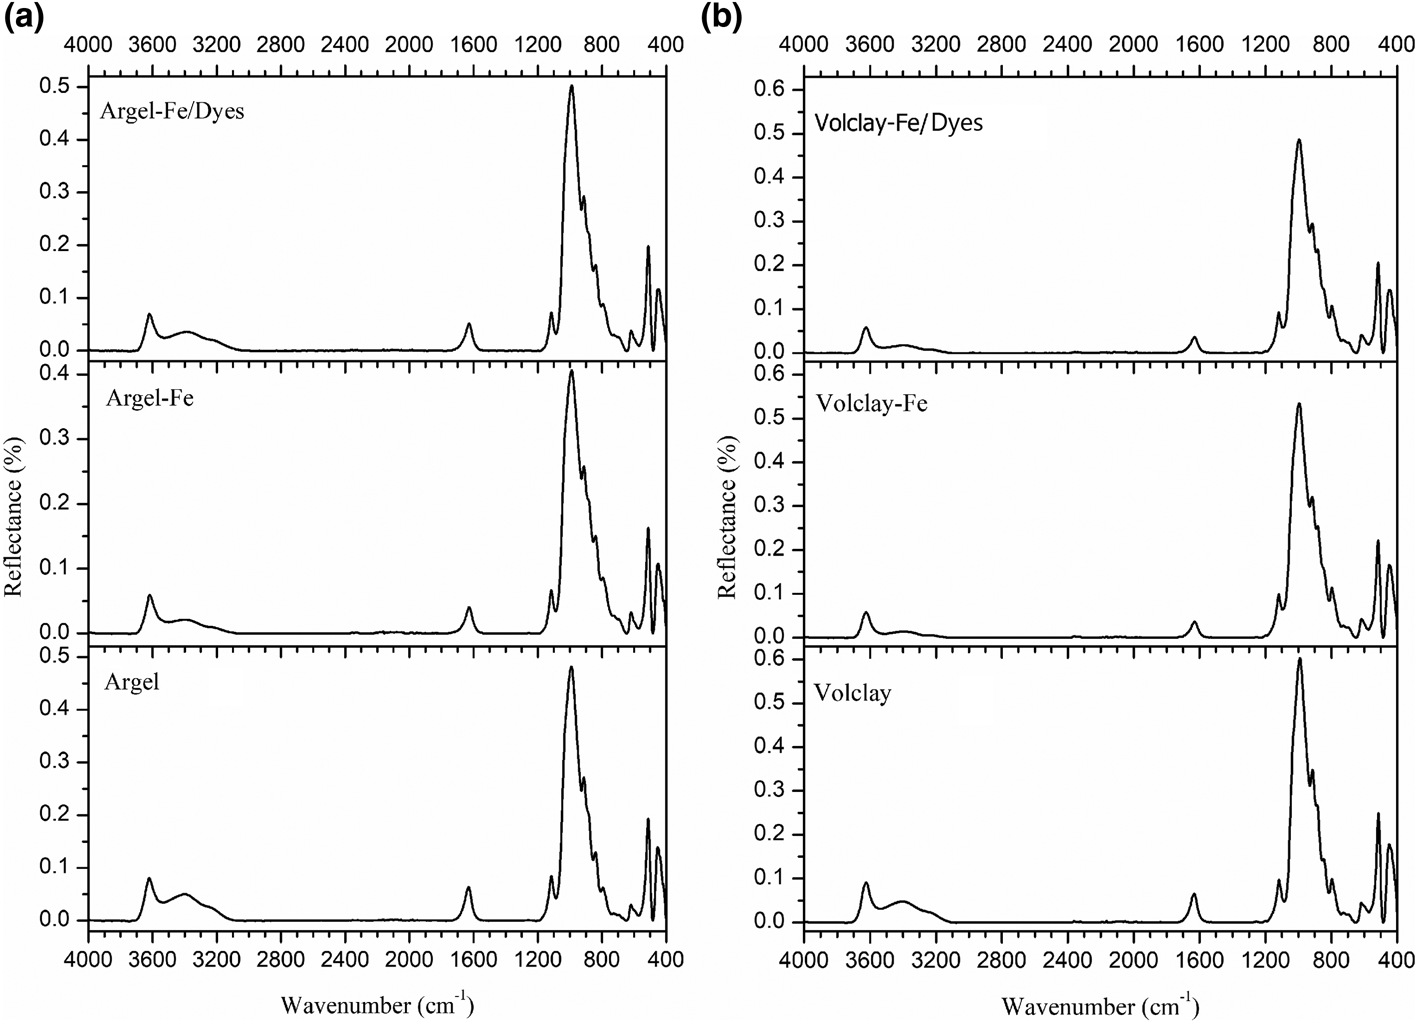
The FTIR spectra of Argel and Volclay (Fig. 4) are consistent with previously reported spectra of smectite clays (Santos et al., Reference Santos, Melo, Melo and Sobrinho2002; Mariani et al., Reference Mariani, Villalba and Anaissi2013; Kyzioł-Komosińska et al., Reference Kyzioł-Komosińska, Rosik-Dulewska, Dzieniszewska, Pająk and Krzyżewska2014). These spectra include bands at 990 cm–1 (Si–O–Si asymmetric stretching), 912 cm–1 (Al–OH–Al deformation vibrations), 795 cm–1 (Si–O–Al vibrations with substitution of Si by Al at the tetrahedral site), 513 cm–1 (Si–O–Al vibrations with Si at the tetrahedral site and Al at the octahedral site), 455 cm–1 (Si–O–Si angular deformation) and 619 cm–1 (Al–O and Si–O bonds). The bands referring to the OH group at 1632 and 3400 cm–1 indicate hydration (Santos et al., Reference Santos, Melo, Melo and Sobrinho2002; Mariani et al., Reference Mariani, Villalba and Anaissi2013), and the band at 3622 cm–1 is attributed to structural OH stretching. The FTIR characterization corroborates the XRD results, suggesting that the clays do not undergo structural modification after the enrichment with Fe(III) ions or after the adsorption of the dye mixture. Iron presents a characteristic connection band at ~560 cm–1. However, this band was not observed in any of the spectra, suggesting that the iron is not bound directly to the clay and that the clay–Fe interaction is electrostatic.
FTIR spectra of (a) Argel, Argel-Fe and Argel-Fe/dyes and (b) Volclay, Volclay-Fe and Volclay-Fe/dyes.

Electronic spectroscopy (UV–Vis)
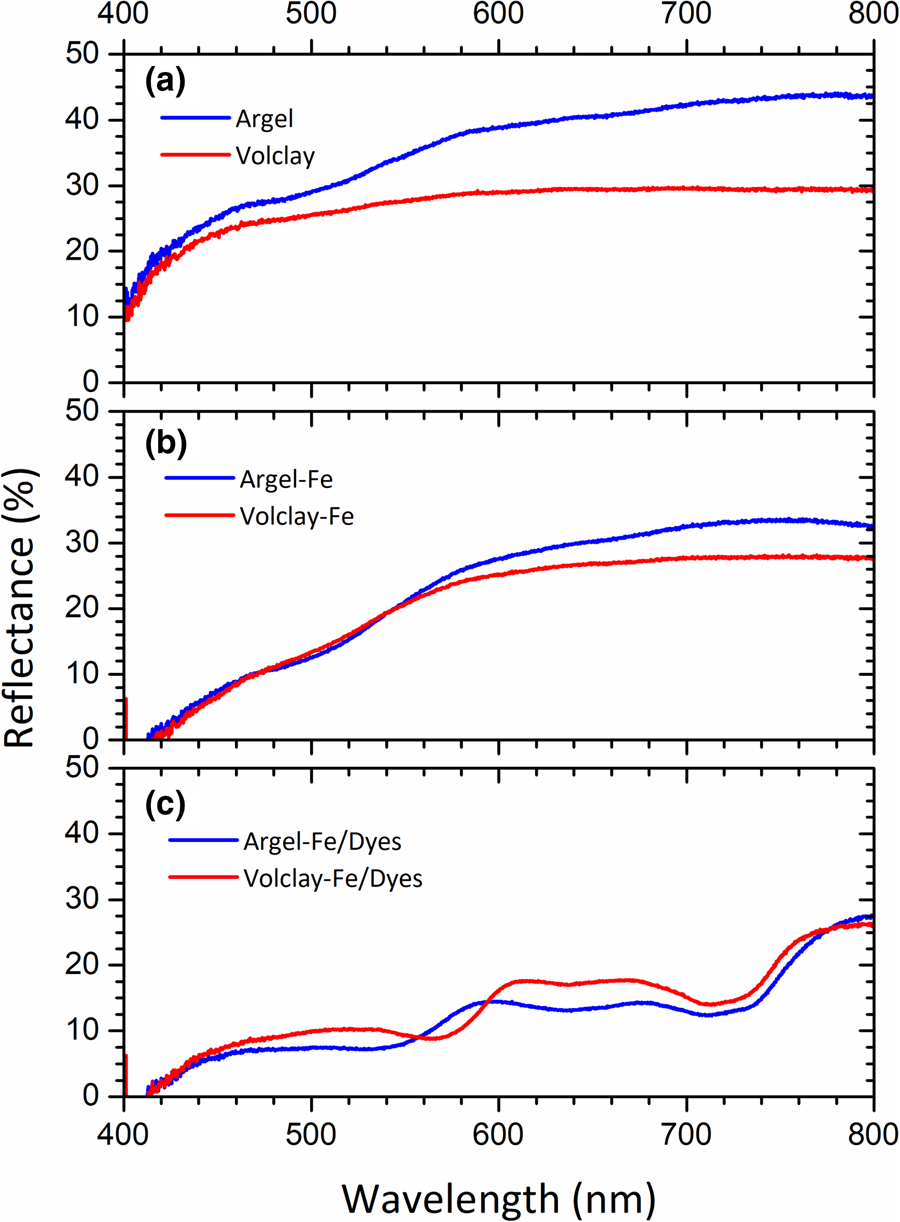
The reflectance spectra of Argel and Volclay (Fig. 5a) show a broad band in the 400–480 nm range (blue region). While the reflectance of Volclay is constant at greater wavelengths, the spectrum of Argel contains a band between 500 and 570 nm (green region), and its reflectance starts at 580 nm (yellow region) and increases up to >700 nm (red region). After the modification (Fig. 5b), the spectra of both clays present enlarged bands in the blue and green regions, and a greater reflectance in the red region. Fe-clays/dyes (Fig. 5c) have an enlarged band in the blue and green region. In addition, the adsorbents have a band at 670 nm and a wide band starting at 740 nm. Finally, the spectrum of Argel-Fe/dyes shows a band at 595 nm, while that of Volclay-Fe/dyes shows a band at 613 nm (orange region).
Reflectance spectra of (a) the original clays, (b) the Fe-clays and (c) the Fe-clays/dyes.

Colourimetry (CIE L*a*b*)
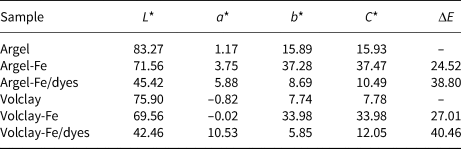
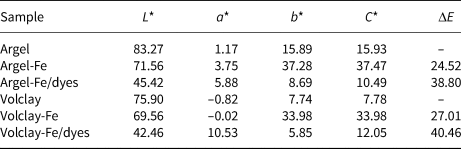
The colouration of the clays changed after enrichment with Fe(III), and their appearance was altered after the adsorption of the dye mixture (Fig. S3). The modification of the clays and the adsorption of the dye mixture decreased lightness (L*), rendering the samples darker (Table 3). The values of C* increased with the presence of Fe(III) ions, indicating an increase in the colour intensity; however, the intensity decreased after the adsorption of the dyes. The ΔE values indicate large differences between the colours of the samples that are easily perceptible to the human eye. These colour differences are greater than those for the Fe-clays and Fe-clays/dyes. Generally, the modification of the clays and adsorption of the dyes increased the redness values (a*). The modification also caused an increase in the yellowness values (b*) of the samples, while the adsorption of the dyes had the opposite effect.
Colour parameters for CIE L*a*b* colour space (McLaren, Reference McLaren1976) of the powder samples.
Discolouration efficiency of synthetic effluent
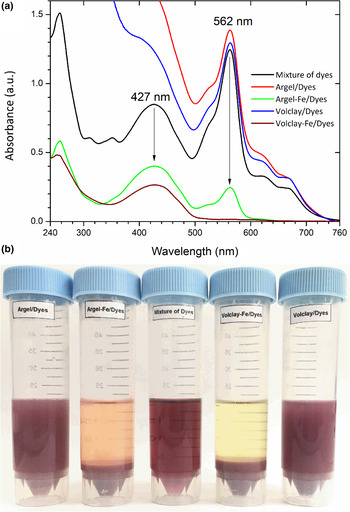
Modified clay minerals may exhibit ten times greater dye adsorption capacities than unmodified clay minerals (Ozcan et al., Reference Ozcan, Erdem and Ozcan2004, Reference Ozcan, Erdem and Ozcan2005). The increase in the capacity of the modified clays to adsorb the dye mixture may be related to the presence of Fe(III). Adsorption of iron modified the aggregation properties of clay layers to those of a solid with greater porosity and a greater surface area (Borgnino et al., Reference Borgnino, Avena and De Pauli2009), enabling the increase in the removal efficiency of the anionic dyes. The decolourization efficiency of the synthetic effluent in pH 3.0 ± 0.2 was monitored via the intensity change in the absorption band at 562 nm. The degree of discolouration of the synthetic effluent was 80% for Argel-Fe and 98% for Volclay-Fe (Fig. 6).
(Upper) UV–Vis spectra and (lower) images of Argel/dyes, Argel-Fe/dyes, mixture of dyes, Volclay-Fe/dyes and Volclay/dyes. The initial concentration was 525 mg L–1.

Adsorption isotherm and kinetics
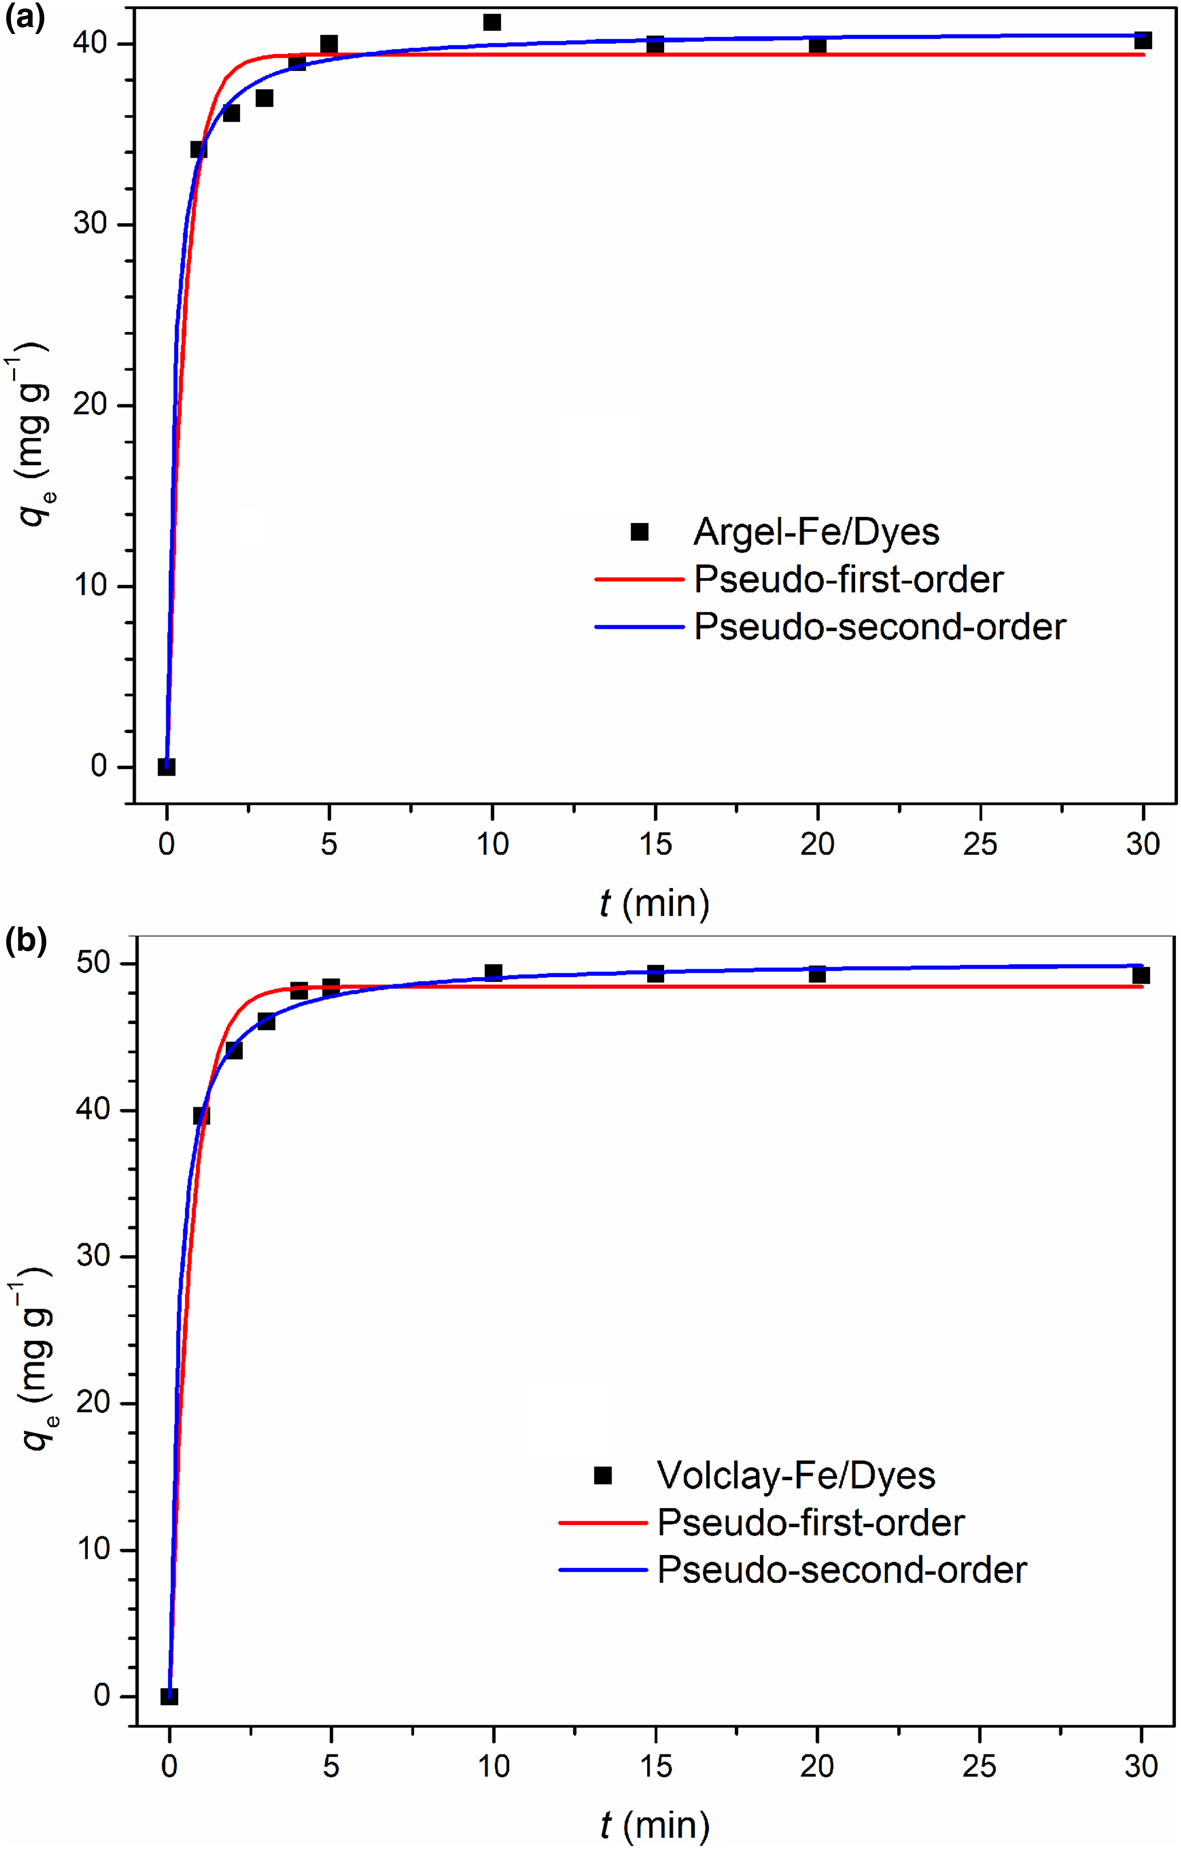
Both Fe-clay systems reached the adsorption equilibrium after ~5 min (Fig. 7). The rapid decolourization and achievement of equilibrium may be related to the rapid distribution of the dye molecules on the outer surface of the adsorbents due to the large specific surface area of the Fe-clays (Borgnino et al., Reference Borgnino, Avena and De Pauli2009), in addition to the limited competition between the molecules (Sahnoun & Boutahala, Reference Sahnoun and Boutahala2018). According to Noroozi & Sorial (Reference Noroozi and Sorial2013), competitive interactions should not play a significant role in the adsorption process at low concentrations. The time required for the adsorption of the dye mixture and the simple and continuous saturation curve shape suggest a monolayer coating of the dye molecules on the adsorbent surface (Fungaro & Izidoro, Reference Fungaro and Izidoro2006).
Adsorption kinetics for Argel-Fe/dyes and Volclay-Fe/dyes.

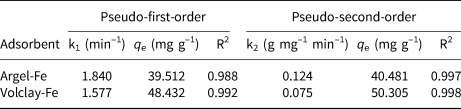
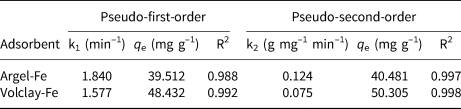
The kinetic parameters of dye adsorption are shown in Table 4. From comparison of the R2 values, the model that best fitted the experimental data was the pseudo-second-order wave model for both adsorbents. Moreover, this kinetic model was reported to fit better the adsorption kinetics of a multi-solute system in organobentonite (Shen et al., Reference Shen, Fan, Zhou, Gao, Yue and Kang2009), the removal of Brilliant Blue FCF from aqueous solutions using an unmodified and iron-modified bentonite (Hernández-Hernández et al., Reference Hernández-Hernández, Solache-Ríos and Díaz-Nava2013) and the removal of tartrazine in organobentonites (Sahnoun & Boutahala, Reference Sahnoun and Boutahala2018). The values of q e calculated using the two kinetic models were close to the experimental q e values of 40.42 mg g–1 for Argel-Fe and 49.3 mg g–1 for Volclay-Fe.
Kinetic parameters for adsorption of the dye mixture to the modified clays.
The equilibrium isotherms for the Argel-Fe/dye and Volclay-Fe/dye systems were plotted using the Langmuir, Freundlich and LF models (Fig. 8). The curves are typical of Class L4 equilibrium isotherms, suggesting the formation of a monolayer on the surface; the adsorbate had difficulty finding empty sites as sites were filled. The formation of a new plateau in the isotherm suggested the development of a new surface on which adsorption might occur (i.e. the curve contained different regions favourable to adsorption). The absence of a defined threshold in the isotherms indicated that saturation was not reached within the studied concentration range (Giles et al., Reference Giles, Smith and Huitson1974).
Adsorption isotherms for (a) Argel-Fe/dyes and (b) Volclay-Fe/dyes adjusted by the Langmuir, Freundlich and Langmuir–Freundlich models. RMSE: root mean square error.

According to the adjustment parameters of the isothermal models (Table 5), the LF model best described the adsorption of the dye mixture to the modified clays, as the coefficient of determination (R2) was greater than those of the remaining models and the root mean square error (RMSE) was closer to zero. The LF model provided n values >1, which indicated that the adsorption process was favourable and should occur on a homogeneous surface. The maximum adsorption capacities of Argel-Fe and Volclay-Fe were 88.68 and 392.21 mg g–1, respectively. The isotherms did not plateau, suggesting that the experimental data had not yet reached a saturation value. The LF model predicted adsorption beyond the experimental data before the q e values would reach a constant plateau, explaining the fact that the maximum adsorption capacity values quoted were greater than the q e data obtained. Values of n F <1 also indicate homogeneity of the surface of the adsorbent. Regarding the Langmuir model, the sorption or affinity energy constant, KL, was <1 for the two adsorbents, indicating that there was an affinity between the dyes and the Fe-clays.
Langmuir, Freundlich and LF parameters of dye mixture removal by Argel-Fe and Volclay-Fe.

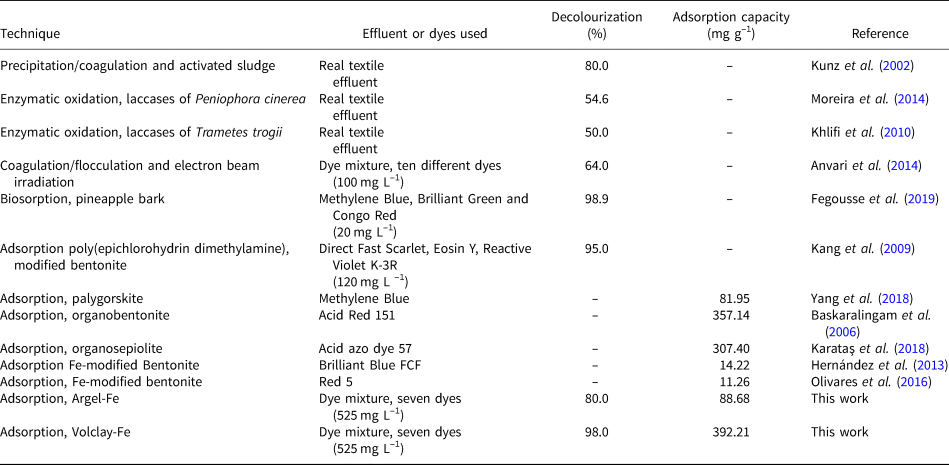
Table 6 shows the discolouration capacities (%) of various methods for the discolouration of real and synthetic effluents. The discolouration efficiency of Argel-Fe was similar to those of the combined precipitation/coagulation and activated sludge techniques. The adsorption to Argel-Fe was also superior to those of other reported techniques. The adsorption to Volclay-Fe was superior to those of many other techniques for both real textile effluents and dye mixtures, considering the initial concentration of the mixture.
Comparison of the performance of several effluent and dye discolouration methods.
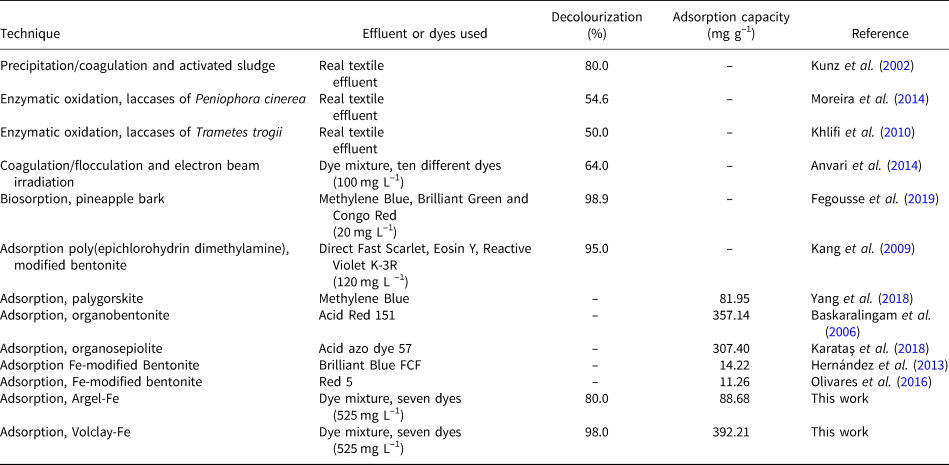
The Fe-clays used in this study even had greater adsorption capacities than similar adsorbents used in single-dye adsorption (Table 6). Although several studies demonstrate the removal of dyes, their application in real effluents is limited because most of them refer to isolated dyes; this is a condition that may impede the accurate calculation of the discolouration efficiency of real effluents, which usually contain a mixture of dyes.
Adsorption mechanism
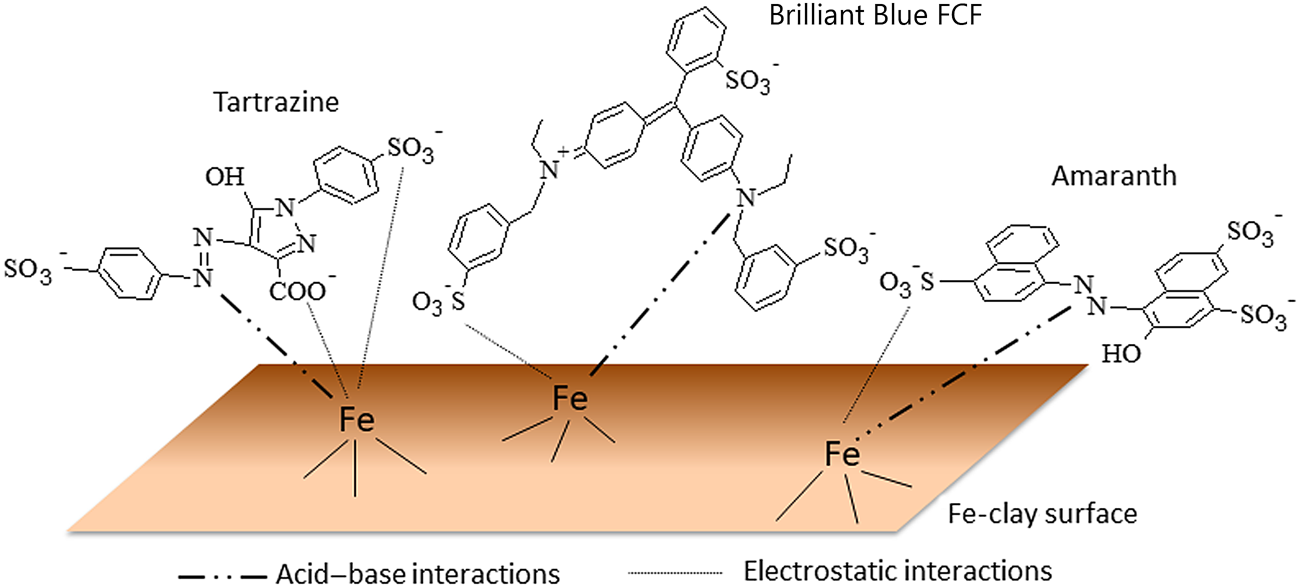
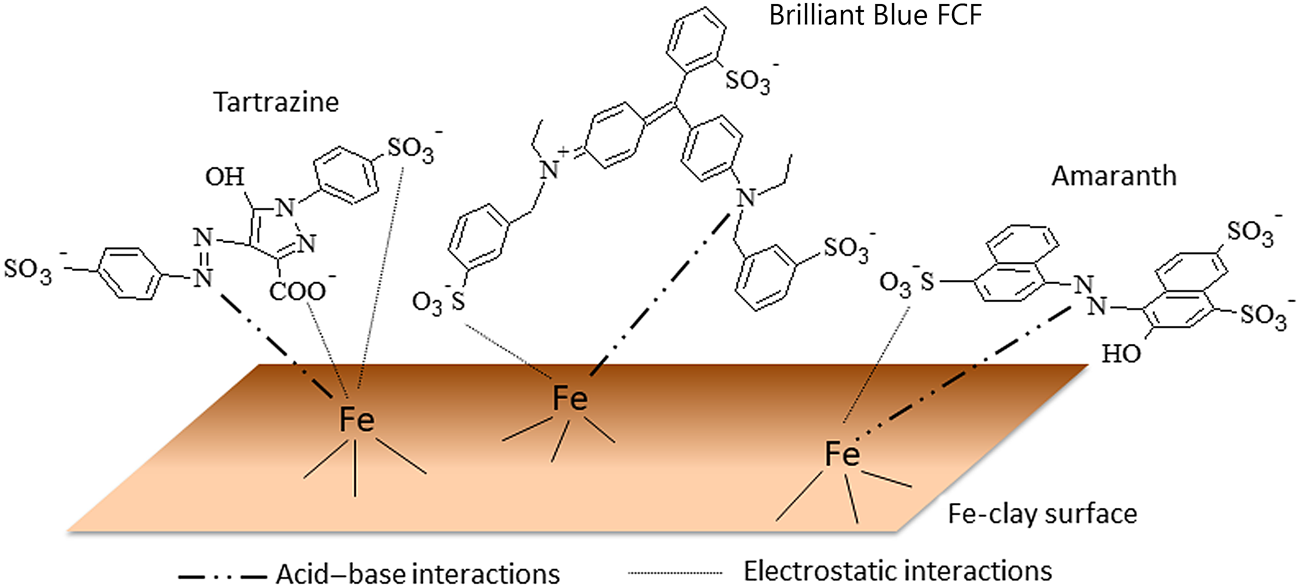
The dyes used in this study have several electron-acceptor groups with various pKa values (sulfonic group pKa = 2.0, carboxylate group pKa = 5.0, azo group pKa = 10.86). According to the first pKa value of the investigated dyes, the molecules were in their anionic form and the surface of the modified clays was positively charged at pH 3.0, as the pHPIE values of Argel-Fe and Volclay-Fe were 5.8 and 7.3, respectively. Thus, the mechanism of adsorption of anionic dyes to smectite clays enriched with Fe(III) may be described by electrostatic attraction between the positive sites on the surface of the modified clays and the sulfonic group (SO3–) in the anionic molecules of the dyes, as well as a strong Lewis acid–base interaction between the acid sites of the adsorbents (Fe) and the free electron pairs of the nitrogen atoms (amine groups and azo groups) in the dyes (Fig. 9).
Schematic diagram of the interaction of tartrazine, Brilliant Blue FCF and amaranth dye molecules on the surface of Fe-clays.
Conclusions
The low adsorption efficiency of natural clays may be overcome by the intercalation of Fe(III) in their interlamellar spaces, converting the surface charge from negative to positive. XRD and FTIR characterization confirmed that the crystal structure of the clays was preserved after sorption and modification with Fe(III). The saturation of clays with Fe(III) was confirmed by XRF and ζ-potential measurements. The pseudo-second-order kinetic model fits the experimental data best. The adsorption equilibrium was reached in ~5 min. The shape of the kinetic curve up to saturation suggested a monolayer coating of the dye molecules on the outer surface of the adsorbents. The behaviour of the isotherms was successfully modelled by the LF double model, according to which the maximum adsorption capacities of Argel-Fe and Volclay-Fe were 88.68 and 392.21 mg g–1, respectively. The adsorption of dyes on the Fe-clays is attributed to the electrostatic attraction between the anionic group (SO3–) of the dye and the positively charged adsorption sites on the surface of the enriched adsorbents, as well as the Lewis acid–base interaction between the Fe(III) and the free electron pairs in the dye. The rate of discolouration and separation of phases after adsorption are extremely favourable factors for the potential use of these adsorbents in the economical treatment of effluents. In addition, because the pH of natural wastewater is in the range of 6–9, pH adjustment is unnecessary for the removal of dyes.
Supplementary material
Available at https://doi.org/10.1180/clm.2020.6. Flowchart of the enrichment of clay minerals (Fig. S1); graph of the calibration curve of the dye mixture (Fig. S2); image of natural clays, modified clays and modified clays after sorption (Fig. S3); MP4 video file of the adsorption of the dye mixture to the modified and unmodified clays where the efficiency and speed of colour removal can be seen, followed by the rapid decantation of the adsorbent. The video has been sped up 4× to a final duration of 1 min.
Acknowledgements
I.A. Rodrigues thanks the Instituto Federal Catarinense (IFC), Campus Fraiburgo. This manuscript is a tribute to Professor Henrique Eisi Toma on his 70th birthday.
Financial support
The authors thank the following agencies: CNPq (310041/2016-3 and 427127/2018-1), Capes, Finep and Fundação Araucária (001/2016 – CPBA/PROPESP).