The search for physiological correlates of human intelligence dates late 19th century, when Galton (Reference Galton1883) attempted to connect sensory discrimination and reaction time with what he termed “general ability”. Galton’s hypothesis has later been confirmed by findings that intelligence correlates with sensory discrimination speed (inspection time; Nettelbeck & Lally, Reference Nettlebeck and Lally1976), and, generally, with processing/neuronal speed (Jensen, Reference Jensen1998; Sheppard & Vernon, Reference Sheppard and Vernon2008). Throughout the last 130 years researchers have identified other neurobiological predictors of general (g) and general fluid (Gf) intelligence. For instance, when solving majority of cognitive tasks, brains of more intelligent people are more efficient, as indexed by their weaker neural activation (e.g., blood oxygenation level dependent; BOLD), compared to less intelligent people. At the same time, the former brains show relatively larger activation when a task is especially difficult, or its computational characteristics demand so (Neubauer & Fink, Reference Neubauer and Fink2009). The increased speed/efficiency of more intelligent brains is most likely related to a larger amount of gray matter (neurons) in such brains (Colom et al., Reference Colom, Haier, Head, Alvarez-Linera, Quiroga, Shih and Jung2009), especially in the frontal and parietal lobes (Jung & Haier, Reference Jung and Haier2007). Also white matter (neural tracks, myelination) counts, enabling intelligent brains to achieve more extensive connectivity between the crucial neural structures (Cole, Yarkoni, Repovs, Anticevic, & Braver, Reference Cole, Yarkoni, Repovs, Anticevic and Braver2012).
Unfortunately, the known physiological factors usually explain less than 25% of the variance in intelligence (Ludders, Narr, Thompson, & Toga, 2010; Pietschnig, Penke, Wicherts, Zeiler, & Voracek, Reference Pietschnig, Penke, Wicherts, Zeiler and Voracek2015), with rare exceptions ranging 50% (Othani et al., Reference Othani, Nestor, Bouix, Saito, Hosokawa and Kubicki2014), whereas some cognitive predictors of g and Gf, notably short-term memory (STM) and working memory (WM) capacity, are able to explain at least 75% (Chuderski, Reference Chuderski2013; Oberauer, Schulze, Wilhelm, & Süß, Reference Oberauer, Schultze, Wilhelm and Süß2005). This discrepancy results from the fact that, on one hand, structural indices like gray or white matter volume only inform us about a potential advantage of some brains over others (a brain rich in gray/white matter may anyway show other deficits or may cope with Gf tests with a weak strategy). On the other hand, functional data like BOLD give us only an averaged picture of processes carried out in particular brain regions, usually reflecting both Gf-related and Gf-unrelated neuronal activity (in part, due to poor temporal resolution of BOLD). Also, a precise interpretation of functional data in context of the process models of WM and Gf (i.e., how exactly neural activity affects reasoning processes) is extremely difficult.
The aim of this paper is to review still scarce but potentially very important research on the cross-frequency coupling of neuronal oscillations – a physiological factor that only recently have been investigated in the context of individual differences in ability. Coupling seems to yield relatively strong correlations with WM capacity. Moreover, its link with WM can be interpreted theoretically in a plausible way (including computational modeling). Thus, the cross-frequency coupling may be a level of description that best integrates neurobiological and cognitive explanations of intelligence.
Although the review focuses on the cross-frequency coupling, it has to be noted that the within-frequency synchronization has also been studied in context of cognitive ability (e.g., Keizer, Verschoor, Verment, & Hommel, 2009; Palva, Monto, Kulashekhar, & Palva, Reference Palva, Monto, Kulashekhar and Palva2010; Stankov et al., Reference Stankov, Danthiir, Williams, Pallier, Roberts and Gordon2006), with some positive evidence about their relationship. However, most of such studies did not exclude a possibility that the synchronization of high frequency oscillations (for which the link with Gf/g has been found) might result from their coupling to some lower frequency band. In consequence, a proper theoretical interpretation of such studies may be difficult.
Neuronal oscillations and their cross-frequency coupling
Due to its high temporal resolution, electroencephalography allows for observing neuronal oscillations on the scalp (EEG), as well as directly on/in the cortex (iEEG). Neuronal oscillations reflected in EEG signal are believed to result from rhythmic, synchronized post-synaptic potentials of large populations of pyramidal neurons located in both gyri and sulci of the neocortex (Buzsáki, Reference Buzsáki2006). Similar neuronal oscillations (but primarily originating from sulci) can also be measured on the scalp by means of magnetoencephalography (MEG). However, due to large costs of the MEG equipment, compared to EEG, the MEG-based literature is much more scanty.
A typical EEG signal at first sight looks chaotic (except for data from epileptic seizures and deep sleep). The Fourier transform (or an analogous method) decomposes it into a number of periodic components defined for consecutive frequencies. For each momentary value of a given component, its amplitude (the difference in microvolts relative to a given trough) and phase (the temporal shift relative to the closest peak/trough) can be calculated.
Neuronal oscillations in certain frequency bands (waves) play different roles in physiology and cognition. The delta band encompasses slow rhythms from about 1 (20) Hz up to 4 Hz (though slower rhythms than 1 Hz can also be detected; Hiltunen et al., Reference Hiltunen, Kantola, Elseoud, Lepola, Suominen, Starck and Palva2014). Originally, its role was linked to deep sleep, but recently its function in the long-range coordination of neural processing has been found (Leszczyński, Fell, & Axmacher, Reference Leszczyński, Fell and Axmacher2015). The theta band rhythms ranging from 4 (22) to 7–8 Hz (Colgin, Reference Colgin2013) are present in shallow sleep and meditative states. Studies also showed the role of hippocampal theta in coordinating memory encoding (Sederberg, Kahana, Howard, Donner, & Madsen, Reference Sederberg, Kahana, Howard, Donner and Madsen2003) and maintenance (Axmacher et al., Reference Axmacher, Henseler, Jensen, Weinreich, Elger and Fell2010), as well as the role of cortical theta in the long-range coordination of cognition (e.g., Cohen, Reference Cohen2014; Sauseng, Griesmayr, Freunberger, & Klimesch, Reference Sauseng, Griesmayr, Freunberger and Klimesch2010). The alpha band, between 8 (23) and 15 Hz (Başar, Reference Başar2012), originally linked with relaxation and rest, was also connected with inhibition in perception and memory (Roux & Uhlhass, Reference Roux and Uhlhaas2014; Sauseng et al., Reference Sauseng, Klimesch, Heise, Gruber, Holz, Karim and Hummel2009), as well as with motor inhibition (the mu wave found in the motor cortex; Arroyo et al., Reference Arroyo, Lesser, Gordon, Uematsu, Jackson and Webber1993). The beta band, between 16 (24) and 30 Hz, originally related to awareness, also underpins various functions of attention, primarily realized by causing neurons oscillating in the beta rhythm to be more susceptible to stimulation (Buschman & Miller, Reference Buschman and Miller2007; Egner & Gruzelier, Reference Egner and Gruzelier2004).
Unlike the delta, theta, and beta oscillations, generated by specific brain structures and projected at long distances, the gamma oscillations ranging from 32 (25) up to about 100 Hz arise locally from negative feedbacks between the pyramidal neurons and GABAergic interneurons (Fries, Nikolić, & Singer, Reference Fries, Nikolić and Singer2007). The gamma band is the brain’s workhorse, representing specific patterns of information and carrying out various computations (Jensen, Kaiser, & Lachaux, Reference Jensen, Kaiser and Lachaux2007). The role of the high gamma band (100 – 250 Hz), the fastest synchronized activity found in mammalian brain, is less well understood. For instance, synchronized ultrafast neural spiking (ripples) was linked to transfer of memories from the hippocampus to the neocortex for permanent storage (Buzsáki, Reference Buzsáki2010).
The power spectrum of oscillatory bands approximates the 1/f curve, with power (i.e., the squared average amplitude) decreasing with increasing frequency f. One exception is the alpha band, whose power usually exceeds the power of the theta band.
The cross-frequency coupling between neuronal oscillations is observed when one or more properties of the slow wave modulate(s) one or more properties of the fast wave (Jensen & Colgin, Reference Jensen and Colgin2007). Such a coupling may underlie many functions (Canolty & Knight, Reference Canolty and Knight2010). For example, it may synchronize perceptual inputs in service of a planned action (Shroeder, Wilson, Radman, Sharfman, & Lakatos, Reference Schroeder, Wilson, Radman, Scharfman and Lakatos2010) by using the phase of the slow wave for resetting the fast wave (Voloh & Womelsdorf, Reference Voloh and Womelsdorf2016). Crucially, the temporal dimension gives an unparalleled possibility to represent and process multiple pieces of information rapidly, continuously, and simultaneously (Cohen, Reference Cohen2011), and slow waves can be used by specific control structures to directly coordinate, synchronize, and inhibit processes of perception and attention (Jensen, Bonnefond, & VanRullen, Reference Jensen, Bonnefond and VanRullen2012), learning (Tort, Komorowski, Manns, Kopell, & Eichenbaum, Reference Tort, Komorowski, Manns, Kopell and Eichenbaum2009), and memory (Lisman & Jensen, Reference Lisman and Jensen2013).
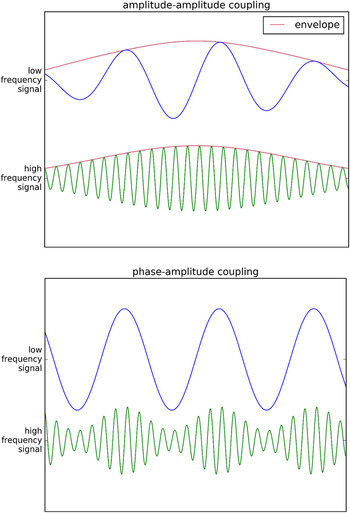
Although various combinations of the coupled properties are possible (e.g., phase to phase, phase to frequency), the two specific combinations – amplitude to amplitude as well as amplitude to phase – have been investigated most broadly. This review focuses on those two types of coupling. In the amplitude-amplitude coupling, the slow wave amplitude modulates the fast wave amplitude. As both waves oscillate with different frequencies, usually the coupling is defined for their envelopes. Envelope, simplifying things a little bit, consists of the line linking the consecutive peaks of a wave. It can be computed by means of the Hilbert transform. The strength of the amplitude-amplitude coupling can be expressed most simply as the correlation coefficient between the envelopes. The coefficient equaling one reflects the perfect synchronization of dynamics of the slow and fast wave envelope, while the coefficient leveling minus one indicates their perfect desynchronization. The coefficient equal to zero means that the envelope dynamics of both waves are mutually unrelated.
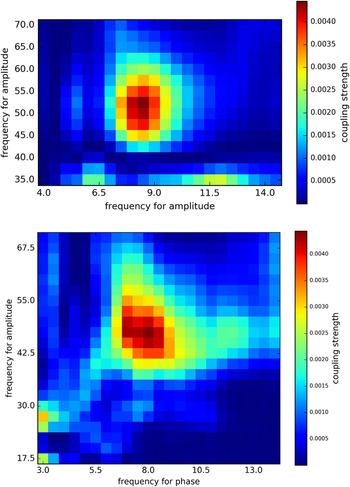
In the phase-amplitude coupling, the slow wave phase modulates the fast wave envelope. Calculating the strength of such a coupling is more complicated than in the case of amplitude-amplitude coupling, and various circular statistics are used in this regard (for their comparison see Onslow, Bogacz, & Jones, Reference Onslow, Bogacz and Jones2011). Figure 1 provides schematic examples of the synchronization of the fast wave to the slow wave envelope as well as to its phase. Figure 2 presents examples of matrices used to depict the coupling strength as a function of the slow and the fast wave frequency.
Top: Schematic illustration of the coupling between the amplitude (envelope) of low frequency (slow) oscillations and the amplitude (envelope) of high frequency (fast) oscillations.
Bottom: Schematic illustration of the coupling between the phase of low frequency (slow) oscillations and the amplitude of high frequency (fast) oscillations.

Top: A chart presenting the strength of amplitude-amplitude coupling as a function of frequency. The strongest coupling exists between the amplitude of low frequency (slow) oscillations at 8.5 Hz and the amplitude of high frequency (fast) oscillations at 53 Hz.
Bottom: An analogous chart presenting the strength of phase-amplitude coupling. The strongest coupling exists between the phase of low frequency (slow) oscillations at 8 Hz and the amplitude of high frequency (fast) oscillations at 47.5 Hz.

Oscillatory models of working memory and reasoning
An idea that specific patterns of oscillations can encode and process information has been proposed, among others, by von der Malsburg (Reference von der Malsburg1981). It was soon confirmed by several animal studies. For instance, now the famous iEEG study of the rat brain (O’Keefe & Recce, Reference O’Keefe and Recce1993) showed that as a rat approached food, it used the subsequent firing of distinct neurons in the hippocampus to encode the consecutive steps on its route. Such a spiking was synchronized with the rat’s theta rhythm, which most probably bound different steps on a route into its complete representation. A current position of the rat was represented by the first spike within the theta cycle. Another study (Siegel, Warden, & Miller, Reference Siegel, Warden and Miller2009) showed that a monkey was able to remember two pictures in the correct order only if the sequential spiking pattern was present in its frontal cortex, and the order of spikes matched the order of presentation of the corresponding pictures. Inspired by these findings, several oscillatory models of WM, usually expressed in a mathematical/computational form, have been proposed.
In their seminal model of STM, Lisman and Idiart (1995; for a more biologically realistic version see Koene & Hasselmo, Reference Koene and Hasselmo2007) suggested that lists of items in STM are encoded analogously as rats encode consecutive locations – by a sequence of mutually asynchronous gamma cycles. Mutual asynchrony was imposed by a global inhibitory signal, which forced each gamma cycle, representing one particular item, to peak in the phase of the theta cycle that was distinct from the peaks of all other gamma cycles. Thus, theta cycle bound all gamma cycles (all items) into one list. In order the memory maintenance to be successful, the same sequence of gamma cycles had to be repeated until retrieval. However, the gamma cycles bound into a sequence did not peak throughout the entire theta cycle, but occurred only in the duty intervals, separated by the idle intervals. The latter served to prevent overlap between the consecutive sequences (Jensen & Lisman, Reference Jensen and Lisman1998).
According to Lisman and Idiart, the maximum capacity of STM is determined by the theta-to-gamma cycle length ratio (or the gamma-to-theta frequency ratio), as no more items (gamma cycles) will fit into a list (theta cycle). As a typical theta frequency is ∼6 Hz, and a typical gamma oscillation is ∼40 Hz, the model predicted STM capacity of about 7 items – a value commonly reported by studies on human immediate verbal recall (for a review see Gignac, Reference Gignac2015). The model also predicts several specific effects pertaining to STM, like longer times of target recognition with longer lists, and the primacy effect (Jensen & Lisman, Reference Jensen and Lisman1998; note that the model did not replicate the recency effect that is even more prevalent in STM). The model suggested that increases in STM capacity result primarily from increases in the theta cycle length, but not from the shortening of the gamma cycle).
However, the STM/WM capacity limit in the Lisman and Idiart model is somewhat arbitrary: In the brain, the theta frequency can be as low as 4 Hz, while the gamma oscillations can approach 100 Hz, but we do not find people showing STM capacity that approaches 25 (i.e., 100/4) items. Moreover, real STM/WM capacity is in fact closer to 4 items instead of 7, as evidenced by tasks that prevent rehearsal of verbal material (Cowan, Reference Cowan2001), and by spatial/visual tasks (Vogel, Woodman, & Luck, Reference Vogel, Woodman and Luck2001). Another model, proposed by Horn and Usher (Reference Horn and Usher1991; Reference Horn, Usher, Moody, Hanson and Lippmann1992), attempted to explain why the brain is intrinsically unable to maintain more than 4–5 gamma oscillations out of phase. In this model, STM maintenance was described in terms of the continuous interaction between the self-activation of a particular item on a list, and the lateral inhibition imposed by all of the remaining items. Inhibition made the elements oscillate in separate cycles (there was no need for an external inhibitor as in the Lisman and Idiart model), but it also limited the model to hold only 5 separate items in parallel (Usher, Cohen, Haarman, & Horn, Reference Usher, Cohen, Haarmann and Horn2001). When inhibition was released, and more items was added to WM, oscillations started to overlap, and the items’ distinctiveness was lost.
Analogous idea of limited STM/WM capacity due to inherent inhibition present in oscillatory mechanisms has been proposed by Vogel et al. (Reference Vogel, Woodman and Luck2001), by Raffone and Wolters (Reference Raffone and Wolters2001), and, more recently, by Chuderski, Andrelczyk, and Smoleń (Reference Chuderski, Andrelczyk and Smoleń2013). Crucially, these models also explained how separate objects in a list may be encoded. They assumed that the main function of oscillations was to bind together the distinct features of an object into that object (i.e., no single neuron/neuronal group encoded the whole object). Features of the same item fired in synchrony, whereas two features of different objects were active out of phase. Due to this mechanism, the models were able to reconstruct an object from its synchronized features. However, the more objects were maintained, the higher was a chance that features of two objects would be spuriously synchronized, and the target object would not be retrieved correctly from STM/WM. At the same time, the number of features for each object minimally affected the chance of spurious synchronizations. These models are supported by findings that available WM capacity, strongly limited in terms of maintained objects, is negligibly (Vogel et al., Reference Vogel, Woodman and Luck2001) or, at most, very weakly affected by the number of features per object (Cowan, Blume, & Saults, Reference Cowan, Blume and Saults2013).
The idea that elements of one representation are bound synchronously, whereas distinct representations oscillate out of synchrony, is particularly important for the modeling of reasoning. Recent theories define deductive and inductive reasoning as the processing of relations (Halford, Andrews, & Wilson, Reference Halford, Andrews, Wilson, Feeney and Thompson2014; Holyoak, Reference Holyoak, Holyoak and Morrison2012; Johnson-Laird, Reference Johnson-Laird2006). In order to process a relation (e.g., “Tom gave a cat to Ann”) it is crucial to represent its variables (relational roles) separately (“a giver”, “a gift”, and “a beneficiary”), but to bind each variable and its proper value (filler) together (“Tom” to “a giver”, “cat” to “a gift”, “Anna” to “a beneficiary”), in order to preserve the meaning of a relation (not to end up with “Tom gave Ann to a cat”). Since 90-ties, several rule-based, or symbolic, models of reasoning have been proposed that were based on individually-varying capacity of WM (e.g., Carpenter, Just, & Shell, Reference Carpenter, Just and Shell1990; Salvucci & Anderson, Reference Salvucci and Anderson2001). However, these models did not pertain to any specific neuronal mechanisms. For neuropsychologically plausible models of reasoning, the oscillatory mechanism which are able to (de)synchronize representations seem to be the optimal solution (see Doumas & Hummel, Reference Doumas, Hummel, Holyoak and Morrison2005; Shastri & Ajjanagadde, Reference Shastri and Ajjanagadde1993).
The hallmark oscillatory model of reasoning is the LISA model of analogy-making (Hummel & Holyoak, Reference Hummel and Holyoak1997; Reference Hummel and Holyoak2003). The crucial mechanism in LISA consists of mapping the relations and their arguments, found in a novel situation (the target), onto the system of relations present in a more familiar situation (the source), by means of discovering the structural and semantic correspondences between the two situations. If the mapping is successful, some relations and arguments known in the source (but not revealed in the target) can be transferred to the target, yielding correct inductive inferences. LISA’s most important feature is that relations and their arguments have to be represented in its WM, which is limited to several role-filler pairs. More complex relations must be divided into smaller fragments fitting WM (the construction of mappings is gradual). In LISA, each role of a relation is a separate (i.e., out of phase) oscillation in WM, and each filler is bound in phase to a role it plays. In contrast, the relation’s predicate oscillates for the total time of oscillation of all its role-filler pairs, binding them into the complete relation. The relation cycle corresponds to the theta cycle, while the cycles for particular role-filler pairs reflect gamma oscillations (Knowlton, Morrison, Hummel, & Holyoak, Reference Knowlton, Morrison, Hummel and Holyoak2012). With more capacious WM, LISA is able to process more complex analogies. Unfortunately, LISA has never been used for quantitative simulations of the links between the characteristics of its oscillations and the individual differences in reasoning performance.
In order to demonstrate that individual differences in analogical reasoning ability, observed in a sample of 100 young adults, can be explained by a variation of the number of gamma cycles fitted in one theta cycle, Chuderski and Andrelczyk (Reference Chuderski and Andrelczyk2015) have developed the oscillatory model of a figural analogy test, which required discovering a number of geometric transformations that related two patterns, each consisting of several shapes. Then, the model had to apply these transformations to another pattern of shapes, in order to select one solution, which correctly matched the pattern, out of seven response options. Crucially, incorrect options differed in distance to the correct solution. They might include all transformations but one (were “almost” correct), just one transformation (resembled the target pattern), or random ones. Using dedicated rules, the model was able to discover which transformations were applied to which shapes in the original pair of patterns, and tried to add to its WM the information about each shape as a separate binding of oscillating elements representing this shape and its transformations.
The absolute limit of WM capacity, at the optimal level of lateral inhibition among WM items, was less than 6 items (6 asynchronous oscillations). Such a capacity allowed the model to represent all of transformations for even the most complex test items. With increasing WM load, the total amount of inhibition increased in WM, and each oscillation became faster (a corresponding gamma cycle shrank). The reoccurrence of the same oscillation (i.e., after all other oscillations had occurred) was interpreted as the beginning of another theta cycle. Such a cycle lengthened only minimally with a larger load. Thus, a larger load increased the theta-to-gamma cycle length ratio as in the Lisman and Idiart (Reference Lisman and Idiart1995), but due to a different reason (due to a decrease in the gamma cycle length instead of an increase in the theta cycle length).
Importantly, in order to reflect the inter-individual differences in WM capacity, 100 variants of the model were generated, and for each variant the inhibition parameter was randomly picked from the normal distribution, ranging from the optimal to the completely non-optimal values of the parameter. In result, for the medium-capacity variants of the model it was difficult to hold all transformations in WM, while for the low-capacity variants it was barely possible. However, due to the intra-individual variance in WM capacity, resulting from noise present in the model, and because of the fact that at the limits of absolute capacity the oscillations were easily losing stability, even the large-capacity variants could miss some of the transformations.
After encoding transformations in WM, the model matched its WM contents to each response option, in order to check whether the same bindings of features related this option and the target pattern. If the complete mapping between the WM contents and feature transformations in an option could be established, then the model identified this option as the correct one. If some transformations were lost from WM, then the model might not be able to make a univocal mapping between its WM and the correct option. For instance, if one feature transformation was lost from WM, which was also the one missing from an almost correct option, then this option could be chosen as correct. If more features were lost, then the model might choose the one-transformation option, or even might have to randomly choose from all options.
Model simulations allowed to link behavioral results to characteristics of the underlying oscillations. First, the qualitative pattern of model behavior closely fitted human data: both model and humans committed similar proportion of errors (64% vs. 63%, respectively), and more frequently were choosing the almost correct options (40%) than the one-transformation options (14%) and the random options (10%). However, only the two latter options, but not the former one, were more frequently selected by less capacious model variants and people, comparing to more capacious variants and people. This fact indicated that selecting the almost correct options required comparable capacity as did responding correctly, so with decreasing WM both the model and people tended to select obviously incorrect options. All these results suggested that the model reflected human reasoning in a plausible way. Most importantly, the theta-to-gamma cycle ratio (primarily, the gamma frequency), recorded in the model variants, strongly predicted their accuracy on the analogy test, similarly as did WM capacity in human participants (screened with an STM task) predicted their reasoning scores. So, the Chuderski and Andrelczyk (Reference Chuderski and Andrelczyk2015) model was the first demonstration that the enhanced coupling of the gamma and theta bands, resulting in maximizing the number of gamma oscillations in one theta cycle, might be related to top performance on Gf tests.
Finally, Rasmussen and Eliasmith (Reference Rasmussen and Eliasmith2014), using the Spaun neurocognitive architecture (Eliasmith, Reference Eliasmith2013), have proposed the model of the Raven test reasoning that was based on a large population of spiking realistic neurons, instead of abstract oscillating elements present in all above mentioned models. However, the accuracy of the model in the Raven and in another Gf test (figural analogies) depended primarily on the total number of neurons in the model (e.g., the aging effects on Gf were related to the proportion of neurons lost), so although the model displays a high level of biological plausibility, it does not seem to directly pertain to research on neural oscillations and Gf.
The relationship of neuronal oscillations coupling to working memory and intelligence
Existing evidence on the role of cross-frequency coupling of neural oscillations for human WM and Gf consists of two lines of research. Some studies administered the iEEG technique using simple STM tasks. Although intracranial measurement is a necessary means for understanding fine-grained neurobiological processes underlying WM, the nature of participants (epileptic patients examined during surgery) highly limits generalization of such findings onto the general population. Other studies administered EEG on healthy people performing more complex WM (and Gf) tasks.
In their seminal iEEG study on the theta/gamma coupling in 5 epileptic patients, Canolty et al. (Reference Canolty, Edwards, Dalal, Soltani, Nagarajan and Knight2006) demonstrated that the high gamma amplitude was strongly coupled to the phase of the theta wave. The coupling was broadly spread over the cortex, instead of being located in a particular region. Most importantly, the strength of the theta/gamma coupling was sensitive to cognitive load, as this strength increased during the demanding WM and attention tasks, in comparison to the control conditions. Specifically, the coupling consisted of more gamma amplitude detected during troughs than during peaks of the theta wave. Another iEEG study (Rizutto, Madsen, Bromfield, Schulze-Bonhage, & Kahana, Reference Rizzuto, Madsen, Bromfield, Schulze-Bonhage and Kahana2006) suggested that theta troughs and peaks may have different functional roles: WM encoding occurred during troughs, while WM retrieval was observed during peaks. Further research indicated that the theta/gamma coupling was related specifically to WM requirements, and not to general attentional processing (Park, Jhung, Lee, & An, Reference Park, Jhung, Lee and An2013).
Axmacher et al. (Reference Axmacher, Henseler, Jensen, Weinreich, Elger and Fell2010), using iEEG, examined 14 epileptic patients who performed a face memory task, with 1, 2, or 4 items being presented. The authors found the phase-amplitude coupling between the theta and the gamma bands. The specific theta frequency that modulated the gamma band decreased from ∼7.5 to ∼6.5 Hz with the load increasing from 1 to 4 items, in line with Lisman and Idiart’s (Reference Lisman and Idiart1995) predictions (for a corresponding result pertaining to an increase of the interval of high theta amplitude with WM load see Raghavachari et al., Reference Raghavachari, Kahana, Rizzuto, Caplan, Kirschen, Bourgeois and Lisman2001). However, as also the modulated gamma frequency decreased from ∼30 to ∼25 Hz, the ratio (∼4) of both frequencies remained constant, in contrast to Lisman and Idiart’s predictions. Axmacher et al., did not find any particularly interesting relationships between individual WM performance and oscillatory patterns. They only reported that faster participants displayed a narrower range of the theta band that modulated the gamma band (suggesting an improved precision of coupling), but only at load 1.
In two iEEG experiments, one testing 9 subjects with a digit WM task, and another – 8 with a face WM task, Leszczyński et al. (Reference Leszczyński, Fell and Axmacher2015) found that the strength of coupling between the theta (5–9 Hz) phase and the gamma (30–150 Hz) amplitude significantly fluctuates along with the amplitude of the alpha band. The coupling was strongest when the alpha power was high, suggesting that in such cases alpha inhibited the gamma frequency, and gamma oscillations were only present within a narrow range of the theta cycle, and thus the correlation between this cycle’s phase and the gamma amplitude was strong. For the low alpha power, the phase-amplitude coupling weakened, indicating a more equal spacing of gamma oscillations within the theta cycle. Moreover, the alpha power fluctuations were driven by the delta oscillations at around 2 Hz. Thus, every 500 ms the delta band made WM to switch between a maintenance interval (more gamma cycles spread over one theta cycle) and a non-maintenance interval (few gamma cycles bound to one theta cycle). Leszczyński et al. hypothesized that the latter interval might serve as a memory updating stage, with the current WM contents being “frozen” for about 100–200 ms in order to allow incoming information to be added to WM. Thus, Leszczyński et al. showed the hierarchical organization of WM oscillatory mechanisms, with the theta-gamma coupling underlying maintenance, and the delta-alpha coupling underpinning switching between alternative WM modes, via affecting the theta-gamma coupling (note that only hippocampal mechanisms were investigated).
This very finding helped Leszczynski et al. to precisely examine the relationship between oscillatory characteristics of WM and its capacity (as tapped by the digit and face tasks). In line with the Chuderski and Andrelczyk model (but in contrast to the Lisman and Idiart model) they found that only the modulated gamma frequency, which was identified as the one whose coupling with the theta phase was most strongly affected during the intervals of decreased alpha power, predicted WM capacity (Kendall’s τ ∼ .60). This relationship persisted only during the maintenance intervals, but disappeared during the non-maintenance intervals (τ < .2). There was no significant relationship between WM capacity and the theta frequency nor the gamma-to-theta frequency ratio.
Another iEEG study of two epileptic patients (Voytek et al., Reference Voytek, Canolty, Shestyuk, Crone, Parvizi and Knoght2010) brought evidence showing that the gamma oscillations during WM maintenance were coupled to the alpha band (alpha phase) when visual material had to be memorized. Also, the location of coupling changed from the frontal/temporal to parietal/occipital lobes, between the verbal/sequential and visual/spatial task (for evidence of the same effect pertaining to the theta and alpha power see Hsieh, Ekstrom, & Ranganath, Reference Hsieh, Ekstrom and Ranganath2011; Roberts, Hsieh, & Ranganath, Reference Roberts, Hsieh and Ranganath2013). Roux and Uhlhaas (Reference Roux and Uhlhaas2014) hypothesized that the above mentioned difference between average capacity in the former (∼7 items) and the latter tasks (∼4 items) is a direct consequence of the theta cycle being longer than the alpha cycle.
Evidence for a crucial role of cross-frequency coupling in WM was also reported from scalp EEG. For example, in a sample of 16 healthy young adults, Sauseng et al. (Reference Sauseng, Klimesch, Heise, Gruber, Holz, Karim and Hummel2009) found a stronger gamma coupling to the theta phase in the hemisphere contralateral to the location of task-relevant visual stimuli, while task-irrelevant stimuli were shown at the opposite side. A difference in coupling strength between the contra- and ipsilateral hemisphere served as the index of maintenance-related coupling. Sauseng et al. showed that this index increased with increasing memory load (from 1 to 4 items), but again decreased when the load surpassed the maximum WM capacity of participants (i.e., when 6 items were presented), and maintenance became distorted. Moreover, the increase in the index predicted performance on the WM task (r = .53). In another experiment, Sauseng et al. found that the power of alpha band in a hemisphere contralateral to the task-irrelevant stimuli increased with the number of such stimuli, and the magnitude of an increase was a substantial predictor of WM capacity. Also, Sauseng et al. (Reference Sauseng, Klimesch, Heise, Gruber, Holz, Karim and Hummel2009) stimulated their participants with repetitive transcranial magnetic stimulation (rTMS) at 10 Hz, supposed to enhance rejection of the distractors in the visual WM task, and indeed observed significantly improved performance on that task. Thus, the study suggested that, besides the modulatory role for the gamma band (as in Voytek et al., Reference Voytek, Canolty, Shestyuk, Crone, Parvizi and Knoght2010), the alpha band (primarily its upper subrange) plays the inhibitory function, helping to reject distractors that might interfere with task-relevant information (see Bonnefond & Jensen, Reference Bonnefond and Jensen2012).
In contrast to Sauseng et al. (Reference Sauseng, Klimesch, Heise, Gruber, Holz, Karim and Hummel2009), Kamiński, Brzezicka, and Wróbel (Reference Kamiński, Brzezicka and Wróbel2011) investigated the amplitude-amplitude (instead of phase-amplitude) coupling in 17 healthy young resting adults. The authors identified the frequencies at which the theta and gamma envelopes were correlated strongly (i.e., with r equal at least .75) for the maximum amount of time (“global time of synchrony”; GTS), as compared to amount of time for other frequencies. Then, they regressed individual scores in the subsequent digit STM task on the individually identified theta and gamma cycle lengths. The theta cycle was substantially longer (in line with Lisman & Idiart, Reference Lisman and Idiart1995), and the gamma cycle was visibly shorter (in line with Chuderski & Andrelczyk, Reference Chuderski and Andrelczyk2015), in more capacious participants. The theta-to-gamma cycle length ratio correlated with STM capacity at r = .79. However, this result was found only for the sole electrode (Fz). Also, as noted by Lisman and Jensen (Reference Lisman and Jensen2013), the method of frequency identification gave very noisy estimates, as at least several theta-gamma frequency pairs yielded comparable values of GTS. Thus, the Kamiński et al. (Reference Kamiński, Brzezicka and Wróbel2011) result should be interpreted with caution.
The only report to date (March 2016) that related parameters of cross-frequency coupling to intelligence was published by Pahor and Jaušovec (Reference Pahor and Jaušovec2014a). In their first study, encompassing EEG data from resting state of 100 young healthy adults, they found weak negative correlations (average r = –.26) between the index of coupling, defined as the maximum correlation between envelopes of consecutive theta and gamma bands (sampled every 1 Hz), and general intelligence, measured with the WAIS test. Those negative correlations were primarily found at frontal and posterior sites. In the second study, participants from the first and fifth quintile of the coupling index solved a variant of the Raven test while their EEG signal was recorded, and another index of coupling was calculated for this signal. The results showed that the low-coupling-at-rest group displayed higher scores on Raven, as well as a significantly stronger coupling in the left frontal region during the most difficult Raven items, as compared to the high-coupling-at-rest group. However, the use of extreme-group design by Pahor and Jaušovec, strongly dissuaded by methodologists due to statistical artifacts and low power it may yield (see Preacher, Rucker, MacCallum, & Nicewander, Reference Preacher, Rucker, MacCallum and Nicewander2005), as well as the use of a circular selection criterion (low-coupling-at-rest group scored higher in WAIS, so it is not surprising that later they scored higher in Raven as well), makes their data difficult for interpretation. Moreover, they did not analyze frequencies at which the coupling took place.
Although the evidence on the important role of the cross-frequency coupling in intelligence is scarce, a promising nature of such a research is supported by several studies which demonstrated a causal link between the theta/gamma band stimulation and an increase in WM capacity as well as in reasoning performance. These studies used transcranial alternating current stimulation (tACS), which, unlike rTMS, induces sinusoidal trains of impulses, and thus can affect precisely defined frequency of oscillations in the brain, as well as the cross-frequency coupling for that frequency (for a review of this novel method see Herrmann, Strüber, Helfrich, & Engel, Reference Herrmann, Strüber, Helfrich and Engel2016).
For instance, Polanía, Nitsche, Korman, Batsikadze, and Paulus (Reference Polanía, Nitsche, Korman, Batsikadze and Paulus2012) stimulated at the 6-Hz frequency their participants during memorizing of the three-letter sequences to be matched with a target letter. Stimulation and memorization were either synchronized at the trough of the wave, or at its peak. The former speeded recognition performance, whereas the latter slowed it down, in comparison to the sham stimulation. These effects were found when the left frontal and both parietal cortices were stimulated. Jaušovec, Jaušovec, and Pahor (Reference Jaušovec, Jaušovec and Pahor2014), via stimulating the parietal cortex using the theta frequency synchronized at trough with the battery of recall tasks, observed an almost half item improvement in recall, in comparison to the sham condition. The effect was even stronger for the executive processing tasks. No such effects were found when the frontal cortex was stimulated. Similar effect of the parietal theta stimulation pertaining to the change detection task (an increase in WM capacity by more than a half item) was observed by Jaušovec and Jaušovec (Reference Jaušovec and Jaušovec2014).
Three other studies demonstrated improved reasoning performance after applying tACS. After the stimulation at the 40-Hz frequency, Santarnecchi et al. (Reference Santarnecchi, Polizzotto, Godone, Giovannelli, Feurra, Matzen and Rossi2013; Reference Santarnecchi, Muller, Rossi, Sarkar, Polizzotto, Rossi and Cohen Kadosh2016) observed shorter response times for complex (but not for easier) items of the matrix reasoning task, as compared to the stimulation at the 5, 10, and 20-Hz bands. Pahor and Jaušovec (Reference Pahor and Jaušovec2014b) stimulated participants with the theta frequency applied at the frontal (one group) or parietal cortices (another group) for 15 minutes. After the subsequent 5-minute EEG recording, which displayed increased power at the target frequency, the participants solved a modified Raven test and the Paper Folding and Cutting test. 28 days earlier or later, the same participants solved parallel versions of each test after sham stimulation. The aftereffects of the stimulation were significant, as the scores on both tests improved, in comparison to the sham condition. The group stimulated at the parietal site improved significantly more than the group stimulated at the frontal site. The improvement was also more pronounced for difficult than for easy items.
Although existing studies of the tACS stimulation effects on WM capacity and Gf have not yet pertained directly to the possible coupling between these two bands, these effects were substantial. Moreover, as they usually persist for at least 30 minutes after stimulation, subsequent EEG studies may relatively easily verify whether the tACS application affects also the cross-frequency coupling or not, and whether the potentially observed increase in certain parameters of coupling correlates with the increase of performance on Gf tests or not.
Summarizing the existing correlational research on the links between cross-frequency coupling and cognitive ability (to date examined via its proxy – WM capacity, with the Pahor and Jaušovec study being the sole exception), several studies indicated substantial links between the two. Especially, in three studies relating coupling to WM capacity (Kamiński et al., Reference Kamiński, Brzezicka and Wróbel2011; Leszczyński et al., Reference Leszczyński, Fell and Axmacher2015; Sauseng et al., Reference Sauseng, Klimesch, Heise, Gruber, Holz, Karim and Hummel2009), the former could explain as much as about one third of variance in the latter. Taking into account that single WM tasks of unknown reliability were used, the real relationship may likely be significantly stronger. In light of the fact that these studies can be plausibly interpreted in the context of established formal theories of WM and reasoning, they constitute a promising first step towards the explanation of inter-individual variation in cognitive ability in terms of the characteristics of underlying neural oscillations. On the other hand, existing studies can barely be conclusive, because the investigated samples were extremely small, the locations of the WM-load and WM-capacity dependent effects substantially varied (hippocampus, the frontal regions, the parietal regions, etc.), some studies used EEG signals only from resting state, and the mutually differing correlates of WM capacity/cognitive ability were found in particular studies (the coupled gamma frequency in Leszczyński et al., Reference Leszczyński, Fell and Axmacher2015; both the coupled gamma and theta frequencies in Kamiński et al., Reference Kamiński, Brzezicka and Wróbel2011; the load-dependent increase in the coupling strength in Sauseng et al., Reference Sauseng, Klimesch, Heise, Gruber, Holz, Karim and Hummel2009; and the very coupling strength in Pahor & Jaušovec, Reference Pahor and Jaušovec2014a).
The future of research on the oscillatory basis of intelligence
Future research, which will be based on larger samples, will use established batteries of WM and reasoning tests of known reliability, and will conduct simultaneous analyses and comparisons of alternative indices of the cross-frequency coupling (ideally, recorded during WM and reasoning performance, and not – resting state), is needed before any firm conclusions on the role of cross-frequency coupling for the intelligence level can be made. Nevertheless, we argue that such a coupling may constitute the crucial level at which neurobiological (genes, neurotransmitters, gray/white matter volume for the whole brain as well as for particular sites, neuronal speed, etc.) and cognitive factors (working memory capacity, long-term memory retrieval, learning, cognitive control, etc.), known to predict Gf, can be integrated. In other words, the cross-frequency coupling of neuronal oscillations may constitute the basic cognitive code which can be related to the form and – especially – the contents of cognitive operations (and resulting behavior), but also to the underlying neuronal level. As shown by several theoretical models (Chuderski & Andrelczyk, Reference Chuderski and Andrelczyk2015; Doumas, Hummel, & Sandhofer, Reference Doumas, Hummel and Sandhofer2008; Hummel & Holyoak, Reference Hummel and Holyoak2003; Rasmussen & Eliasmith, Reference Rasmussen and Eliasmith2014), such a grounding of reasoning and learning in the (simulated) oscillatory activity of certain neuron-like entities is possible in silico. Assuming that human cognition can be described at multiple levels (i.e., information-theoretic, or cognitive, operations in the brain are as “real” as underlying biological processes), the cross-frequency coupling may constitute the highest biological level of description (highly coordinated activity of neurons that is regulated by multiple neurotransmitters, and is strongly heritable; see Begleiter & Porjesz, Reference Begleiter and Porjesz2006), as well as the lowest cognitive level of description (the most basic mechanism that is able to represent and transform structured representations; Chuderski & Andrelczyk, Reference Chuderski and Andrelczyk2015). Cross-frequency coupling could thus bind these two kinds of description levels together.
If this hypothesis is valid, then investigating the oscillatory mechanisms and their coupling may be the key to our understanding of fluid intelligence. Moreover, explaining WM and relational reasoning in terms of cross-frequency coupling may help to explain why we observe substantial links between intelligence and other factors, seemingly unrelated to WM and/or relational processing. For example, current models gave us great insights into the oscillatory nature of speeded responding and time perception, which long ago was suspected by Jensen (1982; for review of current models see Gu, van Rijn, & Meck, Reference Gu, van Rijn and Meck2015). The advantage of more intelligent people in processing speed (Jensen, Reference Jensen1998) and temporal resolution (Troche & Rammsayer, Reference Troche and Rammsayer2009) may be plausibly accounted for by their faster gamma oscillations, as well as by their more reliable coupling of these oscillations to the longer waves, reducing the need for phase resetting that may be responsible for a longer tail of the response time distribution in less intelligent people (Coyle, Reference Coyle2003). Also, recent research indicated better functional connectivity among crucial brain regions of more intelligent individuals (e.g., Cole et al., Reference Cole, Yarkoni, Repovs, Anticevic and Braver2012; Santarnecchi, Galli, Polizzotto, Rossi, & Rossi, Reference Santarnecchi, Galli, Polizzotto, Rossi and Rossi2014), and it was suggested that such a connectivity is driven by the cross-frequency coupling (see Palva & Palva, Reference Palva and Palva2012). So, deteriorated connectivity in less intelligent people may be explained in terms of an ineffective long-range coupling between low- and high-frequency bands.
Concluding, several existing theoretical models predict that individual capacity of WM as well as individual effectiveness of relational reasoning strongly depend on certain characteristics of neuronal oscillations, especially their cross-frequency coupling. Although empirical evidence supporting these predictions is still insufficient, it suggests that the future studies on oscillatory coupling may be a highly promising line of research, which can uncover the physiological underpinnings of human intelligence in an important way. Cross-frequency coupling may serve as the optimal level of description of reasoning (and, more generally, cognitive) processes, as on the one side it can be linked precisely with the genetic, structural, neurochemical, and bioelectrical factors pertaining to the human brain, while on the other side the specific patterns of oscillatory coupling can plausibly explain cognitive operations that occur during successful reasoning performance. Thus, describing relational reasoning in terms of neuronal oscillations may allow to integrate various levels of description into a complete and coherent model of mechanisms underlying human fluid intelligence.
This study was supported by the MISTRZ grant sponsored to A. Chuderski by the Foundation for Polish Science. Special thanks to Mikołaj Magnuski for his invaluable comments on the draft of this paper, as well as for providing the figures.