Within organizations, leaders and teams are often tasked with performing at an increasingly faster rate while maintaining high performance. These demands have prompted the popularity of management trends like agility (Cappelli & Tavis, Reference Cappelli and Tavis2018; Rigby et al., Reference Rigby, Elk and Berez2020), which emphasizes frequent feedback loops from employees and customers. This not only has led to the implementation of short, frequent “huddle” meetings (Harrison, Reference Harrison2018) but also has played a part in the growing popularity of pulse surveys. Pulse surveys are generally defined as a technique to obtain a quicker, yet limited, perspective on workplace climate (Colihan & Waclawski, Reference Colihan, Waclawski and Kraut2006). These shorter, more frequent surveys are typically marketed as a supplement or replacement for longer, census-based organizational surveys. Accounts of successful pulse survey programs have appeared in popular publications such as the Wall Street Journal (Silverman, Reference Silverman2014) and the Harvard Business Review (Power, Reference Power2016). In addition, advances in survey technologies have made it easier for companies to quickly construct and deploy low-cost employee surveys (Macey & Fink, Reference Macey, Fink, Macey and Fink2020). These factors, along with a general dissatisfaction with large-scale organizational surveys (e.g., Cappelli, Reference Cappelli2020), have made pulse surveys an attractive alternative for driving employee engagement (Welbourne, Reference Welbourne2016).
Although pulse surveys are widely marketed by third-party vendors (e.g., TINYpulse, n.d.) and adopted by prominent organizations (e.g., Amazon: Kim, Reference Kim2018), there is little existing research available for scientist–practitioners concerning this practice. Although several book chapters have been published about pulse surveys (e.g., Colihan & Waclawski, Reference Colihan, Waclawski and Kraut2006; Jolton & Klein, Reference Jolton, Klein, Macey and Fink2020), a recent Google Scholar search resulted in only two published journal articles on the topic (Welbourne, Reference Welbourne2016; Winton & Palmer, Reference Winton and Palmer2018). Some additional studies have acknowledged the use of pulse surveys (e.g., Van Rooy et al., Reference Van Rooy, Whitman, Hart and Caleo2011), but available research is far outnumbered by articles and case studies that are published by survey vendors and the popular press. Without a basis of empirical evidence to rely on, scientist-practitioners may be left to rely on less credible sources when they are tasked with designing or implementing a pulse survey program (Delmhorst, Reference Delmhorst2018). This imbalance mirrors a broader research–practice divide regarding many popular talent management practices such as Lean management (Balzer et al., Reference Balzer, Brodke, Kluse and Zickar2019). Rotolo et al. (Reference Rotolo, Church, Adler, Smither, Colquitt, Shull, Paul and Foster2018) warned that the adoption of novel survey methods without a foundation of research evidence potentially leads to poor results and disinterest in organizational surveys in the long run.
Despite a lack of targeted studies on pulse surveys, there is a wealth of research on job attitudes, which may be relevant to understanding the potential limitations of pulse surveys. For example, past studies have observed meaningful fluctuations in within-person engagement or other job attitudes over short periods (Bakker, Reference Bakker2014). Likewise, researchers have also observed “honeymoon” and “hangover” effects where job attitudes are most positive among newly hired employees but gradually decrease over time (Boswell et al., Reference Boswell, Shipp, Payne and Culbertson2009) but may also increase slightly with age (Riza et al., Reference Riza, Ganzach and Lui2018). However, decades of research have reported that job attitudes remain relatively stable between persons over time (e.g., Staw & Cohen-Chrash, Reference Staw and Cohen-Charash2005). In support of the dispositional approach to job attitudes, stable personality traits often share large proportions of variance in different attitudes. Meta-analytic research has found that personality traits combine to account for up to 48% of the variance in job attitudes, such as employee engagement (Young et al., Reference Young, Glerum, Wang and Joseph2018) or job satisfaction (Steel et al., Reference Steel, Schmidt, Bosco and Uggerslev2019), as well as over 60% of subjective well-being in general (Steel et al., Reference Steel, Schmidt and Shultz2008). These personality linkages are also theorized to explain observed genetic correlations with job attitudes (Hahn et al., Reference Hahn, Gottschling, Konig and Spinath2016). Other researchers propose other mechanisms, such as opponent process theory, by which job attitudes may experience minor fluctuations in the short term but tend to return to a stable baseline over time (Bowling et al., Reference Bowling, Beehr, Wagner and Libkuman2005). There is also evidence for individual differences in the strength of their own job attitudes, which may further limit variability over time (Schleicher et al., Reference Schleicher, Smith, Casper, Watt and Greguras2015). Based on these findings, it is uncertain whether more frequent, longitudinal pulse surveys can detect useful changes in employee attitudes, perceptions, or behavior.
In addition to concerns about the relative stability of job-related attitudes, it is also uncertain whether pulse surveys are sensitive enough to detect meaningful differences between units or teams. Although there has been much research regarding within-person changes in job attitudes, in practice organizational survey data are generally analyzed at the group or aggregate level (Harter & Schmidt, Reference Harter, Schmidt and Kraut2006). Along these lines, researchers have made great advances in understanding how attitudes and perceptions of individual employees emerge to form group-level climate and other related constructs (Schneider et al., Reference Schneider, Ehrhart and Macey2013). Bliese et al. (Reference Bliese, Maltarich, Hendricks, Hofmann and Adler2019) identified that survey researchers and practitioners rarely consider the proportion of between-group variance when developing or evaluating organizational survey items. Even among the best performing items, less than 20% of the variability in item responses can be explained by group-level factors, as calculated using ICC(1) estimates. This problem may be further exacerbated by the use of single-item measures. Single-item measures may be adequate for measuring some constructs (Fisher et al., Reference Fisher, Matthews and Gibbons2016), but this practice reduces reliability, which can further minimize the proportion of between-group variability in scores. Therefore, the abbreviated structure of pulse surveys may act to minimize differences between groups.
Present study
The goal of the present study is to report the results of a four-wave pulse survey program that was implemented within a health care organization. Pulse surveys are quickly becoming a common practice in many organizations and offer several advantages compared with traditional, large-scale organizational surveys. Despite their growing popularity, however, there is little empirical research to help scientist-practitioners determine the best practices for pulse surveys. Even though pulse surveys are attractive as a means of gathering and responding to feedback more quickly, it is unclear how the limitations of this method may potentially harm the reliability or validity of survey data. Therefore, this study was designed to help bridge this growing research–practice gap and to empirically observe the potential limitations of pulse surveys.
Method
Participants
The data were collected as part of a pulse survey program that was conducted at a regional hospital of roughly 400 employees. All of the hospital staff, excluding physicians, were eligible to participate in the survey program (between 304 and 360 staff members across waves). Four surveys were administered between the months of January and August. Some employees were only recruited to participate in the final three survey waves (e.g., radiology and respiratory staff). Each survey was developed by internal human resources (HR) staff based on a literature search of similar construct measures and administered using an online survey-building platform (Checkbox). Hospital employees were each sent an anonymous link to access the survey from HR staff. No identifying information was collected from the employees. In each survey, the participants were asked to identify the option that best described their current role at the hospital. The results were reported for 9 to 11 different job roles (Table 1). The employees were given 1 week to participate.
Participants by survey wave and job role

The participation rates for each survey wave ranged from 42% (Wave 4) to 54% (Wave 3) of eligible staff. These values were used to calculate the overall margin of error for each survey using the formula reported by Colihan and Waclawski (Reference Colihan, Waclawski and Kraut2006). To estimate the margin of error in Likert-type scale terms (scores ranging from 1–5), we assumed a normal distribution in item responses (variance = 1.04). This yielded margin of error estimates, which ranged ± 0.10–0.12. Often, survey responses are also reported as percent favorable (Brown, Reference Brown2020). For this metric, the margin of error estimates ranged ± 4.8–6.2 percentage points.
Survey design
The surveys were designed to test out two different survey methodologies as part of a pilot program. Each survey contained between three and five total survey questions. Using the taxonomy that was defined by Jolton and Klein (Reference Jolton, Klein, Macey and Fink2020), the present study used a combination of census-based action tracking and ad hoc survey items. The primary goal of census-based action-tracking pulses is to track action or movement in employee sentiment over time. Census-based pulsing involves the repeated measurement of a primary variable (e.g., employee engagement) across the entire employee population. This variable is consistently measured at multiple points to observe longitudinal trends in individual or team scores. Organizations have used this methodology in practice to detect seasonal trends in employee attitudes (Colihan & Waclawski, Reference Colihan, Waclawski and Kraut2006) or to monitor changes in motivation within work teams (Power, Reference Power2016).
In contrast, ad hoc surveys are designed to assess important, individual topics or initiatives at a single point. Rather than emphasizing longitudinal trends or analyses, ad hoc surveys are intended to measure a specific topic during the time between large-scale census surveys. For example, ad hoc surveys can be used to follow up on specific concerns that were identified within the previous census survey or to evaluate a recent organizational change. This methodology allows organizations to receive feedback more quickly than waiting to conduct the annual or biannual organizational survey. In the present study, the participants were asked one or two ad hoc survey questions during each wave. The content for these questions was determined by responses to previous rounds of employee comments or local concerns that were identified within the hospital’s leadership team.
Measures
State engagement was measured using a single item during each wave. Macey and Schneider (Reference Macey and Schneider2008) defined state engagement as a blend of job satisfaction, involvement, and commitment but with a greater emphasis on affectivity. The participants were asked to respond to this question using a 5-point, emoji response scale (Figure 1). These scale anchors were originally designed by Phan et al. (Reference Phan, Amrhein, Rounds and Lewis2019), who observed that they adequately replaced verbal Likert-type response anchors in a measure of vocational interests. Similar emoji-based response scales are commonly used by prominent customer and employee survey firms (e.g., Happy or Not; Owen, Reference Owen2018). This methodology has also been used to provide a valid measure of affective job satisfaction in earlier research (Kunin, Reference Kunin1955).
Engagement item used in all four pulse surveys
Note. Response anchors were originally used by Phan et al. (Reference Phan, Amrhein, Rounds and Lewis2019) and are freely available for educational or commercial use.

Along with the affective engagement item, one to two additional questions were administered during each wave. In the first wave, one item measuring the opportunity to participate in decision making was administered. This item was found to be an important engagement driver based on the most recent organizational survey. In the second wave, the employees were asked one question about supervisor support (adapted from Greenhaus et al., Reference Greenhaus, Parasuraman and Wormley1990). In the third wave, staff members were asked two questions about their perceived safety at the hospital. The responses to these items were strongly correlated (r = .59) and combined to provide a composite measure. Last, staff members were asked two questions about their recent performance appraisal in the fourth wave. One item was designed to measure satisfaction with the appraisal process relative to the prior year since a new review process had been implemented. The second item asked staff to indicate whether their supervisor had explained the basis for changes in pay (adapted from Jones et al., Reference Jones, Scarpello and Bergmann1999). All of the survey questions are reported in the Appendix.
Results
Effects of group and time on engagement ratings
To observe the variability in affective engagement ratings over time and between work units, the ratings were analyzed using a two-way analysis of variance (ANOVA) model. Each engagement rating was paired with a time variable (wave at which the item was administered) and a work unit variable (self-identified job role). This provided a way to calculate the proportion of variance in engagement ratings that could be accounted for by time and work unit. However, a truly repeated-measures ANOVA model was not possible to use because individual responses could not be linked to a single individual. This meant that any within-person variance in ratings would be misclassified as error variance. Despite this limitation, the ANOVA model was still sufficient for observing the proportion of between-group and between-wave variability in ratings. An interaction term (work unit × time) was also included to explore for differences in engagement trends over time between groups.
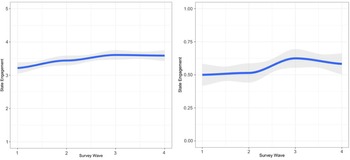
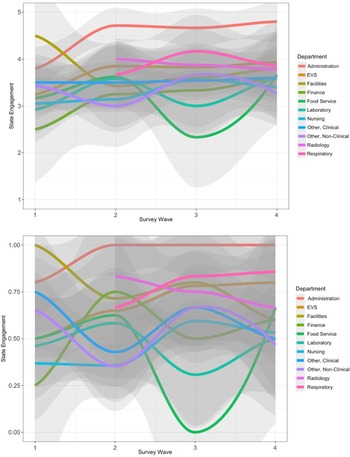
Both time, F(3, 623) = 5.09, p = .002, and work unit, F(10, 623) = 5.24, p < .001, explained significant variance in the engagement ratings. Using Tukey’s honestly significantly different test to explore pairwise comparisons, engagement was significantly higher during Waves 3 and 4 compared with Wave 1 (Figure 2). However, there was no meaningful change in overall engagement between sequential survey waves. Overall differences between work units accounted for nearly four times the amount of engagement rating variance (partial η2 = .08) compared with differences between points (partial η2 = .02). The hospital leadership team (Administration) was generally more highly engaged than were most other work units. Yet, there were practically no other differences in engagement between individual work units. There was also no meaningful interaction between time and work unit, F(11, 627) = 0.64, p = .79. This result indicates that no substantial differences in engagement trends over time could be detected between work units (Figure 3).
Overall trend in affective engagement across time
Note. Average scores are reported on the left, and the values for percent favorable are reported on the right. The shaded areas represent the standard error in engagement scores at each point. Compared with Wave 1, mean engagement scores were higher in Waves 3 and 4. However, the changes in scores between Waves 1 and 2, 2 and 3, and 3 and 4 did not reach statistical significance.

Trends in affective engagement across time by department.
Note. Average scores are reported in the top chart, and the values for percent favorable are reported below. The shaded areas represent the standard error in engagement scores at each point. These results indicate that most of the between-group differences in engagement scores are overpowered by within-group variance in scores. Across all points, Administration scored higher in engagement compared with most other departments, but no other between-group differences reached statistical significance.

Group and individual-level effects for each survey
Next, a separate set of analyses was conducted based on the response data that were gathered within each survey wave. The proportion of between-group variance for each survey item was estimated by calculating ICC(1) as recommended by Bliese et al. (Reference Bliese, Maltarich, Hendricks, Hofmann and Adler2019). Although there was practically no group effect on engagement ratings in the first wave, the ICC(1) estimates ranged from .10 to .13 across the remaining three waves (Table 2). Similar ICC(1) values were also found for each of the additional survey items administered in each wave. The largest group effects were found for satisfaction with performance reviews, ICC(1) = .18, and opportunity to participate in decision making, ICC(1) = .11. On the other hand, basically no group effect was observed for perceived workplace safety, ICC(1) = .03. Overall, most of the observed ICC(1) values represent a medium effect of work group on individual responses according to the guidelines reported by LeBreton and Senter (Reference LeBreton and Senter2008). However, these effects suggest that most of the variability in item responses can be explained by differences among individuals and not necessarily by group characteristics.
Engagement results by survey wave

Note. M = mean; SD = standard deviation; percent favorable is the proportion of respondents who selected either of the top two response options; ICC(1) = interclass correlation, type 1; values in brackets represent 95% confidence intervals; d Wave 1 = standardized mean difference compared with engagement at Wave 1; d Previous = standardized mean difference compared with engagement at previous point.*p < .05.
Individual engagement ratings were strongly related to many of the ad hoc survey items that were administered within each survey wave (Table 3). Engagement was most strongly related to opportunities to participate in decision making (r = .55) and perceived supervisor support (r = .50). These results suggest that the responses to the items that were designed to assess narrowly defined employee experiences or perceptions may be largely influenced by more general feelings of engagement or satisfaction. Assuming a reliability of .70 reported in a review of single-item measures by Wanous et al., Reference Wanous, Reichers and Hudy1997) and a reliability of .66 for a similar measure of affective engagement (Kunin, Reference Kunin1955), up to 65% of the reliable variance in each of these ad hoc survey items could possibly be explained by engagement ratings (corrected ρ = .81). Slightly weaker, yet strong, correlations were also found for procedural justice in pay decisions (r = .37) and perceived workplace safety (r = .24). These results evoke past research indicating a positive manifold across various forms of job attitudes (e.g., Newman & Harrison, Reference Newman and Harrison2008; Shuck et al., Reference Shuck, Nimon and Zigarmi2017). For example, the 12 items in the Gallup Q12 survey are designed to measure different workplace experiences, but a dominant, general factor typically accounts for most of the item variance (Harter et al., Reference Harter, Schmidt, Asplund, Killham and Agrawal2010). Although individual survey items may appear to target narrowly defined workplace concerns or topics, their face validity alone is not evidence of discriminant validity from more generalized job attitudes.
Correlations between engagement ratings and survey items

Note. M = mean; SD = standard deviation; CI = confidence interval, ICC(1) = interclass correlation, type 1. These values can be interpreted as the proportion of between-group variance in scores; the values in parentheses represent 95% confidence intervals; ρ = correlation between item and engagement rating after correcting for measurement error in the item (reliability estimate = .70 from Wanous et al., 1997) and engagement (reliability estimate = .66 from Kunin, Reference Kunin1955).
a item used a 5-point response scale (all other items used a 6-point response scale).
Discussion
In the present study, four waves of pulse surveys were deployed to employees of a regional hospital. The results indicate that only modest changes in state engagement could be detected over a period of 8 months. Even with typical participation rates for most monthly organizational surveys (Rotolo et al., Reference Rotolo, Fleck, Shepherd, Macey and Fink2020), practically no differences in engagement could be detected between job roles. There were also no differences in the longitudinal trends in engagement between job roles. These results suggest either that group engagement levels remained relatively stable over time or that there was not enough variability in the single-item ratings to detect differences between roles. The ICC(1) estimates indicated useful group-level effects for engagement (between 10% and 13% of the between-group variance in Waves 2–4), but most of the variability could not be accounted for by the time or group variables. Instead, most of the variability in responses was likely due to a combination of individual-level factors or measurement error.
Implications for practice and directions for future research
If current trends persist, more and more organizations will continue to adopt pulse surveys in practice (Rotolo et al., Reference Rotolo, Fleck, Shepherd, Macey and Fink2020). Therefore, further longitudinal research on changes in group-level measures over time is important for informing best practices. Pulse surveys are often marketed as a way to track real-time changes in employee sentiment (e.g., TINYpulse, n.d.); however, much of the variability in responses over time could be caused by random measurement error (Thoresen et al., Reference Thorsen, Kaplan, Barsky, Warren and de Chermont2003). In addition, although researchers have linked substantive within-person changes in engagement or job stress to important work outcomes (e.g., Ilies et al., Reference Ilies, Liu, Liu and Zheng2017), these results may not generalize to group or aggregate levels. Cucina et al. (Reference Cucina, Burtnick, Byle, Hayes and Pillion2020) recently observed that unit-level survey results exceeded test–retest reliabilities of .80 when comparing scores up to 3 years apart. These findings were also fairly consistent across different survey topics (e.g., job satisfaction, supervisor, team, leadership), suggesting that there was little meaningful change in group attitudes over that time.
Another important challenge for researchers and practitioners is to better understand how organizations can effectively keep up with the increased frequency of pulse surveys. Past work indicates that organizations often struggle to take timely action based on annual or biannual organizational surveys (e.g., Kraut, Reference Kraut and Kraut2006). This problem becomes considerably more challenging if organizations are now tasked with reviewing and responding to additional surveys within a shorter period. Even though many new technologies provide the means of sharing survey results in real time, leaders and managers may be reluctant to provide open access to the results to all employees. In the present study, leaders were often hesitant to share survey results without first having the opportunity to review and summarize the results with managers. The reporting process first began by meeting with the leadership team after analyzing the survey results. Afterward, the leadership team would present the result to a monthly meeting for all managers at the hospital. Thus, the employees typically needed to wait at least a couple of weeks before receiving feedback about the survey. Although collecting survey data more frequently is appealing to many, this also requires more frequent action in response to survey results. This is critical, as failing to act on survey results can be more counterproductive than failing to share the basic survey results at all (Church & Oliver, Reference Church, Oliver and Kraut2006). Thus, scientist-practitioners need to establish clear expectations about how pulse survey data will be used and how quickly employees and managers can expect to share results and take follow-up action.
Given these statistical and practical limitations, it is unclear how much value pulse surveys can provide to organizations. Although pulses are often identified as only a supplement to census-based surveys (e.g., Wellbourne, Reference Welbourne2016), some organizational stakeholders may be looking to shift to pulse surveys due to dissatisfaction with the costs of traditional methods. Instead, pulse surveys appear to be ill equipped to provide much beyond an immediate, high-level perspective on a select few concepts or issues. Much of the past research and practice of employee surveys has focused on the importance of using surveys as a strategic tool for driving organizational change (Schneider et al., Reference Schneider, Ashworth, Higgs and Carr1996). In a recent example, Schiemann and Seibert (Reference Schiemann and Seibert2017) documented the evidence-based use of employee surveys for identifying unique issues that are faced by regional units, better understanding the importance of training in reducing turnover, and informing the redesign of regional manager roles. To achieve this level of success, however, the researchers required a rich collection of data that allowed for an analysis across multiple levels and several actionable variables. Without a broader strategy or process for evaluating and taking action on survey results, it seems unlikely that the administration of more frequent, shorter pulse surveys alone will help drive successful change efforts.
Instead, a better application of pulse surveys could be to focus on open-response comments rather than close-ended survey items. This approach is more qualitative than quantitative but could help identify important topics or concerns among employees. Although the use of open-ended comments has been limited in the past due to the cost of reading and coding responses (Krosnick & Presser, Reference Krosnick and Presser2010), recent technological advances have enabled researchers and practitioners to analyze large bodies of open-response data using natural language processing (Dutta & O’Rourke, Reference Dutta and O’Rourke2020). Several natural-language-processing tools are presently available for use with open-source statistical packages (e.g., R; Kumar & Paul, Reference Kumar and Paul2016), and many third-party survey vendors offer text analytics as part of their services. The use of text analysis has also been expanding into other areas of organizational practice including performance appraisal (Speer, Reference Speer2020) and selection testing (Lievens et al., Reference Lievens, Sackett, Dahlke, Oostrom and De Soete2019). Open-response comments could be analyzed to identify ideas and concepts to be further investigated in subsequent surveys. This may help organizations design surveys that feel more relevant to employees while indicating that the organization is using employee feedback to learn more about concerns expressed within the pulse surveys.
Limitations
There are a few limitations that should be acknowledged when interpreting the results of the present study. First, all four surveys were anonymous, which made it impossible to estimate the proportion of within-person variance in engagement responses. Past research has found that within-person factors may account for nearly half of the variability in engagement or similar job attitudes (Bakker, Reference Bakker2014). This suggests that our estimates of error variance are likely inflated because they confound within-person variability with unsystematic error. However, most survey data in practice are analyzed and reported in aggregate to ensure that employee responses are confidential. Second, these results were obtained from hospital employees within a single organization. Even though most of the survey items were not specific to health care or medicine, it is possible that these results may not generalize to other workplace settings. Last, these survey results are based on a pilot program that only involved a population of 360 employees across 11 self-reported work roles. These results may be most relevant to moderately sized organizations (fewer than 500 employees). In contrast, larger organizations may be capable of gathering more reliable measures from pulse surveys due larger sample sizes. In either case, the results of the present study may still be informative in illustrating the difficulty of detecting reliable between-group differences when using brief survey measures in practice.
Conclusions
The results of the present study highlight several limitations of conducting pulse surveys. Despite the allure of collecting more frequent feedback from employees, the typical features of pulse surveys limit the reliability by relying on short, single-item measures. These measures also yield little between-group variance in response, which makes it difficult to identify meaningful differences between work units or departments. In most cases, the results may only be representative of the entire organization. This may be problematic if leaders are expecting to analyze work unit results as typical in traditional, census-based surveys. Thus, scientist-practitioners should carefully consider these limitations when designing or implementing pulse survey programs. Continued research is needed in order to identify the optimal uses for this method as a supplement to large-scale organizational surveys.
Appendix: Full Listing of AdHoc Survey Items
Wave 1
My supervisor gave me opportunities to participate in decisions that affected my work environment. [disagree/agree]
Wave 2
My supervisor gave me feedback last month that helped me do my job. [disagree/agree]
Wave 3
I always feel safe on the job at [the hospital]. [disagree/agree]
I always feel safe when traveling between the hospital and the parking lot. [disagree/agree]
Wave 4
Compared to last year, how would you rate the new performance review process? [much worse than last year/much better than last year]
My supervisor explained to me how my pay increase was decided. [disagree/agree]