I. INTRODUCTION
Because of their electromechanical coupling behavior, ferroelectric polycrystals are used for a wide range of sensor and actuator applications. This electromechanical behavior comprises two components: an intrinsic component, typically associated with the linear lattice distortion of the unit cell, and an extrinsic part, typically associated with the creation and motion of ferroelectric or ferroelastic domain walls,Reference Jaffe, Cook and Jaffe1 which can have a nonlinear effect on the macroscopic properties.Reference Merz2–Reference Schäufele and Härdtl5 The domain structure is influenced by external loads such as electric fields or mechanical stresses and also internally through interactions with different defects.Reference Li, Rogan, Üstündag and Bhattacharya6 There exist limited quantitative studies of the relationships between extrinsic effects such as domain wall motion and nonlinear propertiesReference Hoffmann, Hammer, Endriss and Lupascu7 because the development of the domain structure is rather complex and depends on many factors, particularly in polycrystalline ceramics. Moreover, few domain measurements or observation methods allow a quantitative interpretation.
Direct observations of domain structures have previously been carried out using polarized light microscopyReference Merz2 and electron microscopy.Reference Randall, Barber and Whatmore8 In addition, the domain orientation density can be probed using x-ray diffraction (XRD) and neutron diffraction.Reference Li, Bhalla, Newnham, Cross and Huang9 The diffraction analysis method allows the observation of changes in the non-180° domain structure while an external load such as a mechanical stress or an electric field is applied.Reference Rogan, Üstündag, Clausen and Daymond10–Reference Pramanick, Prewitt, Cottrell, Lee, Studer, An, Hubbard and Jones14
The objective of this study is to quantitatively compare the degree of domain orientation obtained by diffraction analysis and the macroscopic nonlinear behavior of a commercial lead zirconate titanate (PZT) ceramic under an external electrical and mechanical load. The macroscopic parameter of strain is measured under both electrical and mechanical loading and used to describe the nonlinear behavior. Similar to the domain orientation density, obtained by diffraction measurements, the nonlinear strain also reflects only non-180° domain wall motion and is, therefore, suitable for a comparison. But the nonlinear strain is not accessible experimentally—the full macroscopic strain containing the linear and the nonlinear part is measured instead. To determine the nonlinear strain component, the full macroscopic strain must be separated numerically by means of the linear contribution to the macroscopic strain. The linear strain can be calculated using the intrinsic linear piezoelectric effect and the intrinsic linear elasticity by knowing the piezoelectric coefficient and the elastic compliance as a function of the external load.Reference Webber, Aulbach, Key, Marsilius, Granzow and Rödel15
II. EXPERIMENTAL PROCEDURE
The investigated material was a commercial PZT ceramic of composition Pb0.99(Zr0.45Ti0.47(Sb0.67Ni0.33)0.08)O3 (PIC 151; PI Ceramics, Lederhose, Germany) with a composition on the tetragonal side of the morphotropic phase boundary showing the characteristics of a soft doped material. The samples for the mechanical testing and the neutron diffraction were of a cylindrical shape with dimension 6 mm in diameter and 6 mm in height. Disk-shaped samples of 10 mm in diameter and 1 mm in height were used for electrical measurements, and rectangular samples of size 1 × 1 × 10 mm3 were used for the high-energy XRD measurements. Two opposing faces (the circular faces for the disk-shaped samples and two opposite 1 × 10-mm faces for the rectangular samples) were ground and lapped to obtain flat and parallel surfaces within the accuracy of less than 10 μm. They were sputtered with gold–palladium electrodes ∼50 nm in thickness. Each sample was annealed at 450 °C for 30 min to ensure that the initial configuration is a random domain orientation state representing an unpoled sample.
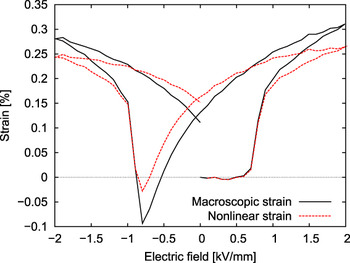
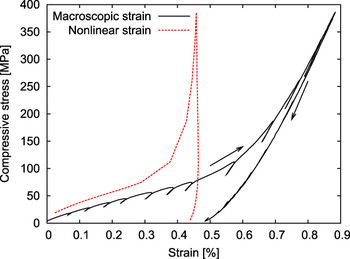
To obtain the ferroelectric hysteresis in macroscopic strain—the so-called butterfly loop (Fig. 1)—an electric field was increased and decreased stepwise. The maximum and minimum field amplitudes were ±2 kV/mm, corresponding to a field twice as high as the coercive field (E c). The effective measurement frequency was 1 mHz, and the strain was detected by an optical sensor. For the ferroelastic stress–strain hysteresis, a traditional mechanical testing setup was used where the mechanical compression was increased stepwise up to 385 MPa as described in the literature.Reference Webber, Aulbach, Key, Marsilius, Granzow and Rödel15 In this work, the direction of the electric field as well as of the compressive stress is denoted as 3-direction.
Full macroscopic ferroelectric strain hysteresis, the so-called butterfly loop, of an unpoled sample (—) and the nonlinear strain calculated by means of the electric field–dependent piezoelectric coefficient d 33 (- -).

Both the butterfly loop and the stress–strain curve contain a linear component, for example, the intrinsic piezoelectric effect and the intrinsic elasticity, respectively, and the nonlinear extrinsic contribution resulting from ferroelectric/ferroelastic switching. To separate the linear and the nonlinear contributions, additional load-dependent small-signal information is necessary. Therefore, for both the electric field (butterfly loop) and the mechanical compression experiments, additional measurements were undertaken at each stepwise field or stress amplitude. For the electric field measurements, an additional AC electric field of ±5 V/mm was applied at each DC stepwise electric field value (as described in Ref. 16) to obtain the electric field–dependent piezoelectric coefficient (d 33). The AC electric field of ±5 V/mm is in the small-signal region where only reversible processes are expected. An analogous measurement was undertaken under mechanical stress. For this measurement, partial unloading and reloading by 20% of the actual stress level at each compression step (Fig. 2) (as described in Refs. 15 and 17) provides the compressive stress–dependent linear elastic compliance (s 33).
Full macroscopic ferroelastic strain hysteresis of an unpoled sample including the partial unloading and reloading experiments (—) and the nonlinear strain calculated by means of the compressive stress–dependent elastic compliance s 33 (- -).

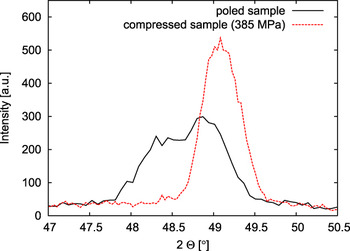
Neutron diffraction measurements during an externally applied uniaxial compressive stress were undertaken on the KOWARI instrument (400-Si-monochromator, 1.653 Å wavelength, multi wire gas 2D detector, DENEX, Germany) at the Australian Nuclear Science and Technology Organisation.Reference Brule and Kirstein18 A 100 kN load frame is used and is oriented in such a way that the compression axis is parallel to the diffraction scattering vector. In other words, the diffracting planes being measured in this geometry are normal to the compression axis such that changes in interplanar spacing or volume fraction (texture) of the planes are measured. This experiment was performed on initially unpoled samples and on samples that were already poled. To pole the samples, an electric field of 2 kV/mm was applied at 150 °C. The sample was cooled down while the electric field remained applied before it was turned off and the sample was removed at 45 °C. A (400)-Si-monochromator selects a wave length of 1.653 Å. At each compression step, the scattered intensity is counted over a 2θ range of 15° for 800 s and corrected for detector efficiency. To mount the sample on the sample stage, a preload of 100 N (corresponding to ∼4 MPa) was necessary. After an initial measurement of the scattered intensities in the preloaded state, the compressive stress was increased stepwise up to the inflection point stress of 75 MPa or a maximum stress level of 385 MPa before being decreased again. The force loading rate was 50 N/s. Figure 3 shows a section of a typical diffraction pattern with the peak belonging to the crystallographic 002 and 200 planes for a poled sample in the initial stress-free state and during compression using 385 MPa.
Section of typical diffraction patterns with the peak belonging to the crystallographic 002 and 200 planes for a poled sample initially stress free and compressed up to 385 MPa.

High-energy XRD under electric field was performed at Sector 6 of the Advanced Photon Source in the Argonne National Laboratory using a wavelength of 0.14294 Å. An area detector (MAR 345; Marresearch GmbH, Norderstedt, Germany) was used to allow the measurement of the scattered intensity at all angles in the plane perpendicular to the beam, the so-called Debye–Scherrer rings. Using this geometry, an angle of 0° is defined as corresponding to a direction approximately parallel to the electric field. The field was increased and decreased stepwise in 200 V/mm steps by a high-voltage power supply (PS350; Stanford Research Systems, Sunnyvale, CA). At each electric field step, a diffraction pattern was measured. The maximum and minimum field values were ±2 kV/mm, respectively. Similar measurements to the two diffraction measurement approaches are described in Ref. 14.
III. DATA ANALYSIS
As mentioned earlier, the strain induced by electric field or mechanical stress, S 3, can be separated into two parts—a linear component and a nonlinear component:

where the Voigt notation is used and the superscripts l and n indicate the linear and nonlinear components, respectively. Using the electric field–dependent piezoelectric coefficient d 33, the incremental linear strain response of the material to a small incremental variation of the electric field ΔE 3 at a given electric field level and at a constant stress (σ = const.) can be expressed as follows:

Similar considerations lead to the incremental linear strain response of the material at a given stress level and a constant electric field (E = const.) using the compressive stress-dependent elastic compliance s 33 and a small incremental variation of the compressive stress Δσ 3:

An integration of Eqs. (2) or (3) gives the electric field or mechanical stress–dependent linear strain of the sample  (E, σ = const) or
 (E = const, σ), respectively. Using this linear strain
 (E) or
 (σ) and the measured full macroscopic strain hysteresis S 3 (E) or S 3 (σ), the nonlinear strain as a function of the electric field or mechanical stress
 (E) or
 (σ) can be calculated by Eq. (1) and is plotted in Figs. 2 and 3, respectively. A more detailed description on how to calculate the nonlinear strain as a function of the external load can be found in Ref. 15.
To obtain the domain orientation density from the diffraction data, the proportional relation between the volume fraction of unit cells oriented in a particular direction and the diffraction peak intensities is used.Reference Jones, Iverson and Bowman19 In general, the domain orientation distribution in a tetragonal material is calculated as follows:

where Ψ is the angle between the poling direction and the direction of interest or measurement (scattering vector), and the value of f 002 is given in the unit multiples of a random distribution (mrd). I 002 and I 200 are the integrated areas of the tetragonal split peak belonging to the crystallographic 002 and 200 planes, which were obtained after fitting the diffraction peaks with profile shape functions (a Gaussian distribution function for the neutron diffraction experiments and a Pearson VII function for the high-energy XRD experiments). The 200 peak includes contributions from two crystallographic directions, 200 and 020, which are identical by symmetry.  and
 are the integrated peak areas of a randomly oriented unpoled sample. A completely oriented sample where all tetragonal c-axes are oriented parallel to the poling direction would lead to a domain orientation distribution function that decreases from f 002(0°) = 3.0 mrd to f 002(90°) = 0 mrd, with a near-step-like discontinuity at 50°.Reference Jones, Hoffman and Bowman20 An unpoled material where the tetragonal c-axes are randomly oriented would be represented by f 002(Ψ) = 1.0 mrd for all Ψ angles.
As mentioned, only the Ψ = 0° direction is recorded in the neutron diffraction experiment and all angles are measured in the high-energy x-ray experiment. In the high-energy x-ray experiment, segments of 10° in azimuthal angle (Ψ) were integrated to obtain a one-dimensional diffraction pattern (Intensity vs. 2θ), and the domain orientation density in the two directions Ψ = 0° and Ψ = 90° are considered in this work.
The theoretical maximum value of the domain orientation density, f 002(0°) = 3.0 mrd, cannot be achieved in a fully poled polycrystalline sample because of internal microstructural constraints as a result of grain boundaries and other defects.Reference Jones, Hoffman and Bowman20 Figure 3 shows a representative diffraction pattern near the 002 and 200 diffraction peaks of a poled sample, which gives a maximum experimental domain orientation density, f 002(0°) = 1.6 mrd. Under a compressive stress of 385 MPa, the position of the peaks shift to larger 2θ values (smaller lattice spacing) as a result of the intrinsic elastic compliance, and there is an obvious change in the intensity ratio of the 002 (increasing intensity) and 200 (decreasing) peaks, which demonstrates that f 002(0°) ≈ 0 mrd. This means that there are no 002 poles oriented parallel to the uniaxial stress direction.
IV. RESULTS AND DISCUSSION
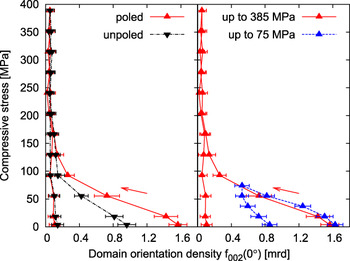
Figure 4 shows the domain orientation density [f 002 (0°)] extracted from the neutron diffraction measurements as a function of the external compressive stress; on the left, a comparison between the domain orientation density for an unpoled and for an initially poled sample is plotted. As expected, the curve for the unpoled sample starts at f 002 = 1.0 mrd. In the poled sample, the amount of 002 poles parallel to the field direction is increased and the corresponding curve starts at ∼f 002 = 1.6 mrd. This value is in good agreement with that in earlier publications.Reference Jones, Iverson and Bowman19, Reference Jones, Slamovich and Bowman21 With increasing compressive stress, the domain orientation density f 002 for both different initial states decreases nonlinearly and most of these changes take place at stresses below 150 MPa. Above 150 MPa, both samples exhibit values of f 002 ≈ 0 mrd. In this state, the majority of 002 poles are oriented perpendicular to the direction of the compressive stress regardless of the initial poling state. Although the unpoled and the poled samples show a similar final state, the nonlinear regime is more pronounced for the poled sample due to the different initial states.
The domain orientation density extracted from the neutron diffraction data as a function of the external compressive stress. On the left is a comparison of an unpoled and an initially poled sample. On the right is a comparison between two initially poled samples that were compressed up to maximum stresses of 75 and 385 MPa.

The domain orientation density of poled samples for two different maximum stress levels is plotted on the right hand side of Fig. 4. It can be seen that the measurement shows a good reproducibility within the error for small loads in the beginning of the loading cycle. For the experiment in which the maximum stress was 75 MPa, the unloading curve behaved differently from the experiment in which the maximum stress was 385 MPa, whereas there was negligible change in the unloading curve in the 385 MPa sample; the domain orientation density increased during unloading in the 75 MPa sample (i.e., from 0.5 mrd at 75 MPa to 0.9 mrd at 0 MPa). This indicates a certain volume of domains that return to having their c-axes parallel to the stress axis during the unloading cycle. This can be referred to as a backswitching process. In a sample before loading, the domain configuration is arranged in an energetically favorable way, which is related to the defect structure enforced during poling.Reference Schäufele and Härdtl5 Application of an external stress causes domain wall movement and leads to a new domain structure, which is stabilized by the applied external stress. When the external stress is removed, restoring forces recover a portion of the initial domain configuration. In the sample to which 385 MPa is applied, no backswitching is observed (i.e., from 0.1 mrd at 385 MPa to 0.1 mrd at 0 MPa). In such case, it is believed that the external stress is sufficient to overcome the restoring forces and enforce a new stable domain structure.
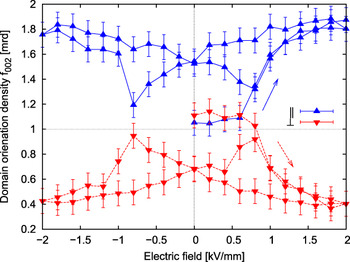
Figure 5 shows the domain orientation density calculated from the high-energy x-ray experiments as a function of the external electric field parallel and perpendicular to the 3-direction, f 002(0°) and f 002(90°), respectively. The measurement was carried out on unpoled samples, and so initially f 002(Ψ) ≈ 1.0 mrd for all angles, including the direction parallel and perpendicular to the electric field. As the electric field is increased, the domain orientation density parallel to the electric field first stays constant and then increases up to f 002(0°) = 1.7 mrd at electric fields above 0.5 kV/mm because domains with 002 poles aligned in 3-direction increase in volume fraction at these electric field amplitudes. When the electric field is removed, a decrease in the domain orientation density parallel to the electric field is observed, indicating that some backswitching takes place because the electric field history was not sufficient to completely stabilize the new domain structure. This trend continues when the electric field is applied in the opposite direction and f 002 = 1.0 mrd is again approached. As the negative electric field exceeds the coercive field, the trend is reversed and a complete butterfly loop develops.
The domain orientation density of an unpoled sample extracted from the high-energy x-ray diffraction data as a function of the external electric field parallel and perpendicular to the 3-direction.

The domain orientation density perpendicular to the electric field behaves oppositely under the application of an electric field. Above 0.5 kV/mm, f 002 (90°) decreases to the same degree as the parallel domain density f 002 (0°) increases, because an increasing volume fraction of domains with their 002 poles in 3-direction leads to a decrease in volume fraction of domains with 002 poles aligned perpendicular to the 3-direction. This behavior is comparable to the stress-dependent domain orientation density parallel to the 3-direction for an unpoled sample [Fig. 4 (left)], where the volume fraction of domains with 002 poles aligned in the observed 3-direction is decreased by the mechanical compression. In general, both the perpendicular domain orientation density during an electric field and the parallel domain orientation density during mechanical compression show a decrease with increasing load. This decrease gets more rapid with increasing amplitude of the load before saturation is reached, leading to the observed nonlinear behavior. While in the mechanical case, the saturation is reached at f 002 ≈ 0 mrd for stresses >150 MPa, in the electric case, there is a finite saturation level of f 002 (90°) = 0.4 mrd at 2 kV/mm. Although no tensile stresses can be applied in the mechanical stress experiment, both positive and negative electric fields can be applied in the electric field experiment. The latter gives the whole butterfly loop in addition to the initial poling curve.
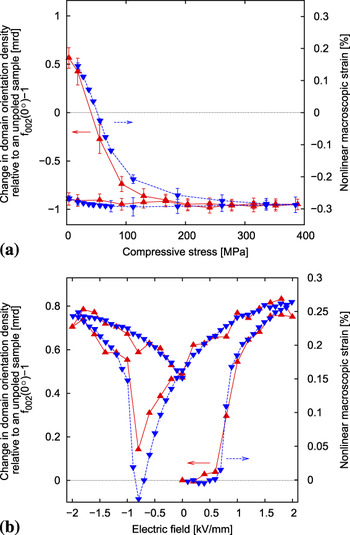
To compare the macroscopic nonlinear behavior with the domain orientation density of the PZT material, the nonlinear strain is calculated using the measured full macroscopic strain hysteresis (the stress–strain curve and the butterfly loop) and the linear contribution to this hysteresis derived by means of the electric field–dependent piezoelectric coefficient d 33 and the compressive stress–dependent elastic compliance s 33 (see Eqs. (1)–(3) and Figs. 1 and 2). This nonlinear strain is plotted in Fig. 6 relative to the strain of an unpoled sample. To compare the domain orientation density measurements to the macroscopic nonlinear behavior, the change in the domain orientation density relative to an unpoled sample (f 002 – 1) is shown with the macroscopic nonlinear behavior in Fig. 6. A positive value of the change in the domain orientation density refers to a state where more 002 poles are oriented in 3-direction compared to an unpoled sample. Similarly, a positive value of the nonlinear strain describes an elongation in 3-direction compared to the unpoled sample.

As it can be seen in Fig. 6, the domain orientation density and the nonlinear strain show the same dependence on the external load, differing only by a scaling factor, which relates the two different y-axes. Interestingly, the scaling factor of 0.3 is the same for the mechanical and the electrical properties, that is, 0.3(f 002 – 1) =  .
A change in the domain orientation density describes the volume fraction of unit cells that have interchanged their 002 and 200 poles under the influence of the external load. As a result of the tetragonal lattice distortion, the reorientation of a fraction of the material volume is coupled to the observed change in macroscopic strain. Therefore, considering extrinsic ferroelectric/ferroelastic domain wall movement, it is expected that the domain orientation density and the nonlinear macroscopic strain are coupled by a scaling factor that reflects the crystallographic lattice distortion, or the intrinsic lattice strain, that can be described by interplanar lattice distances. The lattice strain and, therefore, the scaling factor that is measured to be 0.3 in the present measurements is certainly material-dependent and is also expected to be influenced by the chemistry, defect structure, and external loading conditions.
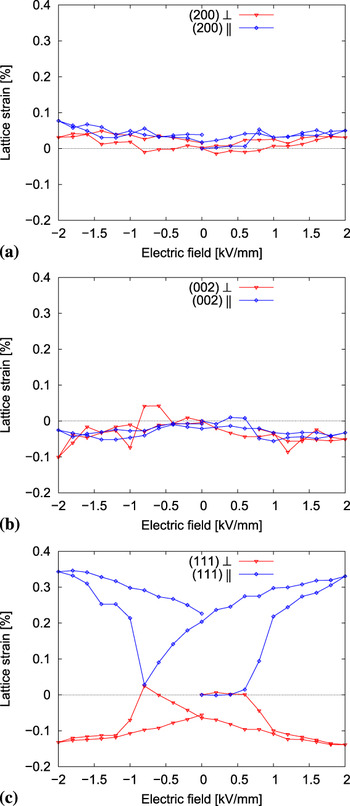
Figure 7 shows changes in the interplanar lattice distances of the PZT material associated with different lattice orientations as a function of the external electric field obtained from the orientation-dependent, high-energy XRD data. As predicted in Refs. 22 and 23, there is nearly no change in the lattice strain of the diffraction peaks belonging to the 200 and 002 planes, but significant changes in the 111 interplanar spacing, where even a remanent changes after the application of the electric field, can be observed (i.e., the unpoled sample and the poled sample show different lattice spacing). This remanent change in the interplanar lattice spacing is assumed to be a result of the structural changes caused by the electric field application, which remain even as the electric field is removed. Possible explanations for the described behavior of the interplanar lattice distances are still under discussion,Reference Jones, Pramanick, Nino, Motahari, Üstündag, Daymond and Oliver13, Reference Guo, Cross, Park, Noheda, Cox and Shirane24 but in any case it can be retained that the intrinsic lattice strain behavior is nonlinear and orientation-dependent under an external electric field. Similar measurements have been carried out under the influence of an external mechanical compression,Reference Jones, Hoffman and Vogel11 leading also to a highly nonlinear and orientation-dependent lattice strain behavior. Interestingly, this nonlinear dependence of the intrinsic lattice strain on the external load cannot be observed in the scaling factor. The changes caused on the lattice strain and, therefore, on the scaling factor by the external load are comparatively small, and the scaling factor can be used as constant during both types of external loading. This suggests the possibility to predict the full relation between the degree of domain orientation and the nonlinear macroscopic strain behavior under electrical and mechanical loading for new materials once this relation is known for one particular state of the material.
Lattice strain of the lead zirconate titanate material associated with the different lattice orientations as a function of the external electric field obtained from the orientation-dependent high-energy x-ray diffraction data.

V. CONCLUSIONS
The macroscopic strain was measured under an externally applied electric field and an externally applied mechanical stress for a commercial PZT ceramic. By means of the linear piezoelectric effect and the linear elasticity, the nonlinear contribution to the macroscopic strain was separated and compared to the domain orientation density obtained by neutron and high-energy XRD for different types of loading. The measured domain orientation density reflects changes in the volume fraction of domains with their 002 poles oriented in the direction of the external load by non-180° domain wall motion. Because of the tetragonal lattice distortion of the material, those changes are coupled to changes in the macroscopic strain. Unexpectedly, the scaling factor used to describe this relation is constant during the application of the load and is the same for both types of loading.
ACKNOWLEDGMENTS
The authors acknowledge the support for this work from the Deutsche Forschungsgemeinschaft under GR 2722/4-1, the U.S. National Science Foundation under award DMR-0746902, and the U.S. Department of the Army under award W911NF-09-1-0435. The Bragg Institute at the Australian Nuclear Science and Technology Organisation is acknowledged for provision of the neutron diffraction facilities through proposal number 1265. The assistance and cooperation of Dr. Vladmir Luzin at the Bragg Institute is also gratefully acknowledged. We also thank Dr. Doug Robinson at the Advanced Photon Source (APS) for his invaluable assistance in making the beam campaign a success. Use of the APS was supported by the U.S. Department of Energy, Office of Science, Office of Basic Energy Sciences, under contract no. DE-AC02-06CH11357.