Implications
Extensive variability in milk yield response during the acute phase (i.e. the first 24 h) of a dairy cow’s adaptation to a reduced milking frequency (from twice to once-daily milking (ODM)) has been reported. This variability was only partly explained by stage of lactation, parity and milk yield level. This study aimed to explain the remaining variability using additional traits. Among the traits tested, four that were related to mammary expansion (two for milk flow rate and one for udder teat end distances) or immunity (in-milk presence of interleukin-8 (IL-8)) influenced the cows’ responses. Combined with stage of lactation and parity and milk yield level, this new set of traits constitutes a first step towards predicting individual cow responses to the acute phase of ODM.
Introduction
Dairy cows adaptation to ODM consists of two phases, an acute phase which is followed by a chronic phase of adaptation (Davis et al., Reference Davis, Farr and Stelwagen1999). Recently, milk yield responses to a 24-h extended milking interval (24h-MI), that is the acute phase of cow’s adaptation, were shown to exhibit a substantial individual variability. This variability existed on both milk yield loss when switching cows to 24h-MI (−21.6 to +4.0 kg/day, mean=−8.1 kg/day; −52% to+22%, mean=−25.3%) and milk yield recovery when resuming twice-daily milking (TDM) (−7.6 to +20.1 kg/day, mean=+7.3 kg/day) (Charton et al., Reference Charton, Larroque, Robert-Granié, Pomiès, Leclerc, Friggens and Guinard-Flament2016). Similarly, substantial variability has been reported during the chronic phase of cow’s adaptation to ODM (milk yield losses from −8% to −50%; Claesson et al., Reference Claesson, Hansson, Gustafsson and Brannang1959; Stelwagen et al., Reference Stelwagen, Davis, Farr, Prosser and Sherlock1994). Some of the factors underlying and modulating variability in milk yield responses during the acute and chronic phases of adaptation to ODM have been reviewed by Davis et al. (Reference Davis, Farr and Stelwagen1999) and Stelwagen et al. (Reference Stelwagen, Phyn, Davis, Guinard-Flament, Pomiès, Roche and Kay2013). However, despite the interest in better understanding the early adaptive mechanisms in dairy cows mammary gland, few studies have attempted to study the factors underlying and modulating individual variability of milk yield responses to the acute phase of ODM. When 724 24h-MI challenges were implemented on 289 cows under different experimental conditions, stage of lactation, parity and milk yield level were found to influence milk yield responses (Charton et al., Reference Charton, Larroque, Robert-Granié, Pomiès, Leclerc, Friggens and Guinard-Flament2016). However, these traits did not account for all the variability within the data set. Indeed, standard deviations of milk yield loss and recovery were still half the initial value after correction for the above traits (1.9 kg/day for milk yield loss and 2.5 kg/day for milk yield recovery v. 3.9 and 4.7, respectively).
Milk yield responses to ODM are further associated with variations in numerous traits. These traits include milk composition (fat and protein content), milk proteolysis (Davis et al., Reference Davis, Farr and Stelwagen1999; Stelwagen et al., Reference Stelwagen, Phyn, Davis, Guinard-Flament, Pomiès, Roche and Kay2013) and milking parameters. Indeed, milking duration increases in response to ODM (Gleeson et al., Reference Gleeson, O’Brien, Boyle and Earley2007; Ferris et al., Reference Ferris, Frost, Mayne, McCoy and Kilpatrick2008). In addition, immunity and udder inflammation are also impacted leading to a rise in somatic cell count (SCC) in the first few days of ODM implementation (Davis et al., Reference Davis, Farr and Stelwagen1999; Stelwagen et al., Reference Stelwagen, Phyn, Davis, Guinard-Flament, Pomiès, Roche and Kay2013). Changes also take place within the mammary epithelium with an increased mammary epithelium permeability as indicated by the efflux of lactose from milk to blood (Stelwagen et al., Reference Stelwagen, Farr, McFadden, Prosser and Davis1997; Guinard-Flament et al., Reference Guinard-Flament, Gallard and Larroque2011). The traits cited above may be related to individual responses to the acute phase of ODM (24h-MI) and could help characterize adaptive differences between dairy cows.
Thus the aim of this study was to assess whether these traits were related to the variability observed in cows’ milk yield responses to the acute phase of ODM (24h-MI). We studied the association between milk yield loss and recovery to determine if cows’ responses could be gathered into profiles and if the traits cited above could be related to these profiles.
Material and methods
Experimental design
The experimental design was described in our previous paper (Charton et al. Reference Charton, Larroque, Robert-Granié, Pomiès, Leclerc, Friggens and Guinard-Flament2016). Briefly, the experiment was conducted at the INRA experimental farm of Méjusseaume in compliance with the National Legislation on Animal Care (French Ministry of Agriculture certification No. C35-275-23). Experimental design consisted in a 1-week control period when cows were milked twice daily (cTDM), then 1 day of 24h-MI (morning milking omitted) and then back to 13 days of TDM. Milk recovery was studied on days 7 to 13 after 24h-MI (pTDM) in order to take into account the time for the milk production to stabilize after resuming TDM. Cows were milked at 0730 and 1630 h. during cTDM and pTDM and at 1630 h on the 24h-MI day.
In total, 724 24 h-MIs were implemented on 289 Holstein dairy cows, with 216 cows undergoing more than one 24h-MI. These 724 24 h-MIs were split into 10 cohorts (32<n<159) according to year, month, feeding and housing conditions. Cows differed in parity, stage of lactation and age at first calving within and among cohorts.
Measurements, sampling and analyses
Milk proteolysis, udder expansion and immune traits were measured in the last three cohorts (n=96). Briefly, these traits were related to milk yield and composition, milk proteolysis (milk plasmin (PL) and plasminogen (PLG) activity and ‘peptides’ mapping), dry matter intake (DMI), udder distension (distances between teat ends), milking parameters (milking duration, average and peak milk flow rates, amount and proportion of milk collected at 1 and 2 min), mammary epithelium permeability (lactose concentration in blood plasma), mammary inflammation (milk SCC and IL-8 presence in milk) and systemic inflammation (blood plasma haptoglobin) and complete blood count (CBC).
Distance between udder teat ends was measured using a calliper square at 1500 h (1 h before evening milking) 2 days before 24h-MI and on 24h-MI day.
Dry matter intake was calculated from the weighed total mixed ration distributed in individual troughs twice a day at 0800 and 18:00 h and from feed refusals weighed daily. Diet consisted of 65% of corn silage, 16% of energy concentrate, 10% of dehydrated alfafa, 8% of formaldehyde-treated soybean meal and 1% of minerals on a dry matter basis. The diet was formulated to meet the estimated energy and protein requirements for cows milked twice-daily (INRA, 2010).
Milk
Milk yield and milking parameters (including milking duration and average milk flow rate, see Supplementary Table S1) were recorded at each milking in the milking parlour (rotary milking parlour, milk meter MM25; DeLaval, Elancourt, France). Milk fat, protein and lactose concentrations were determined from milk samples collected at both milkings, 3 days a week (on Tuesdays, Wednesdays and Thursdays) during cTDM and pTDM periods and on the 24h-MI day. Somatic cell count was measured once a day at the same timepoint days. Milk fat, protein and lactose concentrations were determined by IR analysis (Milkoscan; Foss Electric, Hillerød, Denmark), and SCC was determined on a Fossomatic cell counter (Foss).
Samples for milk IL-8 were collected on day 2 before 24h-MI at evening milking only. The milk was skimmed (by removing the supernatant fat pellet after centrifugation at 3000×g for 10 min at 4°C) and stored at −20°C until analysis. Interleukin-8 was quantified by ELISA as described in Rainard et al. (Reference Rainard, Riollet, Berthon, Cunha, Fromageau, Rossignol and Gilbert2008).
Milk proteolysis was examined based on PL/PLG activity and ‘peptide’ mapping traits. Milk proteolysis analysis was performed on milk collected at evening milking 2 days before and on the day of the 24h-MI. Plasmin and PLG activities were determined using an adaptation to microplate (Biotek Synergy Mx) of Rollema’s spectrophotometric procedure (Rollema et al., Reference Rollema, Visser and Poll1983) as described by Bugaud et al. (Reference Bugaud, Buchin, Coulon, Hauwuy and Dupont2001). The pyroGlu-Phe-Lys-pNA, HCl (pNAPEP 1703; Cryopep, Montpellier, France) chromogenic peptide substrate was used for better specificity of detection of PL activity (van Asselt et al., Reference van Asselt, Sweere, Rollema and de Jong2008). Total activity (with urokinase) was corrected by a blank value obtained by replacing sample with 20 µl of the citrate buffer. Plasminogen activity was calculated by subtracting PL activity (without urokinase) from total activity (PL+PLG) (with urokinase). Each milk sample was extracted once and deposited in triplicate per microplate, and repeated on 3 different days. Samples from a cow before and after suppression of one milking were analyzed consecutively within the same plate.
For ‘peptides’ mapping, a milk-soluble fraction (80 µl) was prepared twice by precipitation of caseins at pH 4.6 (MSF) (IDF 29-1 ISO 17997-1, 2004) and analyzed by RP-HPLC using a Zorbax 300 SB-C18 column (150×4.6 mm, 3.5 µm, 300 Å) and similar precolumn (12.5×4.6 mm) held at 40°C (Dionex-STH 585 column oven). Gradient elution was performed at 1 ml/min (Dionex P580 HPG pump) using solvents A (0.100% v/v trifluoroacetic acid in 18.2 MOhms water) and B (0.105% TFA/80% acetonitrile/20% water) as follows: 6.5% B (0 to 1 min), 32% (at 16 min), 44% (24 to 26 min), 48% (at 33 min), 60% (at 39 min), 100% (47 to 48 min) and back at 48 min to equilibration at 6.5% B (5 min). The signal was recorded at 205 nm (2 Hz) (Dionex Ultimate 3000 DAD and Chromeleon software version 6.80) with regular checks for absence of ghost peaks (reagents or column). A home-made standard sample (mixture of MSF) was regularly injected to check the sustainability of the resolution. Excluding the distal whey protein peaks (not computed) with an elution time of 35 min, we found 143 peaks ranging up to 500 mAU, but only 35 predominant peaks common to all profiles were considered in this analysis. Peaks between 190 and 300 diode array spectra were found characteristic of peptidic substances (data not shown). The three successive zones of peak elution (Z1, Z2 and Z3) were designated. Peptide elution varied from zone Z1 (most hydrophilic substances) to zone Z3 (most hydrophobic substances). The Z3 ‘peptide’ mapping zone (26 to 35 min, 35% to 38% acetonitrile in eluent) contains peptidic fractions resulting from the primary hydrolysis of β- and α-s2 caseins by PL (Innocente et al., Reference Innocente, Biasutti and Blecker2011), particularly proteose–peptones that are the largest soluble peptides produced by PL activity on β-caseins (Schaar, Reference Schaar1985). The zone Z1 (peaks eluting between 2 to 16 min and 5% to 25% acetonitrile) corresponds to peptidic material produced by non-specific proteolytic activity of bacterial source (Datta and Deeth, Reference Datta and Deeth2003; Le et al., Reference Le, Datta and Deeth2006). The Z2 zone (16 to 26 min, 25% to 35% acetonitrile) contains probably peptidic material both from bacterial source and from the secondary hydrolysis of proteose–peptones.
Blood
Blood samples were collected from the coccygeal vein at 1500 h 2 days before 24h-MI and on the day of 24h-MI (1 h before the evening milking). Samples for blood haptoglobin and blood lactose were collected into 10-ml heparinized tubes and centrifuged at 3000×g for 10 min at 4°C. The plasma was then removed and samples were stored at −20°C until analysis.
Plasma lactose concentration was measured using a colorimetric enzymatic reaction (kit for lactose/d-galactose; Roche R-BIOPHARM GmbH, Darmstadt, Germany) on a multiparameter analyzer (Konelab 20i; KONE Instruments Corporation, Espoo, Finland). Plasma haptoglobin concentration was determined by measuring peroxidase activity at 600 nm (kit Tridelta PHASE Haptoglobin Assay TP-801; Tridelta Development Ltd, Maynooth, Ireland) using the same analyzer.
Samples for CBC were collected into EDTA tubes (Vacutainer; Unitech Ltd, Dublin, Ireland), then immediately stored on ice and transported for analysis. These samples were analyzed for white blood cells count, total red blood cells count, haematocrit, haemoglobin, mean corpuscular volume, mean corpuscular haemoglobin concentration and platelet number using an automated haematological analyzer (Scil Vet abc; Scil Animal Company GmbH, Aldorf, France). White blood cells count differentials including polymorphonuclear neutrophil, eosinophil and basophil, lymphocytes and monocytes were determined using the May–Grünwald Giemsa staining protocol as described in Hayhoe and Flemans (Reference Hayhoe and Flemans1970).
Calculations
For cTDM and pTDM periods, milk yield and composition, milking parameters and DMI were averaged over 1 week. Milk yield loss (kg/day) was computed as the difference between 24h-MI and cTDM. Relative milk yield loss (%) was calculated as milk yield loss (kg/day) divided by cTDM milk yield, multiplied by 100. Milk yield recovery (kg/day) was computed as the difference between pTDM and 24h-MI. Milk recovery:loss ratio (%) was computed as milk yield recovery (kg/day) divided by milk yield loss (kg/day), multiplied by 100 as described in Charton et al. (Reference Charton, Larroque, Robert-Granié, Pomiès, Leclerc, Friggens and Guinard-Flament2016). Plasma lactose was log-transformed due to the non-normal data. Interleukin-8 status was classified as presence or absence. For each trait, absolute variation was calculated as the difference between the measure during the 24h-MI and the measure during cTDM, and relative variation was calculated as the absolute difference divided by the measure during cTDM multiplied by 100, except for milk IL-8 for which only cTDM values were available.
Statistical analysis
All statistical analyses were performed using R software (R Core Team, Reference Stelwagen, Politis, White, Zavizion, Prosser, Davis and Farr2014; http:/www.R-project.org).
Identification of traits related to milk yield responses to a 24h-MI
Effect of stage of lactation, parity, milk yield level and milk year on milk yield responses had already been estimated using the linear model on the 724 24h-MI data set (model published by Charton et al., Reference Charton, Larroque, Robert-Granié, Pomiès, Leclerc, Friggens and Guinard-Flament2016). The resulting corrected responses were used as the dependant variables in a separate linear regression model to estimate the relation between these milk yield responses and milk proteolysis, udder expansion and immune traits (n=96, except milk yield recovery:loss ratio; n=94).
Traits were then selected using a backward linear model selection method and only the traits with a significant effect (P<0.05) on milk yield responses were kept. Some traits were not tested due to the low number of observations available (as is the case for CBC traits, n=65) or their strong correlations with other traits within the same trait family. Thus, the traits tested were milk PL, milk PLG and PLG:PL ratio for milk proteolysis, average evening milk flow rate for milking parameters, the sum of udder teat distances for udder distension, plasma lactose concentration for mammary epithelium permeability, blood haptoglobin for systemic inflammation and milk IL-8 and somatic cell score (SCS) for udder inflammation.
Identification and characterization of response profiles
Response profiles were determined using a principal component analysis (PCA) followed by a hierarchical clustering on principle components (HCPC) using the PCA and HCPC functions in R package FactoMineR (Lê et al., Reference Lê, Josse and Husson2008). Principal component analysis was first implemented in order to reduce dimensionality by eliminating low variance dimensions before clustering. Principal component analysis was built on the following variables: initial milk yield and milk yield responses to 24h-MI (losses in kg/day and %, recoveries in kg/day and recovery:loss ratio in %) from the previous sub-data set (n=94) and data were scaled to unit variance. Data from one cow that was an outlier on milk yield recovery:loss ratio was removed (n=93 observations). Hierarchical clustering on principle components was then used to identify the cluster of cows with similar milk yield responses. Clusters were subsequently related to the previously identified traits by comparing distribution of the variables between clusters using Fisher’s exact test for categorical traits (differences considered significant at P<0.05) and the following linear model (2) for continuous traits:
 $$Y_{m} {\equals}\mu {\plus}cluster_{m} {\plus}{\epsilon}_{m} $$
where Y m is dependent variable (milk yield response or environmental factor or trait), µ is the mean, the fixed effect is cluster m and ε m is residual error associated with each observation. Results for fixed effects in models were expressed as least-squares means and computed using the lsmeans package (Lenth, Reference Lenth2014). Differences were considered significant at P<0.05.
Results
Milk yield losses when switching cows to the 24h-MI averaged 8.1 kg/day (25.3%) and milk yield recoveries when resuming TDM averaged 7.3 kg/day (recovery:loss ratio of 91.3%) (n=96). Implementing the 24h-MI led to changes in milk proteolysis, udder distension, milking parameters, systemic inflammation and CBC. These changes are described in the Supplementary Table S1.
Identification of traits related to milk yield responses to a 24-h milking interval
Only four traits had a significant effect on corrected milk yield responses (Table 1). Indeed, milk yield loss (in kg/day and %) and milk recovery (in kg/day) were significantly explained by the relative increase in sum of udder teat distances and initial average milk flow rate. Initial milk IL-8 status explained only milk yield loss and recovery in kg/day. The increase in average milk flow rate (in kg/min) explained only milk yield loss in %. Taken together, these traits explained 37.2%, 32.8% and 27.1% of variability for milk yield loss expressed in kg/day and % and milk recovery in kg/day, respectively. None of the traits tested were significantly correlated to milk yield recovery:loss ratio.
Results of three multivariable regression models, with the dependant variables (absolute and relative milk yield loss and milk recovery (n=96) corrected for stage of lactation, parity, milk yield level and effect of the dairy cow) shown in the first column. Coefficients from the model (relative increase in sum of teat distances, initial evening milk average flow rate and increase in evening milk average flow rate) and effect of initial milk interleukin presence or absence on the dependant variables are displayed in columns

24h-MI=24-h milking interval; cTDM= control week of twice-daily milking.Values in brackets:
 $\eta _{i}^{2} {\equals}{{SS_{{Mi}} } \over {SS_{{Mi}} {\plus}SS_{T} }}$
, %; partial
 $\eta _{i}^{2} $
represents the proportion of variance unexplained by the remainder of the model that is explained by the predictor.
1 Difference between 24h-MI and cTDM milk yields.
2 Difference between 24h-MI and cTDM milk yields divided by cTDM milk yields (×100).
3 Difference between 24h-MI and pTDM3 milk yields.
4 Increase in sum of udder teat distance.
5 Initial evening milk average flow rate.
6 Increase in evening milk average flow rate.
7 Initial milk interleukin-8.
8 Absence.
9 Presence.
10 Root mean square error.
***, **, * and NS: significantly different from 0 at P<0.001, P<0.01, P<0.05 and non-significant at P<0.05, respectively.
The relative increase in sum of udder teat distances, the initial average milk flow rate and the absolute increase in average milk flow rate were not significantly correlated (P>0.05; results not shown). As indicated by the partial
 $\eta _{i}^{2} $
values (Table 1), initial average milk flow rate was the most informative trait for explaining milk yield loss and recovery (kg/day), and increase in udder teat distance was the most informative trait for explaining relative milk yield loss. Interleukin-8 status during cTDM and increase in average milk flow rate were less informative.
As indicated by the sign of the effects, higher initial average milk flow rate and lower increase in the sum of udder teat distances correlated with greater milk yield loss and recovery. Presence of IL-8 in milk during cTDM reduced milk yield loss and recovery (in kg/day). Higher increases in average milk flow rates (kg/min) correlated with lower milk yield losses (%).
Identification and characterization of response profiles
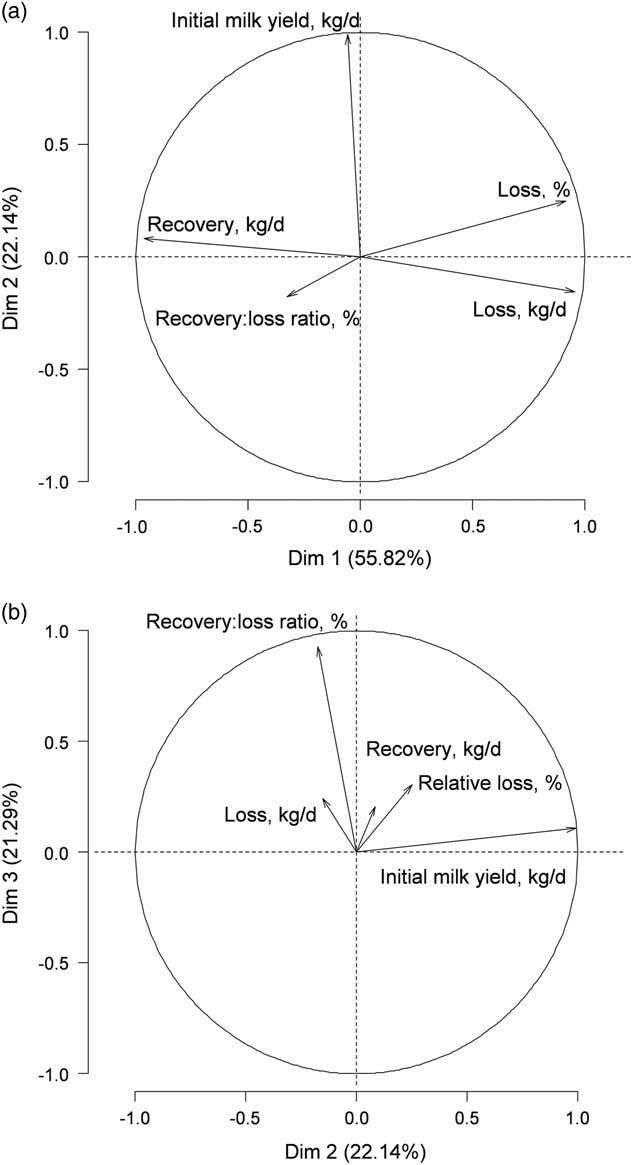
The PCA was built on the following variables: initial milk yield and milk yield responses to 24h-MI (losses in kg/day and %, recoveries in kg/day and recovery:loss ratio in %). The first three dimensions were found sufficient to explain 99% of the variability in the data set (55.8%, 22.1% and 21.3% for dimensions 1, 2 and 3, respectively; Figure 1). Dimension 1 opposes cows showing high milk yield losses and high milk yield recoveries with cows showing low milk yield losses and low milk yield recoveries, as the milk yield losses are negative values. The most contributive variables were initial milk yield for dimension 2 and milk recovery:loss ratio for dimension 3.
Variables factor map of the principal component analysis (PCA) built on the control period (cTDM) milk yield and on milk yield responses in dairy cows to the 24-h milking inteval (24h-MI). Dimensions are defined as the linear combination of the variables used to build the PCA that explain the largest possible variance in the data set given two restrictions: (1) the vector of linear weights defining each dimension must be of length 1; and (2) the dimensions should not be correlated with each other (and so orthogonal). Arrows represent the projection of each variable with the dimensions: the longer and the closer they are with the dimension, the more they are correlated with it. Figure (a) charts the projection of the variables on dimensions 1 and 2 (Dim 1 and Dim 2, respectively). Figure (b) charts the projections of the variables on dimensions 2 and 3 (Dim 2 and Dim 3, respectively).

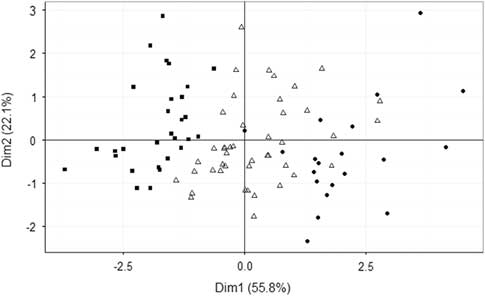
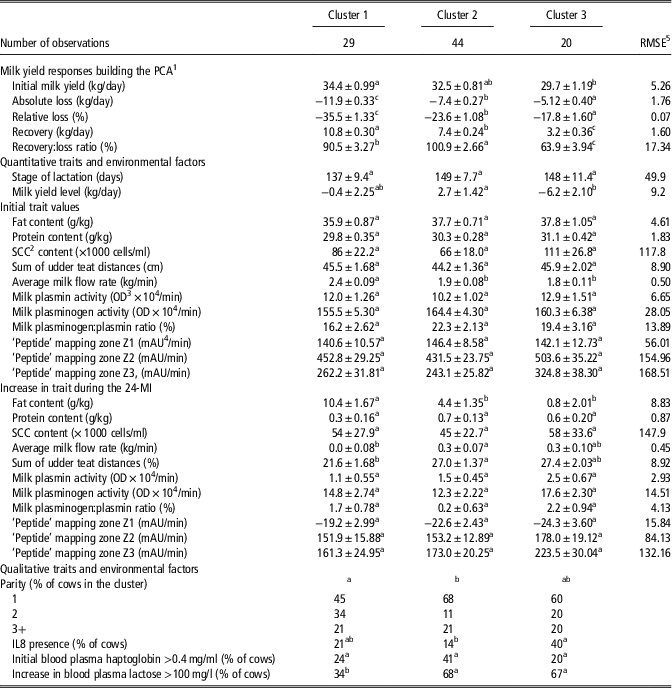
Clustering provided three different mean profiles of cows on the basis of yield responses (Table 2; Figure 2). Cluster 2 gathered a higher number of cows (n=44) than clusters 1 (n=29) and 3 (n=20). Cows in cluster 1 had the highest average initial milk yield (not different from cluster 2), plus the highest milk yield loss during the 24h-MI (absolute and relative) and the highest milk yield recovery when resuming TDM. They managed to recover almost all (90.5% on average) of the milk they had lost, but still less than cluster 2 (101%). Cows in cluster 3 had the opposite average response profile characterized by a low initial milk yield (similar to cluster 2) but also the lowest milk yield losses, recovery yields and rates (63.9%). Cows in cluster 2 had an intermediate average profile as far as milk yield loss and recovery (kg/day) are concerned. However, cluster 2 is the only one to show an average full recovery (101%) of milk lost during the 24-MI when switched back to TDM.
Projection and clustering of the individuals (dairy cows) based on the results of the principal component analysis (see Figure 1 for construction and dimensions explanation). Symbols represent cows in cluster 1 (■, n=29), cluster 2 (∆, n=44) and cluster 3 (●, n=20).

Characteristic yield responses and associated environmental factors, qualitative traits and quantitative traits of the three dairy cow profiles identified by clustering the yield responses (see Figure 2)

1PCA=principal component analysis; 2SCC=milk somatic cell count; 3OD=optical density; 4mAU=milli absorption units defined as 1 AU/1000; 5RMSE=root mean square error.
Quantitative traits: least-squares means±standard error of the mean (SEM); qualitative traits: Fisher’s exact test.
a–c Quantitative traits and environmental factors: within each row, values with different superscript letters differ significantly (P<0.05).
a–b Qualitative traits and environmental factors: within each line, values with different superscript letters differ significantly among clusters (P<0.05).
Clusters were then characterized using stage of lactation, parity, milk yield level, milk composition and proteolysis, udder expansion and immune traits. Clusters 1, 2 and 3 did not differ significantly for stage of lactation, initial milk fat, protein and SCC concentrations and proportion of cows with blood plasma haptoglobin >400 mg/ml. A first overview clearly showed that clusters 2 and 3 shared roughly more similarity than with cluster 1. Examination of the other traits found that cluster-1 cows showed a higher initial milk flow rate, a greater increase in milk fat content and a lower proportion of cows with blood plasma lactose increasing to above 100 mg/l during the 24h-MI than cluster-2 and cluster-3 cows. Cluster 1 also differed from cluster 2 by a lower proportion of primiparous cows, increased milk flow rate and increased relative distance between teat ends during the 24h-MI. Cluster 3 was not different from cluster 1 and 2 on these parameters. Cluster 3 differed from cluster 2 by a lower milk yield level and a higher proportion of cows with presence of IL-8 in milk during cTDM whereas cluster 1 was not different from cluster 2 and 3 for these two parameters. Moreover, cTDM ‘peptide’ mapping Z2 and Z3 zones peaks were numerically higher in cluster 3 compared with clusters 1 and 2, but did not differ significantly. Plasmin and PLG, PLG:PL ratio, and mapping zones Z2 and Z3 increased more for cluster 3 during the 24h-MI compared with clusters 1 and 2, but did not differ significantly either.
Discussion
The milk yield losses and recoveries observed on the present subdata set (n=96) are consistent with those previously described by Charton et al. (Reference Charton, Larroque, Robert-Granié, Pomiès, Leclerc, Friggens and Guinard-Flament2016), when calculated from the whole 724-observation data set, that is 6.3 kg/day (21.3%) for milk yield losses and 4.8 kg/day for milk recoveries (recovery:loss ratio of 85.7%).
The milk accumulation that occurs in the udder during the acute and chronic phase of ODM triggers numerous adaptive mechanisms, both in the udder itself but also at whole-cow level (Davis et al., Reference Davis, Farr and Stelwagen1999; Stelwagen et al., Reference Stelwagen, Phyn, Davis, Guinard-Flament, Pomiès, Roche and Kay2013). The traits available in our data set were related to either physiology and immunity or behaviour. The first part of this discussion focusses on determining whether some of these traits influenced the milk yield responses to 24h-MI and how they influenced this response. The second part of this discussion focusses on gaining a comprehensive insight on the association between traits and milk yield responses to 24h-MI.
Identification of traits related to cow’s milk yield responses to a 24-h milking interval
In all, three traits reflecting physiological adaptive mechanisms (initial average milk flow rate, increase in average milk flow rate and increase in sum of udder teats distance) and one immune trait (initial milk IL-8 status) were related to 24h-MI milk yield responses corrected for effects of stage of lactation, parity, milk yield level and milk year. Although the three physiological traits (continuous data) were not correlated and provided independent information, these four traits did not explain more than 37% of the remaining variability in the data set. Other traits could have been considered to provide complementary information. In particular, residual milk yield, that has been reported to vary between 10 and 15% of the total milk volume and to be positively associated with milk yield losses was not estimated in the present study (Brandsma, Reference Brandsma1978; Davis et al., Reference Davis, Farr and Stelwagen1999 and Reference Davis, Turner, Obolonkin, Tiplady, Spelman and Phyn2015). Its individual variability could have been used as a complementary trait to provide insight into the between-cow variation of milk responses to the 24h-MI. In addition, incomplete milking due to insufficient milk ejection occurring after extended milking interval could be a potential source of errors in milk yield at the 24h-MI milking. This could have contributed to the relatively low level of variability explained by the model. Indeed, when comparing day 1 of ODM to 3-week of ODM Charton et al. (Reference Charton, Guinard-Flament, Lefebvre, Barbey, Gallard, Boichard and Larroque2018) observed a high correlation between their respective milk yield (0.86) but a greater standard deviation for day 1 (4.46 v. 4.22 kg/day, respectively).
To our knowledge, the sum of udder teat distances has been scarcely if ever used in describing the individual variability of responses to extended milking intervals. Its variation has been reported to provide reliable information about udder distension (Miller et al., Reference Miller, Fulton, Erez, Williams and Pearson1995). Change in sum of udder teat distance occurring during 24-h milk accumulation results from both variation in degree of udder filling and udder compliance. The relationship between udder expansion and milk flow rate might be less intuitive. Milk ejection occurs when oxytocin release causes the contraction of myoepithelial cells surrounding mammary alveoli. This contraction forces alveolar milk into the larger mammary ducts and the cistern, eliciting an increase in intra-mammary pressure (IMP) up to a peak that is specific to each individual (Gorewit et al. Reference Gorewit, Wachs, Sagi and Merrill1983; Bruckmaier & Blum, Reference Bruckmaier and Blum1998). Milk flow rate is positively correlated with milk yield, but a high milk production has also been reported to limit ejection efficiency by limiting the transfer of milk from the alveolar to the cisternal compartment (Rathore, Reference Rathore1976; Mayer et al., Reference Mayer, Bruckmaier and Schams1991; Tančin et al., Reference Tančin, Ipema, Hogewerf and Mačuhová2006). The tone of smooth muscle in teat and on the quality of the milk ejection reflex are also of substantial influence in determining the milk flow rate (Pfeilsticker et al., Reference Pfeilsticker, Bruckmaier and Blum1995). Thus, all other things being equal, a higher milk flow rate during milking could indicate either a reaction to a higher quantity of milk stored in the udder or a higher oxytocin-induced increase in IMP due to a lower ability of the udder to expand during milk accumulation, associated or not with an elevated tone of smooth muscle in the teat.
Here, cows with higher average milk flow rates during the control period showed higher milk yield losses and recoveries. In addition, cows whose average milk flow rate and udder teat distances increased less during the 24h-MI also lost more milk. This result might indicate that a less compliant udder characterized by high milk flow rate values or variations would show a larger reduction in milk yield in response to 24h-MI. However, this assumption remains to be investigated and does not provide clear evidence of causal relationships between milk flow rate and milk yield losses. Milk flow rate variations in response to 24h-MI could be either a cause or a consequence of the milk yield loss. When the mammary gland is not compliant, that is unable to distend, production would become more downregulated in response to a 24-h extended milking interval, leading to the subsequent lower increase in milk flow rate observed here. Conversely, we can assume that if the cow loses more milk, then less milk accumulates in its udder, leading to a lower increase in milk flow rate, induced either by the reduced milk yield or by a lower increase in IMP, or both.
Initial udder health status has already been reported to influence cows’ milk yield response to extended milking intervals. When implementing ODM, Holmes et al. (Reference Holmes, Kamote, Mackenzie and Morel1996) showed a higher decrease in milk yield in cows with high initial SCC levels. Here, there was no effect of initial SCC level on milk responses to the 24h-MI. However, the presence or not of IL-8, a small cytokine that triggers neutrophil recruitment during inflammation (Rainard et al., Reference Rainard, Riollet, Berthon, Cunha, Fromageau, Rossignol and Gilbert2008), was related to milk yield loss and recovery (in kg/day). Both milk yield loss and recovery (in kg/day) were lower in cows showing an initial presence of IL-8 in the milk. Lengthening the milking interval is known to have more adverse effects on milk yield responses in cows that already have an initially inflamed udder (ODM applied in late lactation, Holmes et al., Reference Holmes, Kamote, Mackenzie and Morel1996). The lower milk yield recovery observed here in cows exhibiting initial udder inflammation was thus entirely expected. However, the lower milk yield loss was unexpected. This result may be related to initial level of milk yield as discussed in the second part of the discussion.
To conclude, milk yield responses of cows switched to a 24h-MI are influenced by the traits identified in Charton et al. (Reference Charton, Larroque, Robert-Granié, Pomiès, Leclerc, Friggens and Guinard-Flament2016) and by traits related with udder expansion and inflammatory status. The second part of the discussion focusses on the determining the association between these traits and the milk yield responses to the 24h-MI using a PCA followed by hierarchical clustering.
Identification and characterization of response profiles to a 24-h milking interval
In total, three distinct milk yield response profiles to the 24h-MI emerged from clustering. These profiles were characterized by both the previously identified traits (stage of lactation, parity and milk yield level; Charton et al., Reference Charton, Larroque, Robert-Granié, Pomiès, Leclerc, Friggens and Guinard-Flament2016) and the additional milk proteolysis, udder expansion and immune traits. Cows from cluster 1 differed from cows of clusters 2 and 3 by showing a higher milk flow rate during the control period and a lesser increase in both milk flow rate and sum of udder teat end distances in response to the 24h-MI. Proportion of cows showing an increase in blood plasma lactose above 100 mg/l on the 24h-MI was also lower in cluster 1 than clusters 2 and 3. As blood plasma lactose has been suggested as an indicator of the resistance of mammary epithelium to udder distension (Guinard-Flament et al., Reference Guinard-Flament, Gallard and Larroque2011), its lower increase might indicate that cluster 1 cows mammary epithelium was less impaired by the milk accumulation occurring during the 24h-MI or that less leakage of lactose from milk to blood occurred due to a strong downregulation of milk secretion (Albaaj et al., Reference Albaaj, Marnet, Hurtaud and Guinard-Flament2018).
The variations of these traits lead to two interpretations: cluster-1 cows showed a higher milk yield loss due to a less compliant udder or had a lesser udder distension due to their substantially reduced milk accumulation. The substantial milk yield losses observed in cluster 1 were also associated with a higher increase in milk fat content compared with clusters 2 and 3, which could be due to a concentration effect caused by the lower milk yield (Stelwagen et al., Reference Stelwagen, Phyn, Davis, Guinard-Flament, Pomiès, Roche and Kay2013). Despite their higher milk yield losses, cluster-1 cows almost completely recovered the milk they had lost, that could reflect less udder damage (as indicated by their lower blood plasma lactose increase during the 24h-MI).
Cluster 2 cows milk yield losses (kg/day and %) and recoveries (kg/day) was intermediate between clusters 1 and 3. However, cluster 2 cows showed more similarity across traits with cluster 3 than with cluster 1. In particular, cluster 2 and 3 included a higher proportion of primiparous cows than did cluster 1. The high udder expansion and the highest increase in mammary epithelium permeability observed in cluster 2 and 3 might thus result from a greater udder plasticity during the first months of lactation in primiparous cows (Charton et al., Reference Charton, Larroque, Robert-Granié, Pomiès, Leclerc, Friggens and Guinard-Flament2016). However, milk yield responses of cluster-2 cows differed substantially from cluster-3 cows on recovery:loss ratio. Indeed, cluster-2 cows, characterized by both a high proportion of primiparous cows and an uninflamed udder (as indicated by a low initial occurrence of IL-8 in milk), recovered on average completely the milk they had lost. In contrast, cluster-3 cows recovered only 63.9% of their lost milk. The impaired milk yield recovery:loss ratio in cluster 3 compared with cluster 2 might originate from an initially inflamed udder, as suggested by a higher occurrence of initial milk IL-8 in cluster 3. The lower initial milk yield, lower estimated milk yield level and higher (although not significant) initial milk SCC in cluster 3 than in clusters 1 and 2 cows strengthen this assumption. However, in the IL-8 gene polymorphism reported in Chinese Holstein dairy cows, the KK allele, associated with the highest IL-8 blood mRNA levels was positively associated with milk yield and milk protein content, but most importantly with significantly lower least square means of SCS than the KA and the AA alleles (Chen et al., Reference Chen, Yang, Ji, Mao, Chen, Li, Wu, Wang and Chang2011). The relationship between blood and milk IL-8 and whether milk IL-8 may constitute an alternative or complementary indicator to SCC for udder inflammation thus requires further investigation. Although no significant difference was evident in this study, cluster 3 might also differ from other clusters on the basis of milk proteolysis. Indeed, the higher initial Z3 and Z2 peaks (containing products of respectively primary and secondary hydrolysis of β- and α-s2 caseins by PL) in cluster 3 could indicate a higher activity of milk PL in these cows. The higher increase in milk PL, PLG and ‘peptide’ mapping zones Z3 and Z2 during the 24h-MI might also be linked to the presumably initially inflamed state of the udder in these cows. Indeed, Stelwagen et al. (Reference Stelwagen, Davis, Farr, Prosser and Sherlock1994) reported that increases of PL and PLG activity were positively correlated with bovine serum albumine and plasma lactose, two indicators of mammary epithelium permeability. Initial alteration in the mammary epithelium due to an inflammatory status might thus have facilitated the influx of PL and PLG from blood to milk, causing the higher Z3 peaks.
In conclusion, this study attempted to use traits known for their influence in milk responses to ODM in order to gain a more comprehensive picture of cow’s responses to a single 24-h extended milking interval. These new traits concerned udder expansion estimated using teat end distances, milk flow rate during milking and udder inflammation status based on IL-8 (presence of absence) in milk. Clustering allowed a first approximate but original study of the association between these traits and the milk yield responses. We found three profiles of mammary gland adaptability in terms of milk yield loss and recovery responses to the 24h-MI. Interestingly, these profiles were significantly associated with the immune and physiological traits identified above.
These results provide good basic knowledge to serve as a starting point for further investigation into the biological meaning of these traits. Identifying factors related to milk yield responses to the lengthening of milking interval could also have practical implications for example for farmers wishing to select individuals showing a tolerance to extended milking intervals. This new set of traits paired with the previously identified traits estimated on a larger data set constitutes a first step towards predicting individual cow responses to a 24h-MI. Confirming the clustering results outside of the present data set would also constitute an interesting further work.
Acknowledgements
The authors thank the Association GALA (Janzé, France) for providing financial support for milk interleukin-8 analysis. The authors thank A. Mottin and all the staff at the INRA experimental farm of Méjusseaume for their help with animal care and handling. The authors also thank P.-G. Marnet for proofreading the discussion, G. Théaud and M. Fargetton for help in data collection, and the laboratory technicians (F. Revardeau (INRA-URTAL)) and S. Daré-Michelot (INRA-UMR PEGASE) for their help on analyzing the samples. This study is part of the first author’s PhD thesis.
Declaration of interest
None.
Ethics statement
Experiments were performed in compliance with the national legislation on Animal Care (French Ministry of Agriculture certification N°. C35-275-23).
Software and data repository resources
None.