Introduction
Pathological gambling (PG) is a widespread psychiatric condition with deleterious consequences on the personal and social life of the patient. The prevalence of PG estimated in the US population ranges between 1% and 2% (Welte et al. Reference Welte, Barnes, Tidwell and Hoffman2008), and the recent emergence of online gambling has inflated this public health problem in many countries (Griffiths et al. Reference Griffiths, Wardle, Orford, Sproston and Erens2009). During the past 10 years, biobehavioral approaches (Goudriaan et al. Reference Goudriaan, Oosterlaan, de Beurs and Van den Brink2004; Clark, Reference Clark2010; van Holst et al. Reference van Holst, van den Brink, Veltman and Goudriaan2010) have led to a myriad of results showing that PG shares many genetic factors, behavioral features (such as tolerance, withdrawal or craving) and decision-making disturbances (Brand et al. Reference Brand, Kalbe, Labudda, Fujiwara, Kessler and Markowitsch2005; Ledgerwood et al. Reference Ledgerwood, Orr, Kaploun, Milosevic, Frisch, Rupcich and Lundahl2012) with substance use disorders (SUD). Within this framework, PG is often considered as a behavioral addiction and is studied as such by psychologists and neuroscientists (for a review see Potenza, Reference Potenza2008).
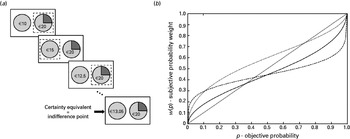
Similarly to SUD, PG is characterized by compulsive behavior (repetitive betting) in the face of negative consequence (gambles with negative expected values inevitably lead to bankruptcy in the long term). Why do pathological gamblers persist in gambling despite overall negative pay-offs? This crucial question deserves to be investigated from an economic point of view. Within the field of behavioral economics, researchers try to understand how and why humans deviate from the ‘rational’ utility-maximizing norm, by analyzing behavior in term of preferences rather than performance. The pioneering and well-known study of Kahneman & Tversky (Reference Kahneman and Tversky1979) showed that humans tend to overweight low probabilities and underweight high probabilities when confronted with risky prospects (Fig. 1). This ‘nonlinear transformation of the probability scale’ is modeled mathematically using a ‘probability weighting function’ that consists of an analytical formula linking objective and subjective probabilities, the latter being deduced from choice behavior (Tversky & Kahneman, Reference Tversky and Kahneman1992). Several formulas have been proposed, and the most widely used at present has two parameters (Lattimore et al. Reference Lattimore, Baker and Witte1992), one measuring distortion (i.e. non-linearity of subjective probability weights) and the other elevation (i.e. global overweighting of risky options).
Experimental procedure and hypothesized behavior. (a) At the beginning of each trial, a subject had to make a choice between a gamble and a sure amount of money. If the sure option was chosen, its amount was decreased in the following trial, and if the risky option was chosen, the safe amount was increased in the following trial. Repeating this procedure for six consecutive choices leads to an accurate estimate of the ‘certainty equivalent’ of the gamble. No feedback was provided in this task. (b) The gray line represents neutrality. The solid black line represents the typical behavior of healthy subjects, with an overweighting of small probabilities and an underweighting of high probabilities. The dashed black line represents the ‘distortion hypothesis’, which suggests an exaggerated overweighting of small probabilities in pathological gambling (PG). The dotted black line represents the ‘elevation hypothesis’, which corresponds to a curve equally distorted but globally shifted towards risk, when compared to controls. Note that the probability weighing function is non-symmetrical, as it typically crosses the diagonal at p=0.3 rather than 0.5.

Because gambling scenarios systematically involve low probability gains, the ‘probability distortion hypothesis’ has frequently been suggested as a possible explanation for the widespread attractiveness of gambling (Kahneman & Tversky, Reference Kahneman and Tversky1979; Trepel et al. Reference Trepel, Fox and Poldrack2005). Accordingly, one classical hypothesis is that the risk-seeking behavior of pathological gamblers relies on an exaggerated distortion in how they weight probabilities. Such a view is a priori appealing because increased distortion corresponds to a diminished sensitivity to changes in probability, at least at intermediate probability levels (Fox & Poldrack, Reference Fox, Poldrack, Glimcher, Camerer, Fehr and Poldrack2008; Abdellaoui et al. Reference Abdellaoui, Diecidue and Onculer2011), indicating a clear-cut cognitive disability.
Alternatively, pathological gamblers may exhibit a global shift of preferences towards risk, that is they may overweight the whole probability range. According to this hypothesis, referred to here as the ‘elevation hypothesis’, pathological gamblers would show a more elevated probability weighting function, without any increased non-linearity. Because pathological gamblers present a wide range of risky behaviors (Potenza et al. Reference Potenza, Steinberg, McLaughlin, Rounsaville and O'Malley2000; Martins et al. Reference Martins, Tavares, da Silva Lobo, Galetti and Gentil2004; Powell et al. Reference Powell, Hardoon, Derevensky and Gupta2009), it is plausible that risk seeking in PG is linked to a greater risk attractiveness and/or a greater optimism about risky events, both being tightly associated with the elevation parameter (Gonzalez & Wu, Reference Gonzalez and Wu1999; Abdellaoui et al. Reference Abdellaoui, Diecidue and Onculer2011).
The present study tackled the economic basis of PG by investigating whether pathological gamblers suffer from a more distorted or a more elevated probability weighting function. We administered a classical task of revealed preferences (Richter, Reference Richter1966) to a cohort of pathological gamblers and to a matched group of controls. Our task relied on the ‘certainty equivalent’ procedure (Tversky & Kahneman, Reference Tversky and Kahneman1992), whose major advantage is the quantitative measure of risk preferences allowed by its progressive adjustment to subjects' choices (Fig. 1a).
Thus, fitting the behavior of our subjects with a two-parameter probability weighting function made it possible to distinguish between the two competing hypotheses (Fig. 1b). According to the distortion hypothesis, reflecting poor sensitivity, pathological gamblers would suffer from an increased non-linearity of their probability weighting function, leading to an increased preference for risk confined to low probabilities. By contrast, according to the elevation hypothesis, reflecting exaggerated attractiveness towards risk, patients would present a global elevation in their weighting function (without increased non-linearity), leading to a general, probability independent, preference for risk. Further analyses were performed to investigate whether inter-individual variability in risk-taking behavior could be predicted by the general affinity for gambling or the severity of gambling symptoms.
Method
Participants
Twenty pathological gamblers and 20 healthy controls, all males and free of neurological disorders, participated in this study. The data of two pathological gamblers were excluded, in one case because of technical problems with the task presentation, and in the other because of an aberrant behavior, casting doubts on the understanding of the instructions. All participants gave written informed consent to be included in the study, which was approved by the local ethics committee.
The participants were recruited from the community through advertisements. They were first invited to the laboratory for an in-depth screening session, during which their medical history was evaluated using a semi-structured interview conducted by a psychiatrist based on the Diagnostic Interview for Genetic Studies (DIGS; Nurnberger et al. Reference Nurnberger, Blehar, Kaufmann, York-Cooler, Simpson, Harkavy-Friedman, Severe, Malaspina and Reich1994). All pathological gamblers met the DSM-IV-TR criteria for PG (APA, 2000) and had a minimum score of 5 on the South Oaks Gambling Screen (range 5–14) (SOGS; Lesieur & Blume, Reference Lesieur and Blume1987). Importantly, all of them were active gamblers, and none of them were receiving therapy or treatment at the time of the study. The healthy controls had a score of 0 on the SOGS, except for one participant who had a score of 1. In both groups, a history of major depressive disorder or substance abuse/dependence (except nicotine dependence) in the past year was considered a criterion for exclusion. All other DSM-IV-TR axis I disorders were excluded based on a lifetime diagnosis.
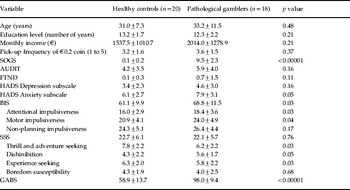
Clinical questionnaires were used for matching the groups on various parameters: the Fagerström Test for Nicotine Dependence (FTND; Heatherton et al. Reference Heatherton, Kozlowski, Frecker and Fagerström1991) served as an indicator of nicotine dependence severity, the Alcohol Use Disorders Identification Test (AUDIT; Saunders et al. Reference Saunders, Aasland, Babor, de la Fuente and Grant1993) was used to estimate alcohol consumption, and the Hospital Anxiety and Depression Scale (HADS; Zigmond & Snaith, Reference Zigmond and Snaith1983) was used to assess current depressive and anxiety symptoms. Besides age and education, pathological gamblers and healthy controls did not differ significantly on alcohol consumption, depressive symptoms and nicotine dependence (Table 1). Pathological gamblers scored slightly higher on the anxiety subscale of the HADS. To ensure a comparable motivation for money, the two groups were matched on income level, and on the self-estimated frequency with which they would pick up a €0.2 coin from the street (Tobler et al. Reference Tobler, Fletcher, Bullmore and Schultz2007).
Clinical and psychometric characteristics for pathological gamblers and healthy controls. Groups were compared by means of independent-sample t tests (two-tailed)
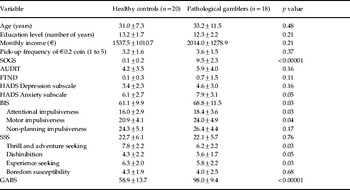
SOGS, South Oaks Gambling Screen; AUDIT, Alcohol Use Disorders Identification Test; FTND, Fagerström Test for Nicotine Dependence; HADS, Hospital Anxiety and Depression Scale; BIS, Barratt Impulsiveness Scale; SSS, Sensation Seeking Scale; GABS, Gambling Attitudes and Beliefs Survey.
We also used three psychometric questionnaires. The Barratt Impulsiveness Scale version 11 (BIS-11; Patton et al. Reference Patton, Stanford and Barratt1995) provided a measure of impulsiveness, along with three subscores distinguishing attentional, motor and non-planning impulsiveness. The 40-item Sensation Seeking Scale (SSS-40; Zuckerman, Reference Zuckerman2007) provided a measure of sensation seeking, along with four subscores measuring thrill and adventure seeking, disinhibition, experience seeking and boredom susceptibility. The Gambling Attitudes and Beliefs Survey (GABS; Breen & Zuckerman, Reference Breen and Zuckerman1999) was used to assess affinity for sustained gambling. Compared to the SOGS, it has the advantage of probing such affinity across a large range of gambling levels (i.e. problematic but also non-problematic gamblers) (Strong et al. Reference Strong, Breen and Lejuez2004). Preferred forms of gambling were assessed using item 1 of the SOGS. They are expressed as the percentage of gamblers playing the following games at least once a week: casino games (61%), gaming machines (44%), lottery (61%), scratch card games (61%), sports bets (61%), horse racing (44%), stock market (11%), bowling and pool (11%), and dice (6%). Because many gamblers were involved in more than one game, the total does not add up to 100%.
Experimental procedure
We used a standard ‘certainty equivalent’ eliciting procedure to measure the probability weighting function of each group of participants (Kahneman & Tversky, Reference Kahneman and Tversky1979; Fox & Poldrack, Reference Fox, Poldrack, Glimcher, Camerer, Fehr and Poldrack2008). The aim was to determine the certainty equivalent of several gambles associated with specific probabilities to derive an estimate of the weight subjectively assigned to each probability.
Participants were asked to make repetitive choices between a gamble and a sure amount of money (Fig. 1a). The gamble was presented as a pie chart offering a probability p of winning 20 hypothetical euros, and nothing otherwise. The sure amount was initialized at €10, and was adjusted following each choice according to a ‘bisection method’ based on the following formula:
 $$\eqalign{\tab {\rm safe}\,{\rm amount} \equals \cr \tab \quad {\rm lower}\,{\rm bound}\plus {{\lpar {\rm upper}\,{\rm bound} \minus {\rm lower}\,{\rm bound}\rpar } \over 2}.}$$
The lower and upper bounds were initialized at €0 and €20, respectively. If the subject chose the gamble, the lower bound was assigned the value of the sure amount, producing an increase of the sure amount in the next trial (e.g. from €10 to €15 in the first step). Conversely, if the subject chose the safe option, the upper bound was assigned the value of the safe option, producing a decrease in the safe amount in the next trial (e.g. from €10 to €5 in the first step). No feedback was provided. Using this binary search algorithm, more than six successive choices provided a so-called ‘certainty equivalent’, corresponding to an indifference point between the risky and the sure options. This procedure was used to generate the cash equivalents of seven gambles associated with the following probabilities: 0.05, 0.1, 0.25, 0.5, 0.75, 0.9 and 0.95. The order of these gambles was randomized between participants. To check for errors and random responses, each sequence of choices ended with two control trials requiring choosing between the risky gamble and a sure amount slightly above or below the estimated cash equivalent. If the participant's response was not consistent with previous choices, the sequence was started over again. Participants were not explicitly told about these control trials. On average, only 1.2 sequences per subject had to be repeated, and no difference was observed between groups, indicating that pathological gamblers and controls were equally consistent in their choices (t=0.02, p=0.98). This task was administered as part of an intake session (for a larger study) for which subjects received a fixed payment of €20.
The task was performed on a computer and implemented in Matlab (www.mathworks.com), using the Psychophysics Toolbox 2.65 (Brainard, Reference Brainard1997). Choices were self-paced.
Data analysis
According to prospect theory, the subjective value V of a gamble that offers €x with probability p i (and nothing otherwise) is given by:
 $$V\lpar x\comma p_{i} \rpar \equals w\lpar p_{i} \rpar \;v\lpar x\rpar\comma \hfill$$
where v(x) corresponds to the subjective value of the consequence x (the so-called ‘value function’) and w(p) corresponds to the subjective weighting of probability p i (the so-called ‘probability weighting function’) (Fox & Poldrack, Reference Fox, Poldrack, Glimcher, Camerer, Fehr and Poldrack2008). Based on our procedure that estimates the subjective value of each gamble by generating a cash equivalent (CE), we obtain:
 $${\rm CE} \equals w\lpar p_{i} \rpar \;v\lpar x\rpar \Rightarrow w\lpar p_{i} \rpar \equals {{{\rm CE}} \over {v\lpar x\rpar }}.\hfill$$
The value function v(x) is often parameterized with a power function xα (Fox & Poldrack, Reference Fox, Poldrack, Glimcher, Camerer, Fehr and Poldrack2008) but for simplicity we assume that α=1, that is v(x) =x. This is the same as modeling the value function as a linear rather than a concave function, which is a common and reasonable assumption for relatively small monetary amounts (Tom et al. Reference Tom, Fox, Trepel and Poldrack2007). Each probability weight can therefore be estimated by:
 $$w\lpar p_{i} \rpar \equals {{{\rm CE}} \over x}\comma \,\hfill$$
where x=€20.
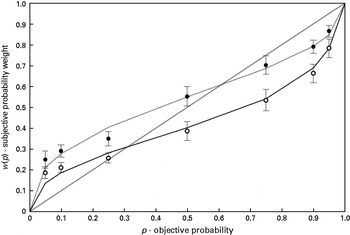
This leads to the semi-parametric estimation of the probability weighting function depicted in Fig. 2, where w(p i) is plotted as a function of p i.
Probability weighting functions for the pathological gambling (PG) and control groups. The gray line represents neutrality. The empty dots and the solid black line represent the averaged probability weights and the fitted weighting function respectively for the control group. The filled dots and the dotted black line represent the averaged probability weights and the fitted weighting function respectively for the PG group. Error bars indicate the standard error of the mean.

In a second step, these data were fitted with the standard two-parameter function proposed by Lattimore et al. (Reference Lattimore, Baker and Witte1992):
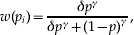 $$w\lpar p_{i} \rpar \equals {{\delta p^{\gamma } } \over {\delta p^{\gamma } \plus \lpar 1 \minus p\rpar ^{\gamma } }}\comma\hfill$$
where δ>0 measures the elevation of the weighting function and γ>0 measures its degree of curvature. Behaviorally, δ measures the attractiveness of risk. Conversely, γ reflects the sensitivity to probabilities: as γ<1 decreases, the curvature increases, and participants exhibit a more rapidly diminishing sensitivity to probabilities around the boundaries of 0 and 1 (Gonzalez & Wu, Reference Gonzalez and Wu1999; Trepel et al. Reference Trepel, Fox and Poldrack2005). This approach therefore allows disentangling overall risk seeking from probability distortion.
The fitting procedure was performed using standard non-linear least squares regression (lsqcurvefit) in Matlab. At the boundaries of the probability spectrum (p=0 and p=1), the certainty equivalents were fixed to 0 and 1 respectively. The algorithm was initialized with values of 0.6 and 0.8 for δ and γ respectively, and was allowed to search between 0 and 5. No subject reached the bounds. It is worth noting that the residuals of the optimization procedure did not differ significantly between gamblers and controls (p=0.36), which means that the weighting function given by Lattimore et al. (Reference Lattimore, Baker and Witte1992) accounts well for the behavior of both groups. Finally, we performed independent-sample t tests in Statistica 8 (www.statsoft.com) to compare the estimated δ and γ between groups, and regressed them against clinical and psychometric scores.
Results
Psychometric measures are reported in Table 1. Pathological gamblers showed much higher scores than control participants on the GABS (p<0.00001), reflecting their heightened affinity for gambling and higher propensity for related distorted cognitions (Breen & Zuckerman, Reference Breen and Zuckerman1999). The groups differed in overall impulsiveness, with pathological gamblers being more impulsive than controls for attention and motor impulsiveness (p<0.05). Although the groups did not differ in their overall sensation-seeking scores, pathological gamblers scored marginally higher on the disinhibition subscale (p=0.05) but lower on the thrill and adventure-seeking subscale (p<0.05).
Fig. 2 shows that, when plotted against the objective probabilities, the weighted probabilities, or w(p i), of our control group perfectly replicated the typical inverted-S curve crossing the neutrality line at p ≈ 0.3 (Gonzalez & Wu, Reference Gonzalez and Wu1999). Probabilities are overweighted up to this point, and underweighted beyond it. Pathological gamblers displayed a distinct pattern of risk preferences. Their weighting of probabilities also exhibited an inverted-S curve, but this curve was shifted upwards and crossed the neutrality line at p ≈ 0.6, reflecting an increased preference for risky prospects compared to controls. This qualitative effect was confirmed by further statistical analysis showing that the groups differed in their elevation parameter δ (t=2.95, p<0.01): the PG group presented abnormally high values, with an average of 1.46 (s.d.=0.9), whereas the control group presented standard values, with an average of 0.78 (s.d.=0.48). By contrast, the distortion parameter was not significantly different in controls and pathological gamblers (t=0.76, p=0.45): the PG and the control groups were both close to the standard value of γ, with averages of 0.58 (s.d.=0.21) and 0.68 (s.d.=0.49) respectively. Notably, the two-parameter weighting function explained an average of 89.5% and 92.4% of the total variance in the choices of pathological gamblers and controls respectively.
For the sake of completeness, we also tried to model the behavior of our two groups using a one-parameter function only taking into account the distortion effect, as originally proposed by Tversky & Kahneman (Reference Tversky and Kahneman1992). Of note, the fits obtained for the PG group were very poor (proportion of explained variance=56.9%) whereas the fits for the control group were satisfactory (proportion of explained variance=83.6%). A more careful examination revealed that the residuals of the fitting procedure correlated significantly with the gamble probabilities in the PG group (Breush–Pagan test: p<0.05). This observed heteroscedasticity emphasizes the importance of introducing an elevation parameter to model the behavior of pathological gamblers.
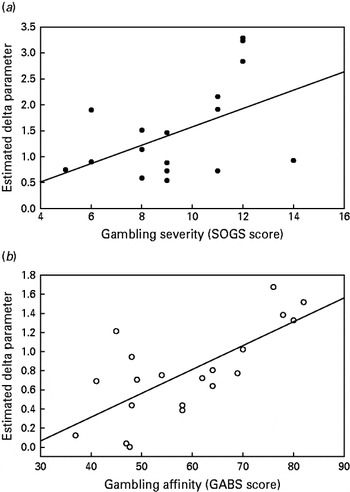
Strikingly, the elevation parameter δ not only distinguished controls from pathological gamblers but also predicted gambling attractiveness in each group. Within the PG group, regression analyses revealed that δ correlated positively with the SOGS score, reflecting the severity of gambling symptoms (r=0.47, p<0.05), but not with the GABS score, reflecting a broader affinity for gambling (r=0.38, p=0.12) (Fig. 3a). Within the control group, δ correlated positively with the GABS score (r=0.72, p<0.005) (Fig. 3b). In both groups, the γ parameter did not correlate with any of the psychometric measures.
Correlations between behavior and psychometric scores. (a) Correlation within the pathological gambling (PG) group between the attractiveness of risk, as indexed by the δ parameter, and the severity of gambling symptoms, as indexed by the South Oaks Gambling Screen (SOGS) score. (b) Correlation within the control group between the attractiveness of risk, as indexed by the δ parameter, and the affinity for gambling, as indexed by the Gambling Attitudes and Beliefs Survey (GABS) score.

Data obtained with such ‘certainty equivalent’ procedures are frequently analyzed within the framework of probability discounting, which views increased risk taking as a consequence of increased impulsivity (Richards et al. Reference Richards, Zhang, Mitchell and de Wit1999). To enhance the comparability of our results with previous literature, we fitted a typical hyperbolic discounting function to our data. The results revealed a marginally significant difference in k values between pathological gamblers and controls along with a correlation between those k values and the GABS (see online Supplementary material).
Discussion
This study investigated risk-taking behavior in PG from an economic perspective, using a rigorous and quantitative assessment of risk preferences. This approach allowed us to distinguish between the hypotheses of ‘distortion’ and ‘elevation’ of the probability weighting function. Challenging a hypothesis popularized by behavioral economists, the distortion parameter was not found to be a reliable criterion to predict gambling affinity. Instead, our analyses suggest that PG is more tightly linked to the elevation parameter, reflecting increased risk attractiveness and optimism (Gonzalez & Wu, Reference Gonzalez and Wu1999; Abdellaoui et al. Reference Abdellaoui, Diecidue and Onculer2011). Compared to our control group, which displayed a prototypical probability distortion bias, our clinical cohort overvalued risky options, leading to a similarly distorted but systematically ‘shifted towards risk’ curve. Thus, even though pathological gamblers still present a slight underweighting of high probabilities due to this distortion bias, they exhibit economic preferences globally oriented towards risk.
From a clinical point of view, the finding of this general preference for risk offers a simple account of PG: patients may gamble compulsively because they associate positive subjective utilities to gambles with negative objective expected values. This global overweighting bias, reflecting an exaggerated optimism towards objective odds against winning, may be exacerbated by overconfidence in one's own subjective beliefs in PG (Goodie, Reference Goodie2005). Our between-group analysis is further reinforced by the observed correlation between the elevation parameter δ and the severity of gambling symptoms in the PG group, as assessed by the canonical SOGS score. This correlation is of particular interest given that the tasks developed in behavioral economics often fail to predict naturalistic risk taking (Schonberg et al. Reference Schonberg, Fox and Poldrack2010). From a theoretical point of view, our results have implications for the prospect theory account of gambling in the healthy population. Indeed, the elevation component, rather than the distortion component, was found to predict gambling affinity (as assessed by the GABS) in controls. This result questions the longstanding view that probability distortion is the main economic basis of attraction towards gambling (Kahneman & Tversky, Reference Kahneman and Tversky1979). It shows the necessity to consider the elevation of the probability weighting function as an important component of risk-seeking behavior in the general population.
Most of the tasks previously used to assess risky decision making in PG take root in the neuropsychological literature, which traditionally describes the cognitive deficits associated with a given neurological or psychiatric condition. For example, based on the Iowa Gambling Task (IGT; Cavedini et al. Reference Cavedini, Riboldi, Keller, D'Annucci and Bellodi2002), it has been argued that pathological gamblers suffer from impaired decision making under uncertainty, similarly to patients with frontal lobe damage (Bechara et al. Reference Bechara, Damasio, Damasio and Anderson1994). This hypothesis has received further support from other neuropsychological tasks targeting risky decision-making processes, such as the Game of Dice Task (Brand et al. Reference Brand, Kalbe, Labudda, Fujiwara, Kessler and Markowitsch2005; Labudda et al. Reference Labudda, Wolf, Markowitsch and Brand2007) or the Cambridge Gamble Task (CGT), which can be considered as an ecological equivalent of our current paradigm (Lawrence et al. Reference Lawrence, Luty, Bogdan, Sahakian and Clark2009). Based on the comparison with brain-lesioned patients, those tasks suggest that functional deficiencies in the orbitofrontal cortex might underlie PG. However, as pointed out by Schonberg et al. (Reference Schonberg, Fox and Poldrack2010), although the CGT is usually very good at predicting real-life risk-taking behavior, it might not be appropriate to decompose the cognitive processes involved in risky decision making. In particular, the elevated wagering reported in pathological gamblers (Lawrence et al. Reference Lawrence, Luty, Bogdan, Sahakian and Clark2009) may result from several influences: probability distortion, global probability weighting, loss aversion and cue- or outcome-related emotional processes. Emphasizing the complementarity between neuropsychology and behavioral economics approaches, our study strongly suggests that the increased risk taking observed in gamblers could be the result of economic preferences globally shifted towards risk, independently of any feedback or monetary outcome.
To the best of our knowledge, our study is the first to use the theoretical framework of prospect theory to assess risk taking in pathological gamblers. In the past, similar certainty equivalent tasks have been analysed using the tools and concepts of the ‘discounting’ framework. Here, we argue that the framework of prospect theory and probability weighting might be more suited to account for risk attitudes in PG.
Madden et al. (Reference Madden, Petry and Johnson2009) and Petry (Reference Petry2012) have reported a reduced probability discounting, reflecting increased risk attractiveness in PG, and also a correlation between those discounting rates and gambling severity (SOGS). The same group has further shown that pathological gamblers with and without a history of substance abuse did not differ in probability discounting as measured by short questionnaires (Andrade & Petry, Reference Andrade and Petry2012). When applied to our own data, this probability discounting analysis confirmed that pathological gamblers differ from controls in their discount rate, but this difference was only marginally significant, in contrast to the difference found for the elevation parameter (see Supplementary Fig. S1). Thus, although both models accounted well for the data (in terms of explained variance), the probability weighting function proved more powerful in delineating pathological gamblers from controls. Additionally, although the k values correlated with the GABS but not the SOGS scores, the δ parameter correlated with the SOGS but not the GABS score in our PG cohort. This emphasize the distinct computational properties of the δ parameter and the k value on the one hand, and the psychometric specificities of the SOGS compared to the GABS on the other. Indeed, qualitatively, the SOGS probes the compulsive drive to gamble whereas the GABS is more concerned with the ‘side-effects’ of gambling such as the subjective appeal and the false beliefs associated with gambling situations (Strong et al. Reference Strong, Breen and Lejuez2004). Thus, using the framework of prospect theory in PG may be more sensitive than probability discounting analyses to reveal the nature of this behavioral addiction.
The notion of discounting was initially used to describe the subjective devaluation of rewards delayed in time, and this ‘delay discounting’ has been reliably linked to trait impulsivity, in both healthy subjects and pathological gamblers (Michalczuk et al. Reference Michalczuk, Bowden-Jones, Verdejo-Garcia and Clark2011). The concept of probability discounting was defined in a study by Richards et al. (Reference Richards, Zhang, Mitchell and de Wit1999), as an impulsivity ‘in the face of risk’. However, the analogy between delay and probability discounting has been questioned in several studies that failed to report a correlation between probability discounting and delay discounting or impulsivity questionnaires (Holt, Reference Holt2003; Madden et al. Reference Madden, Petry and Johnson2009; Andrade & Petry, Reference Andrade and Petry2012). This suggests that delay and probability discounting cannot be subsumed under a unitary concept of impulsivity. This is further supported by the fact those two processes seem to rely on partially different cerebral mechanisms in controls (Weber & Huettel, Reference Weber and Huettel2008; Peters & Büchel, Reference Peters and Büchel2009) and also in pathological gamblers (Miedl et al. Reference Miedl, Peters and Buchel2012). If there is no clear relationship between probability discounting and impulsivity, then discounting might not be the optimal concept to analyze risk preferences, which could thus be better understood through the probability weighting framework.
Several lines of evidence involve dopamine signaling in the initiation and maintenance of PG. For example, some patients with Parkinson's disease exhibit impulse control disorders, including PG, as a result of their treatment with dopamine agonists or l-3,4-dihydroxyphenylalanine (l-DOPA) (Dagher & Robbins, Reference Dagher and Robbins2009). Of note, a recent positron emission tomography (PET) study reported an inverse relationship between D1 receptor binding in the striatum and the distortion parameter of the probability weighting function in healthy subjects (Takahashi et al. Reference Takahashi, Matsui, Camerer, Takano, Kodaka, Ideno, Okubo, Takemura, Arakawa, Eguchi, Murai, Okubo, Kato, Ito and Suhara2010). This parallels previous functional magnetic resonance imaging (fMRI) findings that the non-linearity of the weighting function is reflected in ventral striatal activity (Hsu et al. Reference Hsu, Krajbich, Zhao and Camerer2009). Therefore, it might be speculated that the elevation of the weighting function observed in gamblers results from a dysfunctional dopaminergic transmission at the striatal level.
One limitation of our study is that it cannot ascertain whether the shifted preferences displayed by pathological gamblers are a cause or a mere consequence of repetitive and persistent gambling behavior. Although no definitive answer can be provided, the correlation observed between the elevation parameter δ and gambling affinity (as indexed by the GABS) in our control group strengthens the idea that global probability overweighting might be a susceptibility factor for PG. Note also that our decision to recruit participants by advertisement and to exclude psychiatric co-morbidities might have led to a slightly biased selection of gamblers. In particular, the most depressed and emotionally vulnerable gamblers, who might gamble primarily to relieve a dysphoric mood and can be regarded as a distinct subgroup (Vachon & Bagby, Reference Vachon and Bagby2009; Milosevic & Ledgerwood, Reference Milosevic and Ledgerwood2010), are probably under-represented in our sample. However, we should emphasize that this conservative procedure has a positive and important consequence, which is to avoid any confounding effects in the interpretation of the results. Additionally, because a line of studies has suggested that the shape of the probability weighting function depends on how information about probabilities is obtained, this result may not generalize to any risky decision-making situation. Indeed, when this information is provided explicitly in a descriptive fashion, subjects tend to show a consistent overweighting of low probabilities, as is the case in the current study. By contrast, when this information is acquired through experience by sampling decision outcomes, subjects are found to underweight low probabilities (Hertwig et al. Reference Hertwig, Barron, Weber and Erev2004). This latter finding is attributed to limited sampling and recency biases, which both increase the influence of frequent events over rare ones (Hertwig & Erev, Reference Hertwig and Erev2009).
To conclude, we found that PG is associated with specific economic preferences, which are also predictive of gambling severity. This finding challenges the idea that pathological gamblers are poor decision makers: they may simply have different preferences, valuing more the riskiest options. Moreover, in contrast to a longstanding hypothesis from behavioral economics, it is the elevation, and not the distortion, of the probability weighting function that is associated with gambling attractiveness, in both pathological gamblers and controls. Finally, the increased sensitivity of probability weighting compared to probability discounting analyses indicates that this procedure is relevant to evaluate risk preferences in pathological gamblers. Further studies are needed to assess this approach across subtypes of pathological gamblers and to extend it to other clinical populations.
Supplementary material
For supplementary material accompanying this paper visit http://dx.doi.org/10.1017/S0033291712001900.
Acknowledgments
This work was supported by grants from the PMU (Convention CNRS 5510) and from the Fyssen Foundation to J. C. Dreher and a grant from the MILDT/INSERM (MIL0805) to J. C. Dreher and G. Sescousse. G. Sescousse was funded by the Medical Research Foundation. We thank B. J. Weber and S. Huettel for sharing the code of the certainty equivalent task.
Declaration of Interest
None.