1. Introduction
Historically, high-income countries have experienced a significant decline in fertility rates alongside decreasing mortality rates, resulting in a gradual reduction in population growth rates toward zero (Jones, Reference Jones2022). Recent demographic research suggests that global population growth might not only halt but could also turn negative in the future. United Nations’s (2022) projections indicate that the populations of 61 countries are expected to decline by at least 1 percent between 2022 and 2050, especially due to persistently low fertility rates and, in certain instances, high emigration levels. This demographic trend highlights the need for policymakers to anticipate and manage the potential socioeconomic impacts of a shrinking population base.
In this paper, we advance both a theoretical argument and empirical evidence to shed light on the potential mechanisms by which a reduction in population size may exert a favorable impact on economic growth, particularly through the enhancement of educational attainments. Our contribution is twofold. First, we propose a model that places the relationship between depopulation and educational attainment at the forefront, offering an explanation for some observed empirical patterns.Footnote 1 Building on Lucas (Reference Lucas1988) and Boucekkine et al. (Reference Boucekkine, Martínez and Ruiz-Tamarit2013), we develop a model in which, the long-run influence of a diminishing population on the growth of real per capita GDP and human capital is non-monotonic. In particular, we show that depending on whether the degree of altruism agents have toward future generations is greater or lesser than the class-size effects influencing the individual human capital investment, there may be a differential impact of an increasingly negative population growth rate on a country’s long-term real per capita income and human capital growth. In line with empirical evidence on educational attainment, the model predicts that, under certain parametric restrictions, a more negative population growth rate (indicating a smaller population size and, by proxy, smaller class sizes) leads to a faster rate of per capita human capital growth. This results in a higher level of per capita human capital stock and GDP.
The second contribution of the paper is empirical. We take the model to the data, analyzing the connection between population dynamics and human capital while considering the class-size effects and the unobserved heterogeneity among countries.Footnote 2 This heterogeneity arises from the non-monotonic and nonuniform relationship between population change and human capital, as proposed by our theoretical framework. Using a finite mixture model (FMM), we conduct a cluster analysis that classifies countries into distinct groups based on the homogeneity in the conditional distribution of their long-term growth rates, relative to the estimated latent factors. Our findings reveal that class-size effects more significantly impact countries with lower-quality education systems.
Outline
The paper is structured as follows. The next section reviews the related theoretical literature and the empirical literature on class-size effects in human capital investment. Section 3 lays down the model while Section 4 presents the data, the estimation method, and results. Section 5 concludes. All technical derivations are in the online Appendix A.
2. Literature
Lucas (Reference Lucas1988) was the first to distinguish between ‘quantity’ (e.g., size) and ‘quality’ (e.g., human capital per capita) of the population within the context of endogenous growth theory. While endogenizing quality, he left quantity to follow an exogenous process. By keeping demographics still exogenous and summarized by two separate parameters (population size and population growth, respectively), Boucekkine et al. (Reference Boucekkine, Martínez and Ruiz-Tamarit2013) have extended the Lucas model by focusing on the relationship between population, human capital, and economic growth. They examine separately the impact of population size and growth not only on the growth rate but also on the level of human capital and income per capita. In their approach, they incorporated into the Lucas model the Benthamite principle of maximizing total utility (classical utilitarianism) and the Millian principle of maximizing per capita utility (average utilitarianism) as two extreme cases of social welfare criteria. More importantly, they departed from the canonical literature, which had primarily focused on the link between demographic change (population growth) and long-term economic growth in human capital-based theories. In contrast to this theoretical literature,Footnote 3 Boucekkine et al. (Reference Boucekkine, Martínez and Ruiz-Tamarit2013) also characterize the long-run level-effects of demographic changes together with the more conventional long-run growth-effects, and study the transitional dynamics of this enlarged Lucas-model in an attempt to distinguish between short-run and long-run effects of population growth and size on economic performance.Footnote 4 Our model focuses on the impact of (exogenous) population growth on (endogenous) economic growth along a balanced growth path equilibrium, so keeping outside of the analysis any issue related to the short-run (or transitional dynamics) effects of the rate of growth of population on both the rate of growth of the economy and the level of the model’s crucial variables. However, we complement and extend the Lucas (Reference Lucas1988)–Boucekkine et al. (Reference Boucekkine, Martínez and Ruiz-Tamarit2013) setting in two different directions. First, we use the hypothesis that the efficiency of the infinite-lived representative agent’s technology of human capital accumulation is affected, through population growth, by the presence of possible class-size effects, as the empirical literature on the topic seems to demonstrate.Footnote 5 Secondly, we take the model to the data to see whether we are able to detect a negative correlation between class-size and the efficiency with which any individual in the population can augment her own stock of human capital.
The debate on the economic growth implications of a changing population has been recently revived by Jones (Reference Jones2022), who proves that in a fully-endogenous growth framework, a negative and exogenous population growth is compatible only with stagnating knowledge and living standards in the very long-run (the so-called empty-planet result).Footnote 6 Jones (Reference Jones2022) also extends the canonical R&D–based, semi-endogenous growth setup with exogenous population growth to the case where fertility choices are endogenous. In this extension, two different equilibria are characterized and analyzed. In the decentralized equilibrium, the endogenous population growth rate can be negative, leading the economy toward the empty-planet result. In contrast, in the optimal equilibrium, which differs from the decentralized one by explicitly considering that a larger population may enhance the future rate of technological progress, the economy achieves long-term positive economic growth, provided that the endogenous population growth rate is also positive. Given that both the decentralized– and the optimal–equilibrium endogenous population growth rates depend on structural policy parameters, Jones (Reference Jones2022) concludes that implementing policies to enable a transition to an optimal allocation is crucial, as it ensures sustained exponential growth in population, which consequently enhances knowledge and living standards.Footnote 7 What fundamentally distinguishes our analysis from that of Jones (Reference Jones2022) is the pivotal role we assign to individuals’ educational choices, rather than fertility choices, especially in the context of a population that declines over time at an exogenous rate.
Our paper is also closely related to recent works by Feichtinger et al. (Reference Feichtinger, Grassb, Kuhnb, Prettnerc and Prskawetza2023), Boikos et al. (Reference Boikos, Bucci and Sequeira2023), Bucci (Reference Bucci2023), and Siskova et al. (Reference Siskova, Kuhn, Prettner and Prskawetz2023). Feichtinger et al. (Reference Feichtinger, Grassb, Kuhnb, Prettnerc and Prskawetza2023) include endogenous education investments and human capital accumulation in the vein of Lucas (Reference Lucas1988) into the model of Jones (Reference Jones2022). They show that the basin of attraction of the Jones (Reference Jones2022) solution with depopulation and economic decline shrinks (and, for reasonable parameter values, may even completely vanish) when investing in education becomes a possibility.Footnote 8 The empty-planet result of Jones (Reference Jones2022) describes a situation in which, with a population that declines over time, the stock of knowledge and the level of GDP per capita would eventually stabilize as time goes to infinity. While current data seem to corroborate that TFP is already stagnating, this is not the case for GDP per capita. To explain this ‘puzzle’, Boikos et al. (Reference Boikos, Bucci and Sequeira2023) include human capital accumulation in the Jones (Reference Jones2022) model and show that TFP stagnation may be compatible with an increasing level of GDP per capita in the very long run. In other words, they demonstrate that adding human capital to the Jones (Reference Jones2022) model with negative (and exogenous) population growth may contribute to reconciling the long-term no-stagnation-result in GDP per capita with the long-term TFP-stagnation-result. Bucci (Reference Bucci2023) analyzes, within an R&D-based economy that invests also in human capital, the conditions (related to the size of a crucial parameter affecting the law of motion of per capita human capital) under which in the very long run a negative population growth rate may be conducive to positive growth rates of ideas, per capita income, and per capita human capital, respectively. Unlike these papers, ours entirely abstracts from R&D activities and focuses on the role of human capital accumulation in determining a positive growth rate of real per capita GDP, even when the population size is shrinking.
A crucial element of our theoretical model is acknowledging that class-size effects significantly influence skill acquisition. Empirical studies highlight the critical influence of class size on human capital accumulation. Smaller classes are consistently associated with better student outcomes, including cognitive and non-cognitive skills.Footnote 9 In an influential paper, Angrist and Lavy (Reference Angrist and Lavy1999) leveraged Maimonides’ Rule to estimate the causal impact of class size reductions on Israeli students’ test scores, finding substantial benefits. Similarly, Urquiola (Reference Urquiola2006) documented statistically significant positive effects from smaller classes in Bolivian third-grade students. Cross-country studies like Wößmann and West (Reference Wößmann and West2006) show mixed results, with significant effects in countries with lower teaching quality.
Beyond primary and secondary education, class-size effects extend to higher education. Bandiera et al. (Reference Bandiera, Larcinese and Rasul2010) found nonlinear impacts, with larger classes reducing academic performance in UK universities, particularly for high-achieving students and in large classes. Building on this, Kara et al. (Reference Kara, Tonin and Vlassopoulos2021) observed that class-size effects are more pronounced in STEM fields and for students from disadvantaged socio-economic backgrounds.
These findings collectively underscore the macroeconomic implications of class-size effects: smaller classes foster better individual educational outcomes, supporting the argument that population size may inversely correlate with aggregate human capital accumulation. This evidence forms the foundation for the theoretical model that follows.
3. The model
Technology
We build upon Lucas (Reference Lucas1988) and Boucekkine et al. (Reference Boucekkine, Martínez and Ruiz-Tamarit2013). The model is set in continuous time, with time running on the interval [
 $0,\infty$
). At any point in time, the production of a homogeneous consumption good,
 $Y_t$
, is obtained by employing, under constant returns to scale, human capital,
 $H_{Yt}$
, and physical capital,
 $K_t$
, as inputs, according to
 \begin{eqnarray} Y_t=AK_t^\beta H_{Yt}^{1-\beta }, \qquad \quad \text {with }0\leq \beta \leq 1, \end{eqnarray}
where
 $A\gt 0$
is the total factor productivity and
 $\beta$
is a parameter controlling for the factor-input shares in GDP. At any time, the aggregate stock of human capital,
 $H_t$
, can be used either for producing the final good or for acquiring ‘new’ human capital. The share of
 $H_t$
that is used for producing the final good is
 $u_t\in [0,1]$
, whereas that used for attaining new human capital is
 $1-u_t$
. Since the main goal of this paper is to determine whether (and, eventually, under which conditions) the presence of class-size effects in education can positively contribute to long-run economic growth, we may ignore physical capital. In this respect, compared to Lucas (Reference Lucas1988) and Boucekkine et al. (Reference Boucekkine, Martínez and Ruiz-Tamarit2013), we first set
 $\beta =0$
in (1) and let the aggregate production function ultimately read as
 \begin{equation} Y_t=A H_{Yt}=A(u_tH_t). \end{equation}
Equation (2) now says that the only essential input in production is human capital. Furthermore, we posit that, once produced, total output
 $Y_t$
is consumed, i.e.,
 $Y_t=C_t$
.Footnote
10
Through this assumption we can safely neglect any gross investment in physical capital (or any other reproducible resource), as well. In (2), parameter
 $A\gt 0$
now measures the productivity of human capital,
 $H_{Yt}$
, in the production of consumables. Let now
 $N_t$
denote the existing population at time
 $t$
. In per capita terms, (2) becomes
 \begin{equation} y_t= A \left (u_th_t\right )=c_t, \end{equation}
where
 $y_t\equiv Y_t/N_t$
,
 $h_t\equiv H_t/N_t$
, and
 $c_t\equiv C_t/N_t$
. We assume that population grows over time at an exogenous rate
 $n$
such that
 \begin{equation} \frac {\dot {N}_t}{N_t}=n \quad \text {with}\quad n\gtreqless 0\quad \text {and}\quad N(0)\gt 0 . \end{equation}
Per capita human capital accumulation is given by
 \begin{equation} \dot {h}_t=\xi (1-u_t)h_t-\delta h_t \quad \text {with}\quad h(0)\gt 0, \end{equation}
where
 $\xi \gt 0$
is the efficiency of human capital investment and
 $\delta \in (0,1)$
is the instantaneous depreciation rate of human capital per capita. Unlike Lucas (Reference Lucas1988) and Boucekkine et al. (Reference Boucekkine, Martínez and Ruiz-Tamarit2013), here we account for the novel assumption that the presence of a class–size effect influences the efficiency with which per capita human capital may be augmented over time. Specifically, we assume that
 $\xi$
increases as the population size
 $N_t$
(a proxy for class size) decreases and that the faster the population size declines, the more rapidly
 $\xi$
rises over time, i.e.,
 \begin{equation} \xi \equiv \sigma -\varepsilon \left (\frac {\dot {N}_t}{N_t}\right )=\sigma -\varepsilon n \gt 0 \quad \text {with}\quad \sigma \gt 0 \,\text {and}\, \varepsilon \geq 0 . \end{equation}
In equation (6),
 $\xi$
is designed to capture, in a reduced form fashion, the existence of two contrasting forces at work in the accumulation of human capital. On one hand, there is a positive effect resulting from the effort in education, represented by
 $\sigma$
.Footnote
11
On the other hand, we have a potentially perverse effect due to population dynamics. In fact, for any
 $\varepsilon \gt 0$
, there exists a negative correlation between the rate of population growth and the efficiency with which an individual can enhance her own stock of embodied knowledge (human capital). This means that the larger (smaller) the value of
 $n$
, the smaller (larger) the efficiency of investment in human capital per capita. Therefore, in our model, the extent of the class–size effect can be directly measured by the value of
 $\varepsilon$
.Footnote
12
When
 $n=0$
, our model simplifies to the one used in Lucas (Reference Lucas1988) and Boucekkine et al. (Reference Boucekkine, Martínez and Ruiz-Tamarit2013), with
 $\xi =\sigma \gt 0$
. The same outcome occurs, evidently, also when
 $\varepsilon =0$
.
Combine (4), (5), and (6) to get
 \begin{equation} \dot {h}_t=(\sigma -\varepsilon n)(1-u_t)h_t-\delta h_t \quad \text {with}\quad n\gtreqless 0. \end{equation}
The next section explores the condition(s) for the presence of class-size effects in education to contribute positively to long-run economic growth.
Households
The economy is populated by many structurally identical households. Therefore, we can focus on the behavior of a representative infinitely-lived household with perfect foresight whose size coincides with the size of the whole population
 $N_t$
. Each member of the representative household has a Constant-Intertemporal-Elasticity of Substitution (CIES) instantaneous felicity function of the form:Footnote
13
 \begin{equation} u(c_t)=\frac {c_t^{1-\theta }-1}{1-\theta }, \quad \text {with}\, \theta \gt 0,\,\theta \neq 1. \end{equation}
The representative household allocates time-resources toward the acquisition of human capital and chooses the optimal path of the time share of human capital to be devoted to production and educational activities. The problem faced by the head of the representative household is to maximize the household’s discounted infinite lifetime utility. Using (3), (4), (7), and (8), the household’s problem reads, thus, as
 \begin{eqnarray} \max _{\{c_t, u_t,h_t\}_{t=0}^{\infty }}\mathcal {U}&\equiv &\int _{0}^{\infty }u(c_t)N_t^\mu e^{-\rho t}dt=\int _{0}^{\infty }\frac {c_t^{1-\theta }-1}{1-\theta }N(0)^\mu e^{-(\rho -\mu n) t}dt \end{eqnarray}
s.t.
 \begin{align*} &\frac {\dot {N}_t}{N_t}=n\gtreqless 0,\\ &c_t=A(u_th_t)=y_t,\\ & \dot {h}_t=(\sigma -\varepsilon n)(1-u_t)h_t-\delta h_t,\\ & h(0)\gt 0, \quad N(0)\gt 0, \end{align*}
where
 $\rho \gt 0$
is the subjective discount rate (or the rate of intertemporal altruism) and
 $\mu \in [0,1]$
is the rate of intergenerational altruism.Footnote
14
We assume
 $\rho -\mu n\gt 0$
and, for the sake of simplicity, normalize
 $N(0)$
to 1.
Drawing upon the seminal work by Palivos et al. (Reference Palivos, Wang and Zhang1997), we are now able to introduce a formal definition of balanced growth path (BGP) and non–degenerate BGP.
Definition 1. A BGP is a long-run equilibrium path along which the (exponential) growth rates of variables depending on time are constant. A BGP will be said to be non-degenerate if these constant growth rates are strictly positive.
Using this definition and equation (7), we see immediately that along a BGP the fraction of human capital employed in production and educational activities is constant, that is,
 $u_t=u$
 $\forall t\geq 0$
. Moreover, it is possible to show that along a BGP equilibrium, the following results do holdFootnote 15:
 \begin{equation} (1-u)=\frac {(\sigma -\rho )-\delta (1-\theta )+n(\mu -\varepsilon )}{\theta (\sigma -\varepsilon n)}, \end{equation}
and
 \begin{equation} \frac {\dot {y_t}}{y_t}=\frac {\dot {c}_t}{c_t}=\frac {\dot {h}_t}{h_t}\equiv \gamma =(\sigma -\varepsilon n)(1-u)-\delta =\frac {(\sigma -\rho -\delta )+n(\mu -\varepsilon )}{\theta }. \end{equation}
Notice that in the absence of any population change (
 $n=0$
), provided that the condition
 $\sigma \gt \rho +\delta$
holds,Footnote
16
the model would predict positive economic growth without any (weak or strong) scale effect.
Negative population growth and long-run economic growth
We now focus on the specific case where
 $n\lt 0$
, which is likely the most relevant scenario today, particularly for OECD countries.Footnote
17
From (11) we get:
 \begin{equation} \frac {\partial \gamma }{\partial n}=\frac {1}{\theta }(\mu -\varepsilon ). \end{equation}
When
 $\varepsilon \gt \mu$
, the class-size effect is quite strong (and larger than the intergenerational rate of altruism). In this case, a lower population growth rate would imply a higher real per capita GDP growth rate along a BGP. If, instead,
 $\varepsilon \lt \mu$
, then the class-size effect is rather negligible (and smaller than the intergenerational rate of altruism). In this case, a lower population growth rate would imply a lower real per capita GDP growth rate along a BGP. Finally, if
 $\varepsilon =\mu$
, then any decrease in
 $n$
would have no impact on the long-term economic growth rate of the economy.Footnote
18
To see why
 $\partial \gamma /\partial n$
depends positively on
 $\mu$
and negatively on
 $\varepsilon$
, notice that from (11) we have
 \begin{equation} \frac {\partial \gamma }{\partial n}=\underbrace {-\varepsilon (1-u)}_{\text {(direct) population effect}}+\underbrace {(\sigma -\varepsilon n)\frac {\partial (1-u)}{\partial n}}_{\text {(indirect) accumulation effect}}. \end{equation}
In words, in the long run, the impact of population growth on real per capita GDP growth may be decomposed into two distinct effects. The first one is the (direct) population effect, represented by the term
 $-\varepsilon (1-u)$
in (13). For any
 $\varepsilon \gt 0$
, this effect is unambiguously negative and suggests that higher population growth would lead (directly) to a fall in per capita income growth. Indeed, when population size goes up the available total GDP has, ceteris paribus, to be divided among a larger number of people, with each of them now accruing a smaller real per capita income. Notice that the extent of the population effect is negatively tied to the magnitude of the class–size-effect (
 $\varepsilon$
): all else remaining equal, the larger
 $\varepsilon$
and the faster the decline of the economic growth rate (
 $\gamma$
) induced by any (direct) increase in the population growth rate,
 $n$
. The second effect is the (indirect) accumulation effect, represented by the term
 $(\sigma -\varepsilon n){\partial (1-u)}/{\partial n}$
. This effect is ambiguous. However, what we may observe is that the magnitude of the accumulation effect is positively tied to (hence, it increases with) the degree of the intergenerational rate of altruism,
 $\mu$
. The reason is that, ceteris paribus, when population size rises, the higher
 $\mu$
the larger the weight assigned to consumption per capita of later generations. More patient households will, thus, prefer to have less present consumption and to invest more in human capital, thus fostering long-run economic growth (
 $\gamma$
).
If we focus our attention on those countries (such as Germany, Italy, Spain, Portugal, Greece, and Japan, among others) where the rate of population growth is already negative and is expected to continue to decrease in the years ahead,Footnote
19
our model ultimately suggests that a class-size effect should not only exist (
 $\varepsilon \gt 0$
), but be also sufficiently large (
 $\varepsilon \gt \mu$
) for a population size which is going to decline over time to be still able to sustain a rising (human capital-based) growth rate of per capita real GDP in the long run. The next section takes our theoretical conclusions to the data.
4. Quantitative analysis
The model presented above has two fundamental testable predictions:
-
(i) In the long run, the consequences on real per-capita GDP growth of a declining population size may be non-monotonic;Footnote 20
-
(ii) there exists a threshold-value of the class-size effects above/below which we would observe a differential impact of a lower growth rate of population (and, hence, of decreasing population size) on a country’s long-run growth rate of real per-capita income.Footnote 21 In particular, following a reduction in the population growth rate, we would observe a rise in the growth rate of the economy when the class-size effects are sufficiently large, i.e., when
 $\varepsilon \gt \mu$
.

To test these theoretical predictions against OECD data, we also account for the possibility that fundamental parameters differ across countries. Guided by the theoretical model, our parameter estimations enable us to identify situations where depopulation negatively impacts growth and where it does not.
Data
Our empirical analysis relies on the Penn World Table (PWT version 10.01), which provides data on the Human Capital Index, population, and a proxy that measures the proportion of human capital allocated to the production of the final good. This proxy is derived from equation (3) as follows:
 \begin{equation*} u_{it}=\frac {Y_{it}}{TFP_{it}\times HC_{it}}, \end{equation*}
where
 $Y$
,
 $TFP$
, and
 $HC$
represent, respectively, GDP per capita, Total Factor Productivity, and the Human Capital Index for country
 $i$
and year
 $t$
.
Subsequently, we use
 $u_{it}$
to compute the share of human capital dedicated to fostering new human capital (
 $1-u_{it}$
). Adhering to the theoretical framework, this variable is standardized within each country, ensuring its values fall within the range 0 to 1.
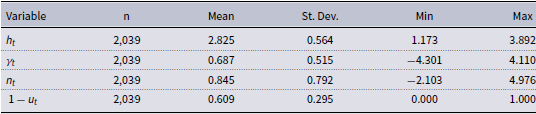
Due to the closer alignment of our theoretical model with developed economies, our analysis focuses on OECD countries observed between 1954 and 2019. Table A.1 in Appendix A provides descriptive statistics for the variables used in the analysis.Footnote 22
Estimates
Assume for simplicity
 $\delta =0$
. Then, using (11), equation (7) can be written as:
 \begin{equation} \frac {\dot {h}}{h_t}\equiv \gamma =\sigma (1-u_t)-\varepsilon \left [n_t\times (1-u_t)\right ]. \end{equation}
The empirical counterpart of (14) is
 \begin{equation} \gamma _{it}=\zeta _{0}+\zeta _1(1-u_{it})+\zeta _2\left [n_{it}\times (1-u_{it})\right ]+\zeta _3 n_{it}+\epsilon _{it}, \end{equation}
where
 $\gamma _{it}$
is the annual growth rate of the Human Capital Index and
 $\epsilon _{it}$
is an iid error term.Footnote
23
Confronting (14) with (15), we see immediately that
 $\hat {\zeta _1} = \hat {\sigma }$
and
 $\hat {\zeta _2}=-\hat {\varepsilon }$
. Notice also that in (15) the interaction between population growth (
 $n_t$
) and the investment in education (
 $1-u_t$
) is complete.
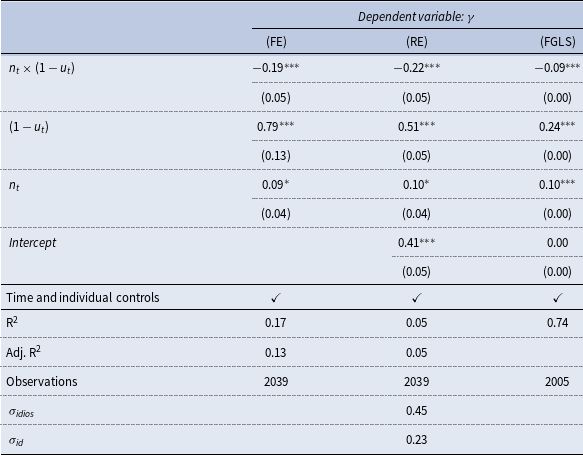
Table 1 presents the OLS fixed effects (FE), OLS random effects (RE), and feasible GLS (FGLS) estimates, respectively, for (15). As predicted by the theory, for the interaction
 $n_t\times (1-u_t)$
, all three models show a negative association with the dependent variable
 $\gamma$
. The FE and RE models show similar coefficient estimates of -0.19 and -0.22, respectively, both significant at a 1% level. The FGLS model suggests a slightly smaller coefficient of -0.09, also significant at a 1% level. As predicted by the theory, the variable
 $1-u_t$
is positively associated with
 $\gamma$
in all models, with the FE model showing the largest coefficient estimate (0.79), and the FGLS showing the smallest (0.24), but again with a remarkably low standard error. Lastly, the variable
 $n_t$
, which has been added to account for the complete interaction, also has a positive relationship with
 $\gamma$
, with an approximate coefficient value of 0.1 across all models. Finally, the
 $R^2$
values indicate that the FGLS model has a considerably better fit (
 $R^2$
= 0.74) to the data compared to the FE (
 $R^2$
= 0.17) and RE (
 $R^2$
= 0.05) models. Time and individual controls are included in all models.
OLS,GLS estimation

Note:
 $^{*}$
p
 $\lt$
0.1;
 $^{**}$
p
 $\lt$
0.05;
 $^{***}$
p
 $\lt$
0.01
 $\sigma _{idios}$
: idiosyncratic variance;
 $\sigma _{id}$
: individual variance; standard errors in brackets.
FGLS model offers the most precise and best-fitting model for the data, given its low standard errors and high
 $R^2$
value. Notice also that in the OLS models, the inference is influenced by non-normal residuals. This is evident from the Shapiro-Wilk test, which rejects the assumption of normality with a test statistic of 0.988 and a highly significant p-value of 0.000. The FGLS model also accounts for potential correlations among covariates. This flexibility makes it more suitable for datasets where the assumptions of homoscedasticity in the residuals and independence of covariates are violated.
In the following, we apply a FMM to the equation (14) to cluster countries according to the unobserved heterogeneity. In general, mixture models allow to test the behavior of human capital growth dynamics, under the assumption that unobserved heterogeneity affects parameters estimation. In particular, we employ a FMM, relaxing the hypothesis of iid residuals and allowing for correlated random terms.Footnote 24 The random component captures the impact of unobserved country-specific variables, limiting the effects of the omitted variable bias. This approach allows dealing with the unobserved heterogeneity due to the non-monotonic, non-uniform relationship between regressors and response, as predicted by our theory. Moreover, through this estimation procedure, we are able to perform a cluster analysis: we sort countries into groups based on the homogeneity of the conditional distribution of their long-run growth rates with respect to the estimated unobservable factors.
According to the generalized linear model framework (McCullagh and Nelder, Reference McCullagh and Nelder1989), equation (14) can be written as:
 \begin{equation} \gamma _{it}=\zeta _{0i}+\zeta _{1i}(1-u_{it})+\zeta _{2i}\left [{n}_{it}\times (1-u_{it})\right ]+\zeta _{3i} n_{it}+\epsilon _{it}, \end{equation}
where parameters
 $\zeta _i=\zeta _{0i},\zeta _{1i},\zeta _{2i},\zeta _{3i}$
are now country specific. Specifically, they capture the country-specific unobserved factors that affect human capital growth, through population change, the share of human capital dedicated to fostering new human capital, and its interaction with population growth.
We assume that parameters in
 $\zeta _{i}$
can be empirically described by random variables, with unspecified probability function, and cluster-specific variances
 $\sigma _i$
. In this way, equation (16) takes explicitly into account the between countries random terms correlation.
The nonparametric maximum likelihood estimator (NPMLE) of the distribution is discrete,Footnote
25
with a finite number of locations and masses. This implies that the country-specific latent variables are modeled as measures of the difference between country i-th’s covariates and their sample mean. We assume that
 $\gamma _{it}$
is a conditionally independent realization of the potential human capital growth, given the set of random factors, which varies across countries and accounts for both individual variation and dependence among country-specific rates of growth.
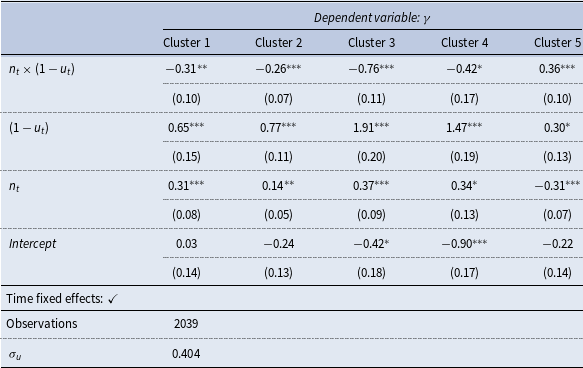
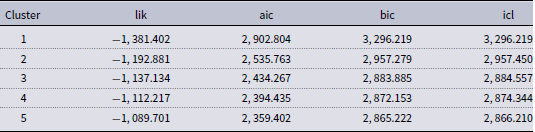
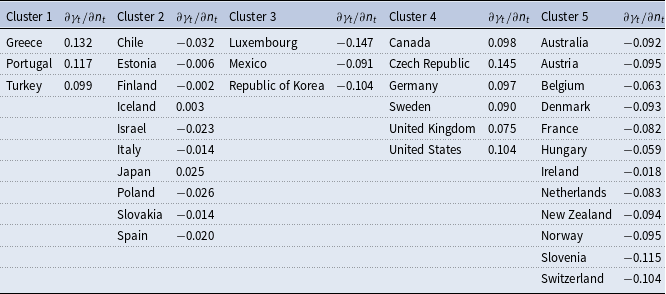
Table 2 presents the results, while Table 3 provides the corresponding country classification. From the previous specification, we obtain a classification of countries into 5 clusters.Footnote
26
The first noteworthy result is the positive impact of the coefficient
 $1-u_t$
across the different clusters. Consistently to the theory, investment in human capital is positively associated with the HC index’s growth rate, ranging from 0.30 (Cluster 5) to a maximum of 1.91 (Cluster 3). This variance suggests that, despite the consistent positive relationship between investment in human capital and its growth rate, this relationship is heterogeneous across clusters, underscoring the influence of unobserved factors.
Finite mixture model

Note:
 $^{***}p\lt 0.001$
;
 $^{**}p\lt 0.01$
;
 $^{*}p\lt 0.05$
. Standard errors in brackets.
Country classification, model in Table 2

A distinct pattern emerges when examining the interaction term capturing the class-size effects (
 $\varepsilon$
), revealing three key trends. Only Cluster 5 exhibits a positive effect. All the remaining clusters share a comparably negative coefficient, ranging from -0.26 to -0.42, with the exception of Cluster 3 which displays a significantly stronger negative relationship, with a coefficient of -0.76. The negative sign aligns with the theoretical model, where a negative relationship exists between population growth and the efficiency of human capital (see equation (6)). However, the positive sign found for one group contradicts the class-size effects, indicating that for some countries, larger population growth is associated with more efficient human capital. Below we will try to better understand this effect by studying the composition of the different groups.
When considering the impact of the coefficient linked to the population growth variable, a careful interpretation is required. Unlike the previous two coefficients, this one is included in the model to account for empirical interactions but does not have a direct implication derived from the theoretical framework.Footnote 27 Finally, although frequently not statistically significant, most clusters exhibit a negative intercept. This indicates a tendency toward a lower baseline growth rate of the HC index.
Overall, these estimates suggest that the relationship between population growth, human capital investment, and the growth rate of the HC index is complex and varies across clusters. The interaction effect is particularly varied, with some clusters showing a positive relationship and others negative. This could reflect different demographic dynamics or varying effectiveness of human capital investment in different sub-populations or contexts represented by the clusters. The direct effect of human capital investment is consistently positive across all clusters, emphasizing its importance in the growth of the HC index. The varied signs and magnitudes of the population growth rate indicate that its impact on the HC index’s growth may depend on other factors captured by the cluster distinctions.
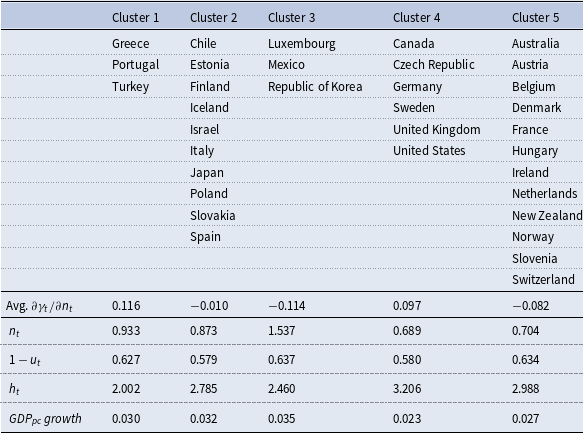
We seek a deeper understanding of our findings by examining the countries grouped into various clusters in our analysis, as detailed in Table 3. Among the 34 OECD countries in our sample, there is an uneven distribution of countries across groups. The largest contingent falls into Cluster 5 (12 countries), followed by Cluster 2 (10 countries) and Cluster 4 (6 countries). The remaining groups (Cluster 1 and Cluster 3) consist of 3 countries each. Initial observations make it challenging to discern any consistent patterns within the classification.Footnote
28
Indeed, we find no substantial differences in terms of investment of human capital
 $(1-u_t)$
or economic growth across groups during the period under study, and although there are some differences in terms of the HC index, there is not a direct relationship with the interaction coefficient from Table 2.
Educational proxies and class-size effects.

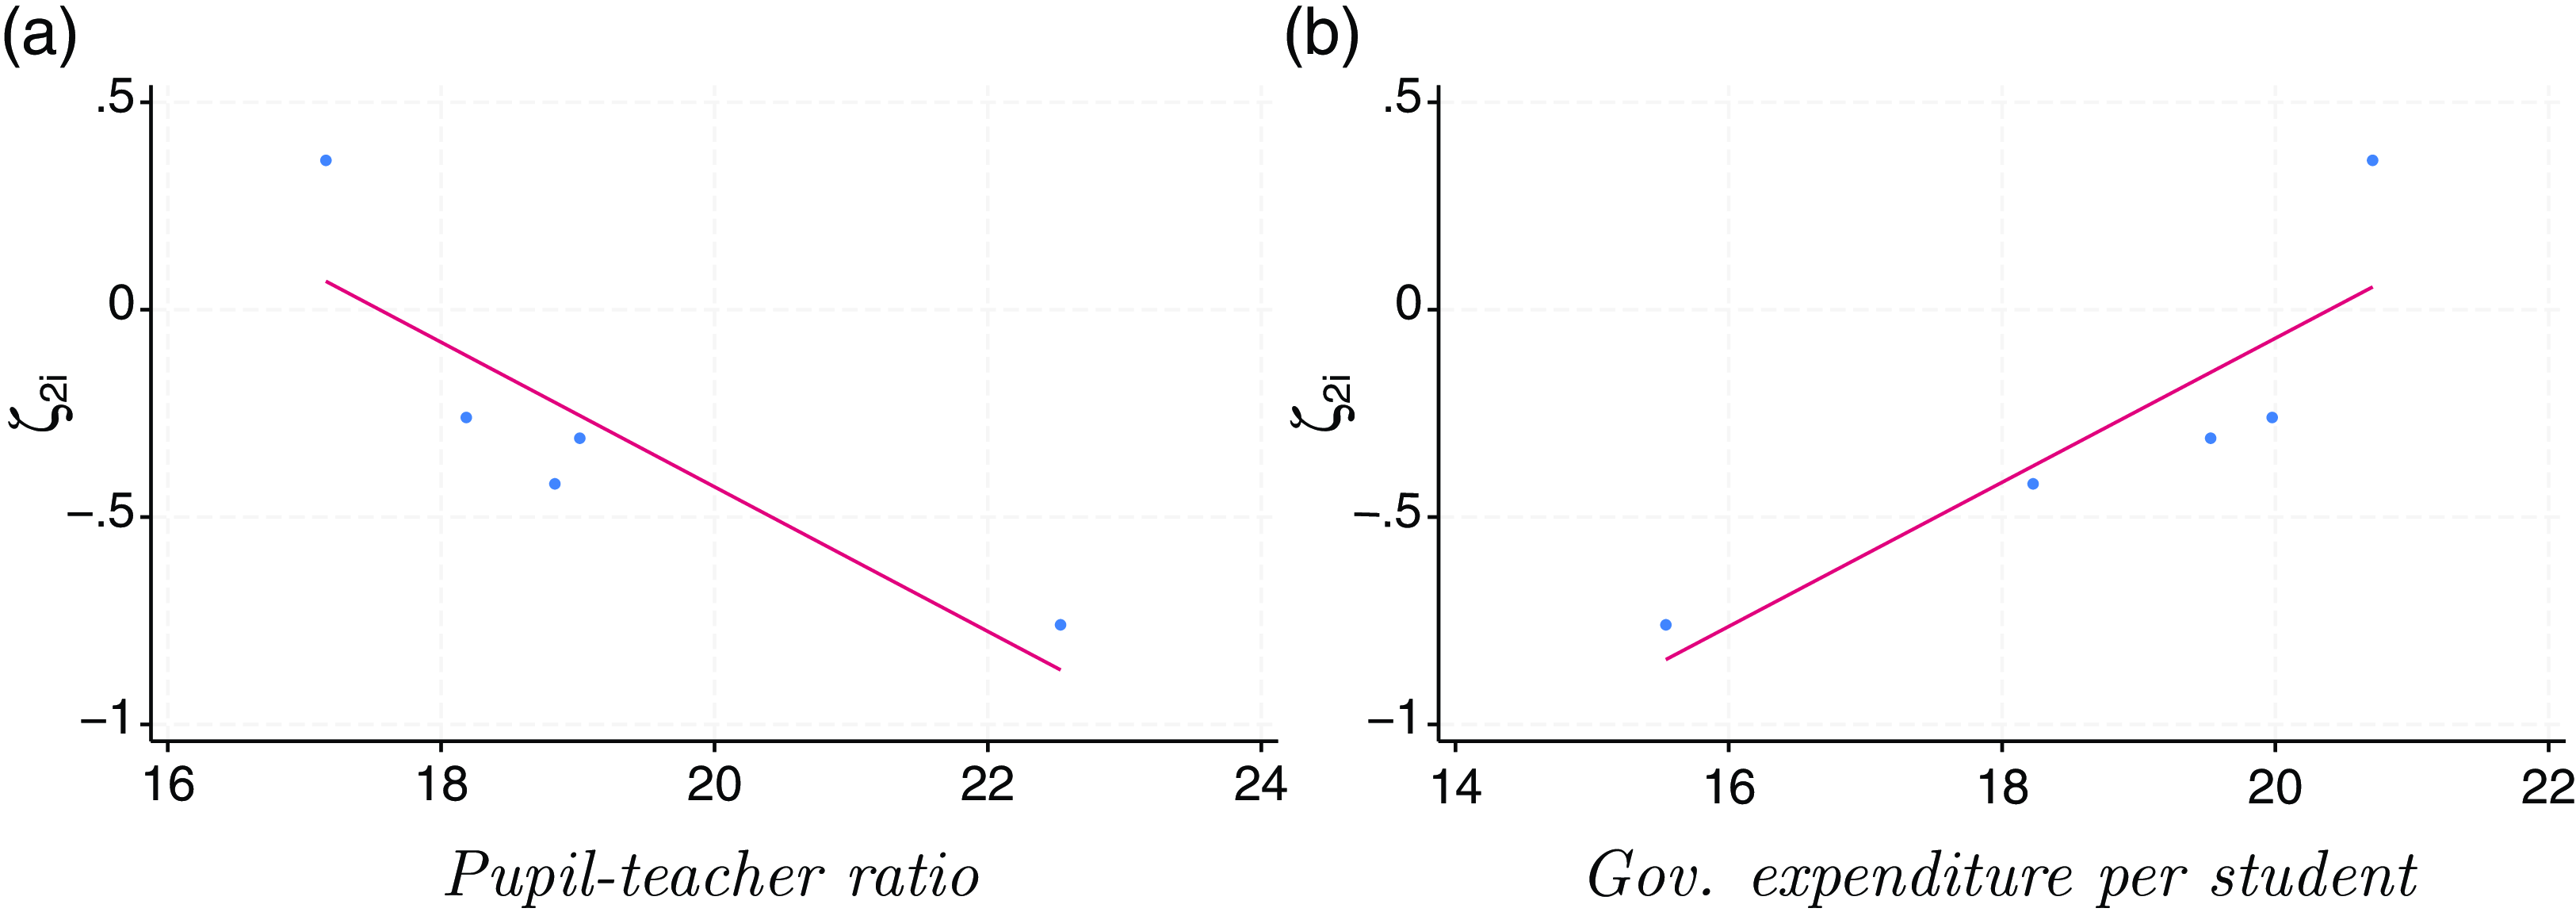
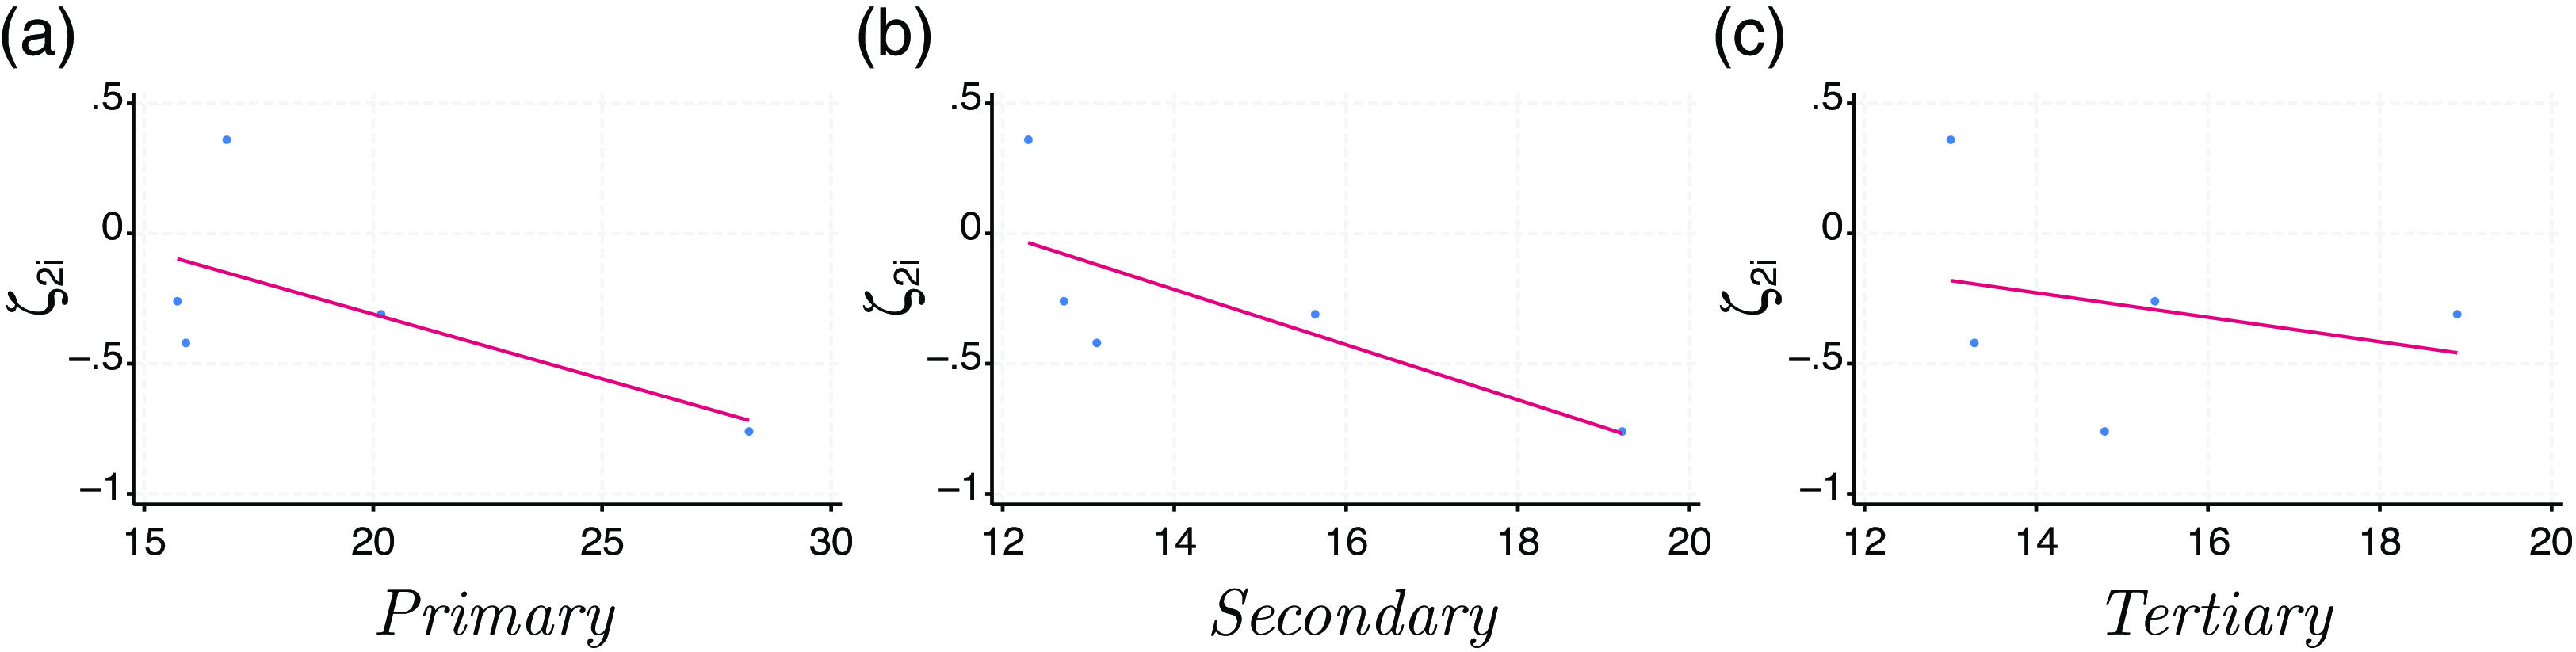
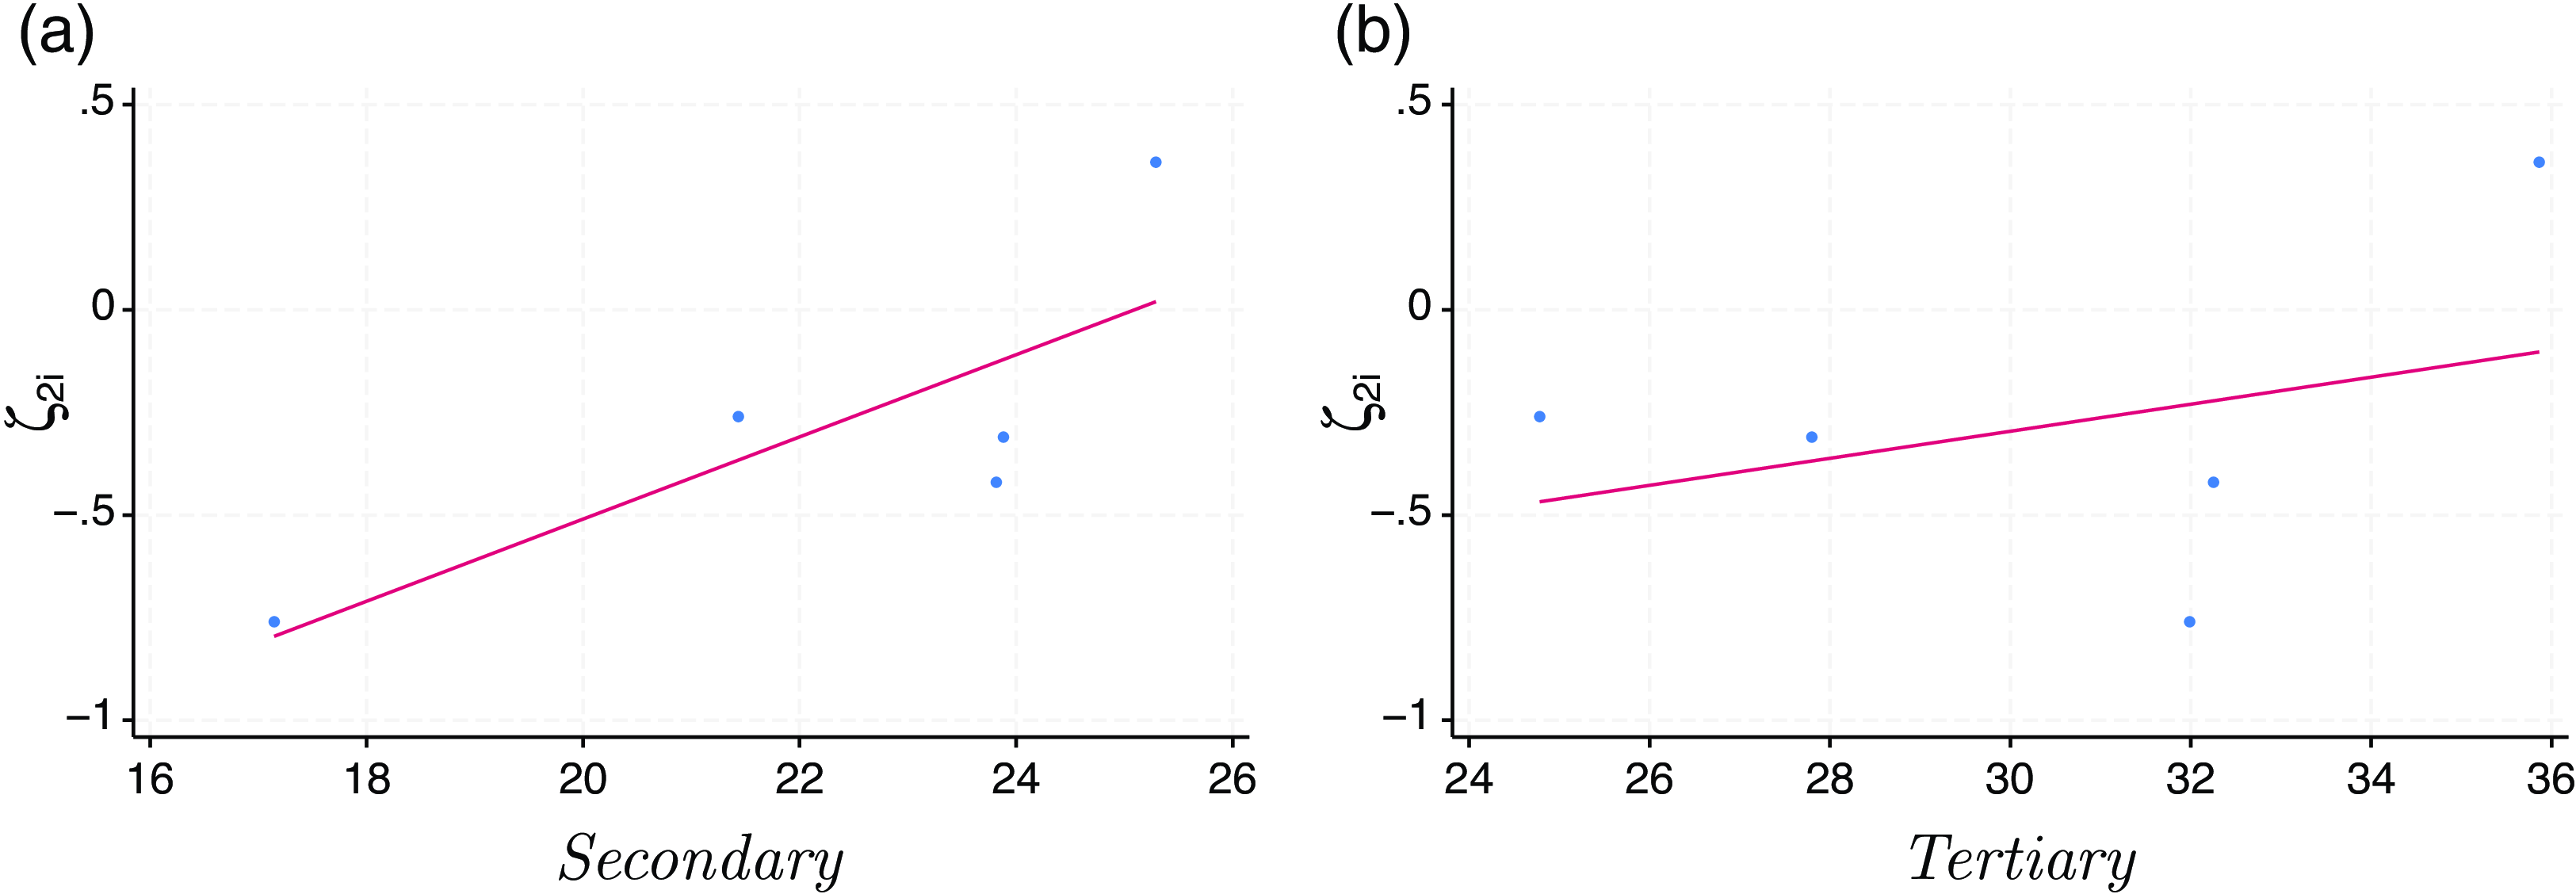
Remarkably, the results change when we compare them to two proxies for educational quality: the pupil-teacher ratio and government expenditure per student (as a percentage of GDP per capita), both obtained from the World Bank. Figure 1 shows the correlation between the average values of these variables using our econometric sample and the interaction coefficients. Figure 1a demonstrates a clear negative relationship between the pupil–teacher ratio and the class-size effects, indicating that population increases more negatively affect human capital efficiency through the class-size effects in countries with a higher number of students per teacher.Footnote 29 In contrast, Figure 1b shows a strong positive correlation between the interaction coefficients and government expenditure per student, suggesting that the class-size effects is stronger in countries with lower expenditure per student.Footnote 30 These results suggest that higher educational quality, indicated by a lower pupil-teacher ratio or higher expenditure per student, can help reduce or even reverse the class-size effects.
Interestingly, the cluster with higher population growth (Cluster 3) exhibits more pronounced class-size effects. In this cluster we find Luxembourg (
 $\partial \gamma /\partial n=-0.147$
), Mexico (
 $\partial \gamma /\partial n=-0.091$
) and Republic of Korea (
 $\partial \gamma /\partial n=-0.104$
).Footnote
31
In 2021, the OECD reports that Korea and Mexico have some of the largest class sizes in both primary (with an average of 22.45 and 22.57 students per teacher, respectively) and secondary education (with an average of 26.49 and 26.17 students per teacher, respectively).Footnote
32
In 2022, instead, Luxembourg had one of the highest proportions of young adults aged 18–24 in education or training, either full-time or part-time, despite having one of the lower average student-to-teacher ratios in both primary and secondary schools.Footnote
33
However, the relationship between population growth and class size is evidently non-linear. Despite having the lowest average population growth rate, Cluster 4 displays the second-most negative coefficient in the interaction term.
Countries in line with the theoretical model, showing a negative effect of the interaction term are the majority (22 out of 34), with a large heterogeneity among them. Within these groups, we find the Mediterranean and Middle-Eastern countries, most Nordic countries in the sample (except for Norway), along with the Anglo-Saxon countries (Canada, UK, and US) outside Oceania, Chile, and Japan. In examining the group of countries deviating from our theoretical predictions, we find a cluster comprising mostly European nations, Australia, New Zealand, and Norway. It is worth noting that the European block in this cluster excludes Germany, Poland, and Slovakia, making it more difficult to find a common pattern across the clusters.
In summary, our results highlight the presence of class-size effects in some countries, while in others, population growth does not seem to affect human capital efficiency. Our findings suggest that the quality of the education system may partially explain these differences. However, the relationship remains heterogeneous and requires further investigation, as it carries important implications for future economic policy decisions.
Robustness
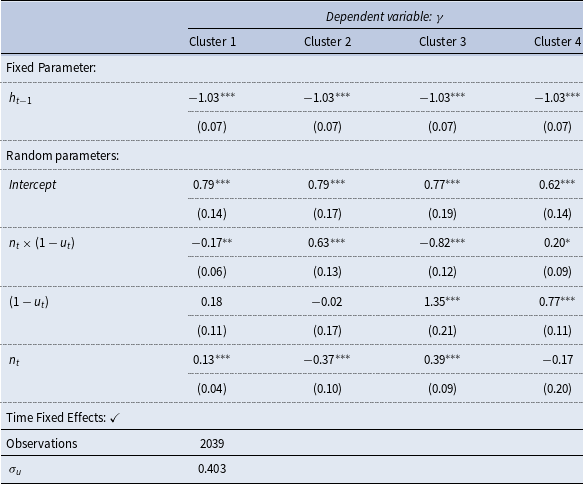
Table A.4 presents a modified version of the model, which incorporates the one-period lagged value of the HC index, denoted as
 $h_{t-1}$
, as a control variable. Notably, in this specification, the optimal number of clusters is four, compared to five in the static case, making direct comparisons with the previous results infeasible.
Under this setup, the fixed parameter associated with
 $h_{t-1}$
is significant and exhibits a negative effect on the dependent variable. The random parameters, however, display varying effects across clusters. Compared to the primary specification, these parameter estimates are generally less precise. Specifically, the interaction term
 $n_t\times (1-u_t)$
has a negative effect on
 $\gamma$
in Cluster 1 and Cluster 3, while exhibiting a positive effect in Cluster 2 and Cluster 4.
These findings highlight the heterogeneous influence of random parameters on the dependent variable across clusters, underscoring the value of employing a mixture model approach. Overall, the results reaffirm the complexity of the relationship between the predictors and the dependent variable, emphasizing the nuanced dynamics captured by this clustering methodology.
5. Conclusion
In this paper, we presented a novel perspective on the relationship between population growth and the growth of real per capita GDP and human capital. Drawing on the work of Lucas (Reference Lucas1988) and Boucekkine et al. (Reference Boucekkine, Martínez and Ruiz-Tamarit2013), we developed a model that illustrates a non-monotonic long-run influence of diminishing population on these growth metrics. Our main theoretical finding is that the impact of a negative population growth rate on a country’s long-term real per capita income and human capital growth can vary, depending on whether the altruism toward future generations exceeds or falls short of the class-size effects on human capital investment.
We applied our model to OECD data. We use a FMM to address the unobserved heterogeneity arising from the non-monotonic and non-uniform relationship between population change and human capital. This method also allowed us to perform a cluster analysis, categorizing countries based on their long-term growth rates’ homogeneity in relation to the estimated latent factors.
The FMM reveals that parameter heterogeneity is a significant issue when analyzing the macroeconomic impact of the class-size effects. Our findings, which appear to be robust to different specifications, contribute to the extensive literature on this topic by providing empirical evidence on the relationship between population dynamics, human capital accumulation, and economic development using publicly available cross-country data.
Acknowledgement
We would like to thank the Editor an Associate Editor and two anonymous reviewers of this journal for providing extremely competent and constructive suggestions on a previous draft of the paper. All remaining omissions and errors are solely ours.
Supplementary material
To view supplementary material for this article, please visit https://doi.org/10.1017/S1365100525000185
A. Appendix
A.1 Tables and Figures
Descriptive statistics, OECD sample

LogLikelihoods and penalized criteria for model in Table 2

Population growth and GDP growth, model in Table 2

Finite mixture model II

Note:
 $^{***}p\lt 0.001$
;
 $^{**}p\lt 0.01$
;
 $^{*}p\lt 0.05$
. Standard errors in brackets.
Pupil-teacher ratio and class-size effects.

Government expenditure per student and class-size effects.