Introduction
According to the National Institute of Statistics (INS, 2006), more than half the total number of dairy cows and suckling cows in Belgium belong to the Belgian Blue breed. About one-third of Belgian beef is produced by fattening the Belgian Blue bull and a good proportion of the residual production comes from culled Belgian Blue cows (Cabaraux et al., Reference Cabaraux, Dufrasne, Roux, Istasse and Hornick2005; Cuvelier et al., Reference Cuvelier, Cabaraux, Dufrasne, Clinquart, Hocquette, Istasse and Hornick2006).
Since the creation of the Belgian Blue Herd-Book in 1973, breed selection has become increasingly oriented towards meat type and has succeeded in producing animals with highly developed hindquarters, expressing the double-muscled gene. This has the advantage of producing animals with a high carcass yield and carcasses with a high proportion of muscle (78.1%), minimal fat (7.5%) and minimal bone (13.4%) (Michaux et al., Reference Michaux, Stasse, Sonnet, Leroy and Hanset1983). Owing to these specific features, however, the Belgian Blue bull is demanding in terms of feeding, having specific needs with regard to digestible proteins and net energy (De Campeneere et al., Reference De Campeneere, Fiems and Boucqué2001a), along with reduced intake capacity compared with animals with a normal conformation (Fiems et al., Reference Fiems, Cottyn, Boucqué, Bogaerts, Van Eenaeme and Vanacker1997). An earlier study (Rondia et al., Reference Rondia, Froidmont, Beckers, Decruyenaere and Bartiaux-Thill2006) showed that a conventional diet based on soybean meal (SBM) and maize silage, formulated to meet the needs of the Belgian Blue bull according to Dutch standards, failed to supply the essential amino acids (EAA). Feeding a supplement enriched with certain EAA increased the animals’ mean daily weight gain by 250 g/day and improved the use of dietary N. Unfortunately, many amino acids (AAs) are likely to be co-limiting in cattle bred for meat production (Merchen and Titgemeyer, Reference Merchen and Titgemeyer1992; Zinn and Shen, Reference Zinn and Shen1998). In addition, the type of AA used in the supplement made them uncompetitive economically. It would be interesting to find protein sources offering better biological value than conventional protein sources in order to optimise the diet formulation for such cattle.
Under many feeding conditions, most of the digestible protein is supplied by micro-organisms in the rumen (Clarck et al., Reference Clarck, Klusmeyer and Cameron1992). These proteins have a good AA pattern, but lack Met and Lys (Richardson and Hatfield, Reference Richardson and Hatfield1978; Storm and Ørskov, Reference Storm and ∅rskov1984), compared with the composition of the ideal protein. At most, they result in a mean daily weight gain of 1 kg/day (Titgemeyer and Merchen, Reference Titgemeyer and Merchen1990). SBM is one of the main protein sources fed as a supplement to Belgian Blue bulls and, like all leguminous proteins, contains little Met and is largely degraded in the rumen (0.67, Sauvant et al., Reference Sauvant, Perez and Tran2002). Proteins from cereal co-products are richer in Met, but quite often have a low Lys content. Among the other protein sources produced in Europe, potato protein concentrate (PPC) is distinguished by its high Met and Lys content, reaching 2.2% and 7.6% of CP, respectively (Sauvant et al., Reference Sauvant, Perez and Tran2002). The production comes entirely from European countries and was estimated to be 80 000 T in 2007. In sacco measurements indicate that this protein source has the advantage of being hardly degraded in the rumen (0.43, Sauvant et al., Reference Sauvant, Perez and Tran2002; 0.28, Krzywiecki et al., Reference Krzywiecki, Bodarski, Piechota and Wertelecki2003), and ought therefore to be a very good complement to protein of microbial origin. Several studies have mentioned the high biological value of PPC for children (Lopez de Romana et al., Reference Lopez de Romana, Maclean, Placko and Graham1981), piglets (Kerr et al., Reference Kerr, Goodband, Smith, Musser, Bergström, Nessmith, Tokach and Nelssen1998) and calves (Montagne et al., Reference Montagne, Toullec and Lallès2001 and Reference Montagne, Crévieu-Gabriel, Toullec and Lallès2003). A comparison of its EAA pattern with SBM shows that PPC is proportionally richer in seven of the nine EAA (Sauvant et al., Reference Sauvant, Perez and Tran2002). Its nutritional value for beef cattle has not hitherto been studied in detail.
The main aims of this study were as follows:
1. To compare the nutritional value, based on in vivo measurements, of PPC and SBM for growing double-muscled Belgian Blue bulls.
2. To gauge the ability of PPC to improve the EAA pattern of the digestible protein compared with SBM when used at practical incorporation rates in diets formulated according to the Dutch feed evaluation system.
3. To assess the need to improve the EAA pattern of the digestible protein under these feeding conditions.
Material and methods
Animals
Four Belgian Blue bulls (initial body weight (BW): 315 ± 21.9 kg, final BW: 379 ± 30.4 kg), fitted with a ruminal cannula (67 mm i.d.) and a T-type cannula in the proximal duodenum and the terminal ileum, were individually penned (1.5 m × 2.5 m). The experimental protocol was approved by the Walloon Agricultural Research Centre Animal Care and Use Committee, and followed the ethical policy of the journal.
Treatments
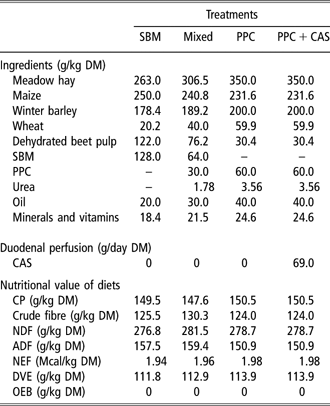
Three iso-N and iso-net energy diets were formulated to supply the animals with 112 g of true digestible protein in the small intestine, according to Dutch standards (DVE) and 1.96 Mcal of net energy for fattening (NEF) in line with the Dutch feed evaluation system (Van Es and Van der Honing, Reference Van Es and Van der Honing1977; Tamminga et al., Reference Tamminga, Van Straalen, Subnel, Meijer, Steg, Wever and Blok1994). The diets differed in terms of the origin of the greater part of the protein, which was supplied by SBM (‘SBM’ treatment), PPC (‘PPC’ treatment – Tubermine® GP, Roquette, Lestrem, France) or an iso-N mixture of these two protein sources (‘mixed’ treatment’; Table 1). The SBM and/or PPC were added to the diet in order to provide 30% of the dietary DVE. The rumen degradable protein balance according to Dutch standards (OEB) of the diets was 0 g/kg dry matter (DM), reflecting a perfect balance in the supply of fermentable nutrients. The diets were formulated to supply similar amounts of acid detergent fibres (ADF), neutral detergent fibres (NDF) and crude fibres, and also to provide 95 g of DVE per 1.65 Mcal of NEF, a ratio considered optimum for the Belgian Blue bull during the growing period (De Campeneere et al., Reference De Campeneere, Fiems and Boucqué2001a).
Composition and nutritional value of diets and nature of treatments

SBM = soybean meal; PPC = potato protein concentrate; CAS = sodium caseinate; NEF = net energy for fattening; DM = dry matter; DVE = true digestible protein in the small intestine according to the Dutch standard; OEB = rumen degradable protein balance calculated according to the Dutch standards.
A fourth treatment (‘PPC + CAS’) consisted of ‘PPC’ supplemented by 9.5% theoretical DVE supplied by continuous duodenal perfusion of sodium caseinate (CAS; Table 1). This treatment was included in order to assess the need to improve the EAA pattern of the digestible protein under our experimental conditions. CAS was chosen for the high biological value of its proteins and complete digestibility in the small intestine (Froidmont et al., Reference Froidmont, Beckers and Théwis2000). The treatments were implemented according to a 4 × 4 Latin square design.
The intake level was fixed at 81 g/kg0.75 per day at the start of the experiment. The diets were fed twice a day (0800 and 2000 h) in equal amounts and fresh water was available at all times. Throughout the experiment, chromic sesquioxide (10 g/meal) was administered in the rumen just before the meals in order to determine the nutrient flows in the digestive tract. Refusals were collected daily before the morning feed, weighed and then dried at 60°C.
Experimental protocol and sample collection
The perfusion solution was prepared daily by mixing CAS (69.0 g/day on average) with warm water. The weight of the solution was adjusted to exactly 6 kg. It was changed each morning and administered with the aid of a peristaltic pump (Watson-Marlow, model 502S, Zwijnaarde, Belgium) adjusted to deliver the whole solution continuously at a constant rate over 23½ h.
Each experimental period consisted of 5 days for diet adaptation and 10 days of sampling. Samples of the diets were obtained for each period and kept at an ambient temperature until analysis. Faeces were collected daily for the first 7 days of sampling, sampled (approximately 400 g of DM) and then frozen until analysis. Over the same period, all the urine was collected with the aid of a collector similar to that described by Veenhuizen et al. (Reference Veenhuizen, McGilliard and Young1984), and weighed and sampled (100 ml) daily before freezing. During collection, the urine was regularly acidified (2 N H2SO4) to keep the pH always below 3 and thus prevent ammonia volatilisation. On sampling day 8, duodenal and ileal samples (approximately 400 ml) were collected 0, 3, 6 and 9 h after the morning meal and frozen at −20°C. Blood was taken from the jugular vein 3 h after the morning feed, using tubes containing EDTA as an anti-coagulant (Becton Dickinson Venoject Vacutainer, EDTA K3 Sol, NJ, USA). On sampling day 9, free bacteria present in the duodenal content, sampled as on the preceding day, were isolated as described by Poncet and Rémond (Reference Poncet and Rémond2002) and pooled per animal before freezing and analysis. The last sampling day was devoted to ruminal fluid collections (approximately 1 l) 0, 2, 4, 6, 8 and 10 h after the morning meal.
Laboratory analyses
Concentrate, hay and feed refusals gathered per animal for each sampling period were ground through a 1 mm screen (Fritsch, Pulverisette 14, Idar-Oberstein, Germany) before the DM, ash and N (Association of Official Analytical Chemists, AOAC, 990.03, 1990), crude fibre (AOAC, 962.09, 1990), ADF (AOAC, 973.18, 1990) and NDF (Van Soest et al., Reference Van Soest, Robertson and Lewis1991) analyses were conducted. The diet ingredient samples were also analysed using NIRS (FOSS NIRSystems, MD, USA, local procedure of WINISI 1.5 software for concentrate, global procedure of WINISI 1.5 software for hay) in order to deduce the theoretical NEF, DVE and OEB content (Centraal Veevoederbureau, CVB, 2000).
After freeze-drying and grinding (1 mm), the DM, ash, N (AOAC, 990.03, 1990) and chromic sesquioxide (François et al., Reference François, Thill and Théwis1978) were determined in the faeces. After thawing the samples, total N (AOAC, 990.03, 1990) was also determined in the urine samples.
The pH of ruminal fluid was measured (Combo, Hanna, Temse, Belgium) just before filtration (250 μm). A 250 ml sample was then retained for subsequent analyses and the rest was returned directly to the rumen. After centrifugation (1.200 g × 10 min), the supernatant was acidified with H2SO4 to pH 3 for ammonia nitrogen (N-NH3) determination (AOAC, 941.04, 1984).
Duodenal and ileal samples were freeze-dried, ground through a 1 mm screen and pooled per animal and experimental period before the DM, ash, N (AOAC, 990.03, 1990), N-NH3 (AOAC, 941.04, 1984), chromic sesquioxide (François et al., Reference François, Thill and Théwis1978) and purine (Valkeners et al., Reference Valkeners, Théwis, Amant and Beckers2006) were determined. A sub-sample of the intestinal content was ground to 0.5 mm to determine the AA after acid hydrolysis (25 mg of sample in 15 ml of HCl 6 N at 110°C for 21 h), following an HPLC method (Cohen and Strydom, Reference Cohen and Strydom1988). Met and Cys were determined separately after protection by performic oxidation (Cohen and Strydom, Reference Cohen and Strydom1988). The N (AOAC, 990.03, 1990) and purines (Valkeners et al., Reference Valkeners, Théwis, Amant and Beckers2006) were measured on bacteria samples. Their organic matter (OM) content was also determined on bacteria pooled per diet.
The blood was centrifuged at 2.600 × g for 15 min immediately after collection. The plasma was extracted and frozen in order to analyse free AA (Cohen and Strydom, Reference Cohen and Strydom1988) after precipitating the proteins with NaOH and filtering at 0.2 μm.
Calculations and statistical analyses
Statistical analyses were conducted following the GLM procedure in the Statistical Analysis System Institute Software (SAS, 2004, version 9.1.3), using an ANOVA model corresponding to a Latin square design. Three effects (animal, period and treatment) were considered for intake, the ruminal degradability of the nutrients, the microbial proteosynthesis yield, the supply of digestible nutrients, the nutrient digestibility, the plasma AA content, the N balance components and the rumen fermentation parameters at each sampling hour. Least-square means were presented and the statistical incidence of ‘SBM’ v. ‘mixed’, ‘PPC v. mixed’, ‘SBM’ v. ‘PPC’ and ‘PPC’ v. ‘PPC + CAS’ was evaluated by using orthogonal contrasts.
The nutrient flows in the duodenum and ileum and the faecal output were calculated with reference to chromic sesquioxyde. The proportion of microbial N flowing in the duodenum was calculated by dividing the duodenal purine : N ratio by the corresponding purine : N ratio of duodenal bacteria. The apparent degradability of a nutrient was calculated by relating the amount of this nutrient apparently disappearing from the rumen (intake – total duodenal flow) to the intake of this nutrient. The true degradability of a nutrient was calculated by relating the amount of this nutrient really disappearing from the rumen (intake – total duodenal flow + microbial duodenal flow) to the intake of this nutrient.
The ruminal degradability of the N supplied by the SBM and PPC was assessed by the difference method. In the case of ‘SBM’ and ‘PPC’, therefore, the duodenal supply of dietary N (DDN) from the SBM or PPC was determined by deducting from the total DDN flow the portion provided by the other ingredients (Eq.
(1)). This was estimated by taking into account the daily quantity of N supplied by each raw material other than SBM and PPC and the theoretical ruminal N degradability (RND) of their respective fractions (Eq.
(2)). The values of these RND were 0.67 (Baumont et al., Reference Baumont, Dulphy, Sauvant, Tran, Meshy, Aufrère, Peyraud and Champciaux2007), 0.43, 0.71, 0.76, 0.52 and 1.00 (Sauvant et al., Reference Sauvant, Perez and Tran2002) for hay, maize, winter barley, wheat, dehydrated beet pulp and urea, respectively. Total DDN was estimated by deducting the microbial N flow assessed using the purines as a bacterial marker and the endogenous N flow (1.9 g/kg DMI – National Research Council, NRC, 2001) from the total duodenal N flow (Eq.
(3)). According to Hvelplund (Reference Hvelplund1985), intestinal protein perfusion does not alter the endogenous protein secretions:

All values in g/day.

All values in g/day except for RND.

The RND of the SBM (or PPC) was then calculated according to Eq.
(4):

All values in g/day except for RND.
According to Dutch feeding standards (Tamminga et al., Reference Tamminga, Van Straalen, Subnel, Meijer, Steg, Wever and Blok1994), the DVE content of a diet corresponds to the sum of digestible proteins of dietary (DVBE) and microbial (DVME) origin in the small intestine minus its contribution to faecal endogenous protein losses (DVMFE). The DVE supply with the different diets was calculated from in vivo measurements according to Eq.
(5):

In the DVE/OEB system (Tamminga et al., Reference Tamminga, Van Straalen, Subnel, Meijer, Steg, Wever and Blok1994), DVMFE are fixed at 75 g/kg indigestible DM. DVME corresponds to the duodenal flow of microbial proteins multiplied by their true digestibility in the small intestine (0.85) and their AA content (0.75). The DVBE represents the duodenal flow of dietary proteins corrected by their true digestibility (0.80).
The OEB value represents the balance between the N and the energy available for microbial proteosynthesis in the rumen. According to Tamminga et al. (Reference Tamminga, Van Straalen, Subnel, Meijer, Steg, Wever and Blok1994), 150 g of microbial proteins per kg of truly fermentable organic matter (FOM) are synthesised in the rumen. Thus, the OEB value of the diets was estimated from in vivo measurements using Eq.
(6), where the difference between N intake and total DDN represented the N used for microbial proteosynthesis in the rumen:

All values in g/kg DM.
Results
Rumen fermentation parameters
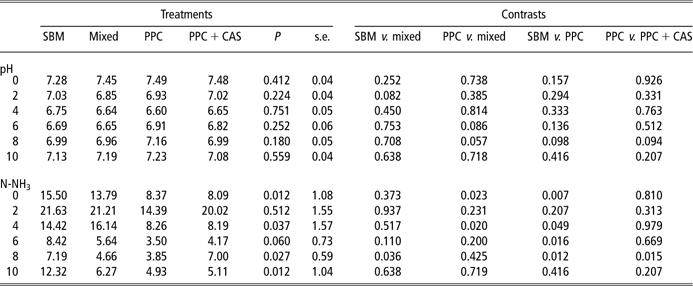
Treatments did not influence the pH of the rumen fluid at any time after the meal, but induced some variations in the N-NH3 concentration (Table 2). The main difference identified by the contrasts analysis concerned the lower N-NH3 concentration with ‘PPC’ compared with ‘SBM’ at several sampling times.
Evolution of pH and NH3-N (mg/dl) concentration of rumen fluid after the meal (postprandial hours) depending on treatments

SBM = soybean meal; PPC = potato protein concentrate; CAS = sodium caseinate.
Intake, degradability and digestibility of nutrients
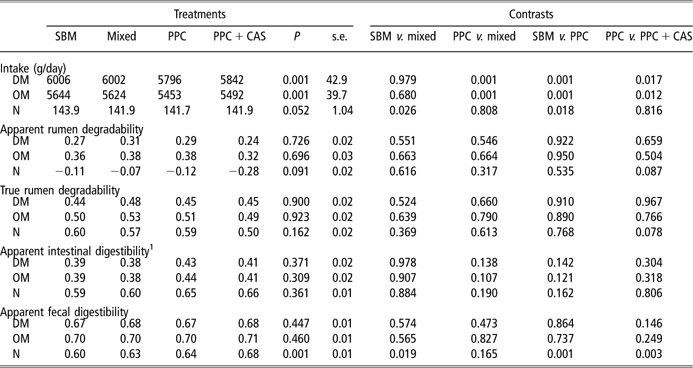
Due to refusals, DM intake decreased by 3% with the PPC-based treatments (Table 3) and significantly affected the nutrient intake, even if absolute differences were slight. No effect of treatments was observed in rumen degradability, but infusing CAS in the small intestine tended to decrease N degradability. The nutrient digestibility in the small intestine remained unchanged, whereas faecal N digestibility was increased by PPC-based treatments.
Intake and digestibility of DM, OM and N according to treatments

1Expressed in relation to the duodenal flow.
PPC = potato protein concentrate; SBM = soybean meal; CAS = sodium caseinate; DM = dry matter; OM = organic matter.
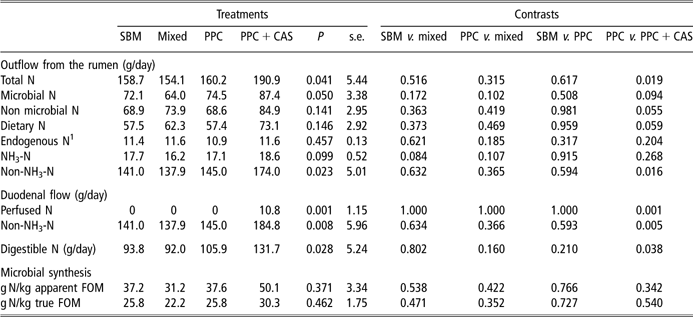
The origin of N outflow from the rumen, corresponding to the duodenal flow without taking the infusion into account, did not differ among ‘SBM’, ‘mixed’ and ‘PPC’ (Table 4). Surprisingly, the CAS infusion increased the rumen N outflow while acting as much on the dietary N than on the microbial N component (P < 0.1), and thus induced a significant increase in the digestible N supply. The microbial proteosynthesis yield per unit of FOM did not differ among treatments.
Origin of duodenal N flows, digestible N supply and efficiency of rumen proteosynthesis according to treatments

1Estimated at 1.9 g/kg DMI (NRC, 2001).
SBM = soybean meal; PPC = potato protein concentrate; CAS = sodium caseinate; FOM = fermentable organic matter.
The degradability of SBM and PPC proteins calculated according to Eq. (4) was 0.60 and 0.43, respectively. These values accord with those proposed by Sauvant et al. (Reference Sauvant, Perez and Tran2002), 0.63 and 0.43, respectively, but are higher than those quoted by Krzywiecki et al. (Reference Krzywiecki, Bodarski, Piechota and Wertelecki2003), 0.54 and 0.28, respectively.
On the basis of the microbial and dietary protein flows in the duodenum, the digestible protein supply according to the Dutch protein evaluation system (Eq. (5)) was estimated at 81, 80, 87 and 110 g/kg DM intake for ‘SBM’, ‘mixed’, ‘PPC’ and ‘PPC + CAS’, respectively.
The OEB contents of the diets, calculated with Eq. (6) on the basis of an in vivo measurement of N used by micro-organisms, amounted to 7.6, −2.4, +6.0 and −6.0 g/kg DM for ‘SBM’, ‘mixed’, ‘PPC’ and ‘PPC + CAS’, respectively, and were close to the balance expected from standard values (CVB, 2000).
Nitrogen balance
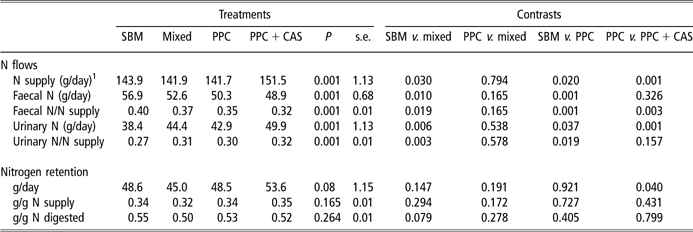
The N supply was greater with ‘PPC + CAS’ due to the CAS perfusion (Table 5). For a valid treatment comparison, excretions of N in the faeces and urine were expressed in relation to the N supply. The proportion of N excreted in the faeces was higher with ‘SBM’. Conversely, the proportion of N excreted in the urine was lower with ‘SBM’ and higher with CAS infusion. Daily N retention was similar for ‘SBM’, ‘mixed’ and ‘PPC’, but increased with CAS infusion. No significant differences were observed in the utilisation of supplied and digested N with treatments.
Nitrogen balance according to treatments

1Corresponding to N intake and N infused.
SBM = soybean meal; PPC = potato protein concentrate; CAS = sodium caseinate.
Supply of digestible AAs and plasma AAs
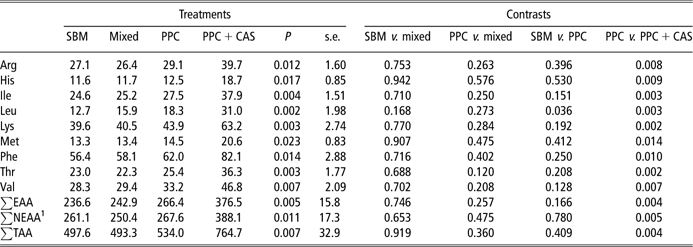
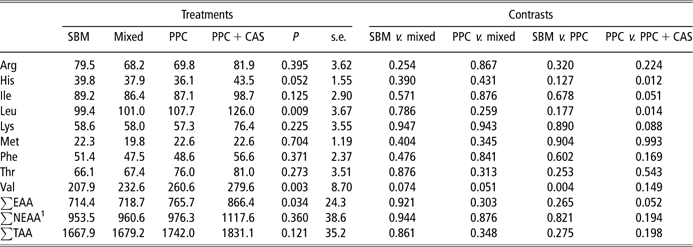
Supplies of digestible EAA were similar for ‘SBM’, ‘mixed’ and ‘PPC’. CAS infusion significantly increased the supply of all EAA (Table 6). Except for Val (‘SBM’: 5.7% v. ‘PPC’: 6.2% of total AA) and Phe (‘PPC + CAS’: 1.1% v. ‘PPC’: 1.2% of total AA), the EAA pattern of the digestible protein did not vary with treatments (P > 0.05, data not shown). Table 7 shows that the plasma EAA contents remained relatively stable in the case of ‘SBM’, ‘PPC’ and ‘mixed’ and that the increased plasma content noted with ‘PPC + CAS’ varied according to the AA.
Digestible AA supplied by the treatments

1NEAA = Ala, Asp, Cys, Glu, Gly, Pro, Ser, Tyr.
SBM = soybean meal; PPC = potato protein concentrate; CAS = sodium caseinate; EAA = essential amino acids; NEAA = non-essential amino acids; TAA = total amino acids.
Plasma AA concentrations according to treatments

1NEAA = Ala, Asp, Cys, Glu, Gly, Pro, Ser, Tyr.
SBM = soybean meal; PPC = potato protein concentrate; CAS = sodium caseinate; EAA = essential amino acids; NEAA = non-essential amino acids; TAA = total amino acids.
Discussion
Rumen fermentation parameters
The postprandial pH of the ruminal fluid did not differ with treatments. The values were surprisingly high and should be viewed with caution. They suggest, however, that the rumen environment favoured cellulolytic bacteria in all treatments.
The main difference in rumen parameters concerned the lower N-NH3 concentration in rumen fluid with ‘PPC’ v. ‘SBM’. This suggests that protein supplied by ‘PPC’ might have been less degraded in the rumen despite the diets being balanced in terms of OEB supply. However, this hypothesis is not confirmed to the look of the microbial and the dietary N outflows from the rumen that did not differ between these treatments. The interpretation of N-NH3 concentration seems to be difficult in this case. Logically, the CAS infusion had no effect on the N-NH3 concentration of the ruminal fluid.
Except for ‘PPC’, more than 6 h after the meal, the N-NH3 concentrations were almost always greater than 5 mg/dl, which is considered sufficient to meet the available N needs of the ruminal micro-organisms and ensure efficient ruminal proteosynthesis (Dehareng and Ndibualonji, Reference Dehareng and Ndibualonji1994).
Intake, degradability and digestibility of nutrients
PPC is likely to contain protease inhibitors and glycoalkaloids (Smith et al., Reference Smith, Roddick and Jones1996) that can interfere with appetence (Tuśnio et al., Reference Tuśnio, Pastuszewska, Święch and Buraczewska2007). Intake was lower with PPC-based treatments, but the absolute differences were slight (Table 3) and probably not related to the presence of anti-nutritional factors, as stated by Montagne et al. (Reference Montagne, Crévieu-Gabriel, Toullec and Lallès2003) who used the same PPC source as in this trial.
The apparent degradability of N in the rumen tended to be lower with CAS infusion. As N intake was similar for ‘PPC’ and ‘PPC + CAS’, the variation in apparent N degradability with these treatments, i.e. 16.6% of the N intake (23.5 g/day) can be wholly attributed to perfusion. The fact that the quantity of N from the CAS was only 10.8 g/day suggests that continuous perfusion resulted in a saving of ruminal N. This could be due to either a reduction in N-NH3 transfers diffusing through the ruminal wall to the blood pool or to more efficient urea recycling in the rumen (Sauvant and Van Milgem, Reference Sauvant and Van Milgem1995).
The increase in the total N outflow from the rumen with CAS infusion confirms the assumption of a greater saving of ruminal N. This is also the only possible explanation for the simultaneous increase in the flows of microbial and dietary proteins for the same N intake. Lapierre and Lobley (Reference Lapierre and Lobley2001) considered N movements through the digestive tract to be twice as high as the N intake. This study also shows that any change of diet is likely to have a considerable effect on N recycling in the ruminant, due to the supply of either energy or proteins, and that the extent of such changes cannot always be predicted.
Nitrogen balance
Compared with the ‘mixed’ and ‘PPC’ treatments, ‘SBM’ induced a higher proportion of faecal N and a lower proportion of urinary N related to N supply. This accords with the differences observed in faecal N digestibility.
CAS infusion increased N retention by 5.1 g/day compared with ‘PPC’, corresponding to a CAS N efficiency of 0.47. According to De Campeneere et al. (Reference De Campeneere, Fiems, De Paepe, Vanacker and Boucqué2001b), a 1 kg weight gain contains 32.1 g N. The increase in N retention with CAS perfusion, therefore, corresponded to a theoretical mean daily weight gain of 160 g/day. The N efficiency of the N supply and the digested N did not differ among treatments, indicating that the digestible protein quality was not modified.
‘Mixed’, ‘PPC’ and ‘SBM’ treatments were characterised by equivalent digestible protein supplies, in terms of both quantity and origin, as well as by identical performance levels. At the supplementation rates used, PPC therefore offered no advantages over SBM in terms of digestible protein supply. Despite a more favourable EAA pattern, Taciak and Pastuszewska (Reference Taciak and Pastuszewska2007) showed no significant difference in the biological value of PPC proteins compared with SBM proteins in the rat. Oosting et al. (Reference Oosting, Velmmix and Van Bruchem1994) showed the value of PPC in increasing N retention in steers, but the quality of the digestible proteins supplied by the ammoniated wheat straw rations they used was inferior to that in our trial. In sheep, the same team (Oosting et al., Reference Oosting, Van Bruchem and Chen1995) showed that PPC led to a greater increase in N retention than casein supplementation of the feed, due to its lower rumen degradability.
Supply of digestible AAs and plasma AAs
The higher supply of EAA by ‘PPC + CAS’ induced a higher N retention. The EAA supply was similar for the other treatments, thereby accounting for the lack of any difference in the respective N retention values.
At the supplementation rates used, it appears that the differences in the AA pattern of SBM and PPC were not enough to cause significant changes in the digestible protein composition. Ludden and Cecava (Reference Ludden and Cecava1995) and Cecava and Parker (Reference Cecava and Parker1993) have already shown the difficulty of altering the available AA pattern when the flow of digestible proteins supplied by the basic ration is high. Admittedly, the dietary protein flow represented no more than 37% of the duodenum proteins and the SBM or PPC provided only about one-third of that flow, despite being the main protein source(s) in the diets. As for the other parameters, the formulation of balanced diets in terms of CP, DVE, NEF, OEB and fibres induced some variations in their ingredient proportions that could slightly affect the results, but it seems clear that PPC did not significantly improve the digestible nutrients compared with SBM in this trial.
Of all the AA, Met showed the greatest plasma concentration stability from one treatment to another (P = 0.704) and remained unchanged between ‘SBM’ and ‘PPC’ and with CAS infusion. It was probably limiting under our experimental conditions. Supplies of Met were 305, 298, 299 and 384 mg/g retained N for ‘SBM’, ‘mixed’, ‘PPC’ and ‘PPC + CAS’, respectively. Froidmont (Reference Froidmont2001) determined the digestible Met requirement of Belgian Blue bulls as 330 mg/g retained N. The Met supplied by the treatments without perfusion was very close to the need thus determined. This study also determined Phe (503 mg/g retained N) and Thr (<276 mg/g retained N) requirements, which were largely met under our experimental conditions.
Conclusion
This study confirmed the low rumen degradability of PPC based on in vivo assessments. Nevertheless, under our experimental conditions, replacing SBM by PPC did not increase the animals’ nitrogen retention, due to the limited effect on the AA pattern of the digestible protein, and is therefore of little interest. Although the diets were supposed to meet the animals’ DVE and NEF needs according to the Dutch feed evaluation system, it was found that a CAS supplement perfused into the duodenum, corresponding to 9.5% of the DVE intake, increased the animals’ nitrogen retention. Perfusion did not lead to better use of the animal’s total N intake, however, suggesting that the Dutch feed evaluation system resulted in N-efficient ration formulation. The results reveal the need for a better understanding of the factors controlling N transfers between the blood and the digestive tract and of their significance in the supply of digestible proteins.