Background
Electron cryomicroscopy of biological molecules has recently undergone a revolution (detailed in Reference Reference Kühlbrandt1), resulting in hundreds of new structures that were previously undeterminable by any method. Electron cryomicroscopy methods have been used for many years,Reference Dubochet, Adrian, Chang, Homo, Lepault, McDowall and Schultz2 but remain under development as we reach a deeper understanding of the radiation physics and electron imaging process involved. A recent synopsis contains a comprehensive review of many aspects of electron cryomicroscopy, from detectors to specimen preparation, to data processing and analysis.Reference Crowther3 Reviews of radiation damage in the electron microscope have also recently been published.Reference Glaeser4–Reference Egerton6 Here, we point out some key ideas about radiation damage that underpin the success of electron cryomicroscopy for biological specimens, describe how these might be applied to radiation-sensitive specimens in materials science, and look to important remaining questions about radiation damage in the transmission electron microscope or scanning transmission electron microscope.
Radiation damage in the electron microscope: Types of damage and when to worry
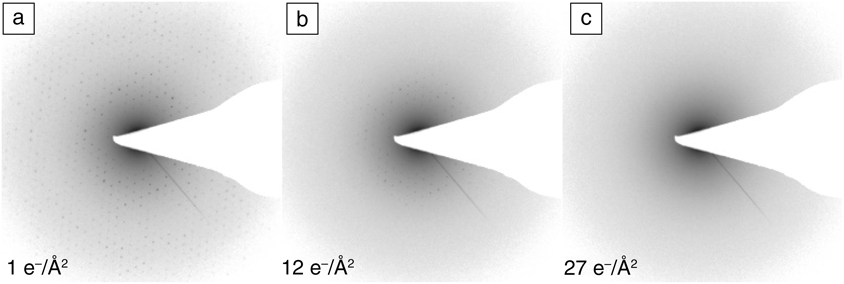
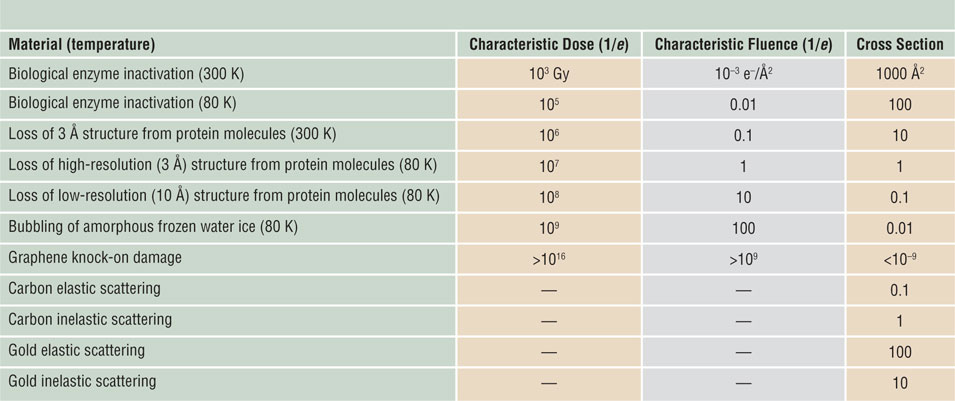
Beam-sensitive specimens in an electron microscope are damaged as a result of inelastic scattering of primary electrons, which excite atomic electrons to higher energy levels with a probability determined by a total-inelastic cross section. The atom or molecule quickly loses its excess energy, but might not return to its original ground state, resulting in the breakage of chemical bonds and a permanent change in structure known as ionization damage or radiolysis. In the case of a crystal, structural change can be monitored from the electron diffraction pattern (Figure 1).Reference Peet, Henderson and Russo7 The fluence (electrons per unit area) at which a particular diffraction spot fades to a fraction of its original intensity (by a factor of e = 2.718) is called a characteristic fluence (or dose) and is the reciprocal of a damage cross section. Longer-range atomic motion leads to the escape of volatilized material from the specimen’s surface into vacuum, known as mass loss. Cooling a specimen below room temperature reduces the radiolysis efficiency (or damage cross section) and thereby increases the characteristic dose for these processes (Table I).Reference Glaeser8,Reference Reimer and Kohl9
Sequential electron diffraction patterns of bacteriorhodopsin 2D crystals (purple membrane) versus dose at 80 K and 100 keV.Reference Peet, Henderson and Russo7 (a–c) As the fluence (dose) increases, the spots fade, indicating cumulative radiation damage to the crystal. (c) By approximately 30 e–/Å2, all of the high-resolution information is lost and the background amorphous ring is increased, indicating that the organic molecules comprising the protein have been destroyed by the beam and are eventually converted to a semi-amorphous hydrocarbon. Highest resolved spot in (a) is ∼3 Å and sets the scale for all panels.

Typical orders of magnitude for characteristic doses and damage cross sections for different specimens.
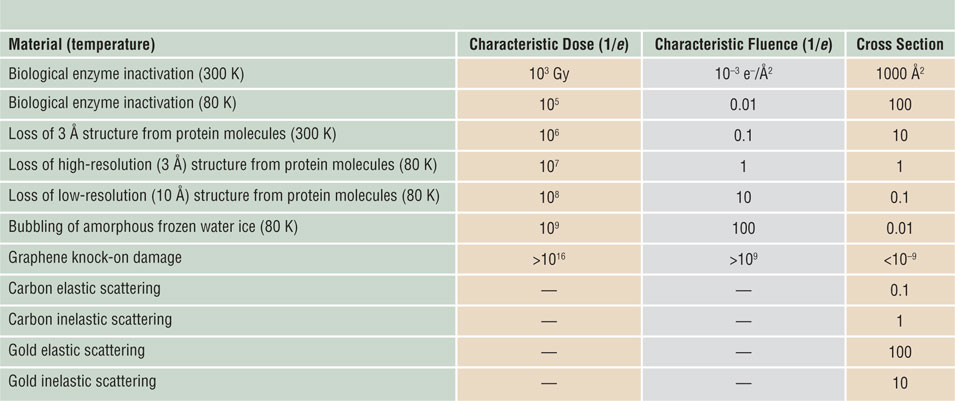
Fluences and cross sections are for 100 keV electrons.Reference Glaeser8,Reference Reimer and Kohl9 Note: e–, electrons; e, base of natural logarithm.
In electrically conducting materials (metals and semiconductors), the abundance of free electrons quenches radiolysis, leaving high momentum transfer elastic scattering as the only damage mechanism. Most elastic collisions involve small scattering angles and negligible energy transfer, which does not create damage, but provides diffraction patterns and amplitude or phase contrast in transmission electron microscopy (TEM) images. Large-angle collisions are rare (low elastic cross section), but they can transfer several eV of energy to atomic nuclei, resulting in atom displacement and so-called knock-on damage. This process requires a primary-beam energy above a threshold that depends on the atomic number and binding energy. For atoms located within a specimen, this threshold is typically hundreds of keV, but for surface atoms, the threshold is lower. Atoms of low atomic number (Z) can be ejected into vacuum (beam-induced sputtering) at normal primary energies. But the efficiency of these knock-on processes is low; radiolysis is the predominant damage mechanism for most beam-sensitive samples, especially organic or biological specimens.Reference Egerton10
Following from the previous discussion, the predominant damage mechanism can often be guessed from the electrical conductivity of the specimen, from the temperature or kV dependence of the damage, and from the value of the characteristic fluence (Table I).Reference Glaeser8,Reference Reimer and Kohl9
Increasing dose without damage: The power of averaging
There are three key ideas that underpin the success of electron cryomicroscopy:
1. Bright-field phase contrast provides the most information per electron from a weakly scattering thin specimen containing the molecules that are contained within living matter (carbon-, hydrogen-, nitrogen-, and oxygen-containing molecules embedded in water).
2. Lowering the temperature of a specimen reduces the mobility of frozen water and the reactive byproducts of radiation damage created by the beam, thus increasing the total dose (fluence) that can be used to record a micrograph, before the molecules are destroyed.
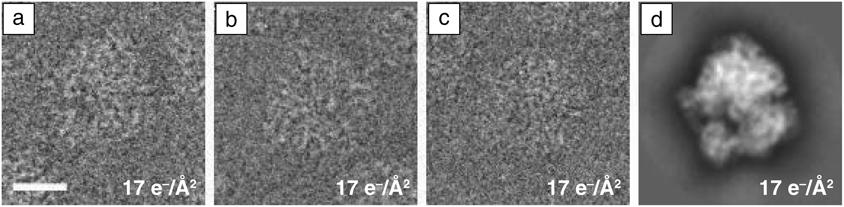
3. Averaging aligned images of identical molecules (taken at low dose) allows the image intensity and contrast to be increased without damage, assuming there is sufficient signal to align the images accurately with each other (Figure 2).
Images of ribosome versus dose and 2D class average of multiple images. (a–c) Individual images of the 70 S subunit of the bacterial ribosome. These images are part of a set of 368 individual particle images, which, after alignment in two dimensions and averaging, produce (d) the high signal, high-resolution image. This technique of averaging multiple low-dose images of identical copies of the same molecule or molecular complex is key to overcoming radiation damage in electron cryomicroscopy for biological specimens. Scale bar = 100 Å.

Bright-field phase contrast is the de facto standard for high-resolution imaging of a radiation-sensitive specimen because no other method has been able to extract as much information per unit damage from thin, low-atomic-number biological specimens at the low electron fluences required for organic or biological molecules. This combined with cooling the specimen to liquid nitrogen temperatures (∼80 K) allows preservation of the structure of fragile molecules as they are imaged. Even with these techniques, biomolecules are destroyed by the electron beam before a single high-resolution micrograph (<3 Å resolution) can be acquired. The trick to circumventing this apparently insurmountable barrier is to combine the signal from multiple exact copies of the same molecule.Reference Glaeser4 One possibility is to use a crystal, adding the scattered amplitudes from thousands or millions of molecules that are aligned with each other. Another even more powerful method (single-particle analysis, which does not require the formation of crystals) is to take many low-dose images of individual molecules and align them with each other computationally, and then add together the signal from these images to increase the signal without increasing the dose. An example of this procedure is shown in Figure 2. These ideas from electron cryomicroscopy are advantageous for radiation-sensitive specimens in materials science. Recent examples include the direct imaging of lithium atoms in cryo-preserved, radiation-sensitive battery materials,Reference Li, Pei, Yan, Sun, Wu, Joubert, Chin, Koh, Yu, Perrino, Butz, Chu and Cui11 and determining the structure of dendrites formed in a battery.Reference Zachman12
Despite the great success of these ideas, one should continue to search for new methods that might increase the amount of information available in the electron micrograph. Scanning transmission electron cryomicroscopy has recently been developed for imaging thicker biological specimens at cryogenic temperatures, where the effects of multiple scattering dominate image formation.Reference Wolf, Houben and Elbaum13 Multipass phase-contrast electron microscopyReference Juffmann, Koppell, Klopfer, Ophus, Glaeser and Kasevich14 (where the beam transits the specimen multiple times before detection) offers a theoretical improvement in the amount of contrast for a given amount of damage in a phase-contrast image, and prototype instruments are under development,Reference Koppell, Mankos, Bowman, Israel, Juffmann, Klopfer and Kasevich15 but there are considerable hardware challenges to be overcome before such a microscope will be feasible for general use. Compressed sensing, where the specimen is irradiated in a sparse pattern of locations, has been suggested as a means of reducing the dose required to create a scanning transmission electron microscopy (STEM) image of a specimen,Reference Collins and Midgley16 but improvements using this technique have been attributed to the effect of noise filtering.Reference Van den Broek, Reed, Beche, Verbeeck and Koch17
Dose-rate dependence of radiolysis: Some open questions
It is simplest to assume that the degree of radiation damage is proportional to the electron dose (current density times exposure time) or fluence (number of electrons per unit area) and independent of the dose rate (current density) or flux (electrons per unit area per second). This assumption has been validatedReference Glaeser4 for room-temperature organic specimens, whose high radiation sensitivity limits the incident-beam flux and fluence, and for traditional biological electron cryomicroscopy on two-dimensional (2D) crystals in the range up to about 1–10 e–/Å2 delivered in 1 ms to 100 s.Reference Glaeser, McMullan, Faruqi and Henderson18 Furthermore, the signal in high-resolution single-particle electron cryomicroscopy decays progressively with fluence to a small fraction of its maximum value within about 40 e–/Å2.Reference Scheres19 The initial change in signal in the first few frames is thought to be due to radiation-induced movement of the specimen that decreases rapidly within about 3–5 e–/Å2.Reference Henderson and Russo20 As far as we are aware, there are no data on the dose-rate dependence of damage to biological molecules, by x-ray or electron exposure, in the range from 100 fs to 1 ms. This represents a significant opportunity for future investigations with the new class of pulsed beam instruments proposed or under development.Reference Feist, Bach, Rubiano da Silva, Danz, Möller, Priebe, Domröse, Gatzmann, Rost, Schauss, Strauch, Bormann, Sivis, Schäfer and Ropers21 On the other hand, there is sufficient evidence for dose-rate effects in inorganic materials, where the current density can be higher and the material properties and mechanisms of damage may differ.
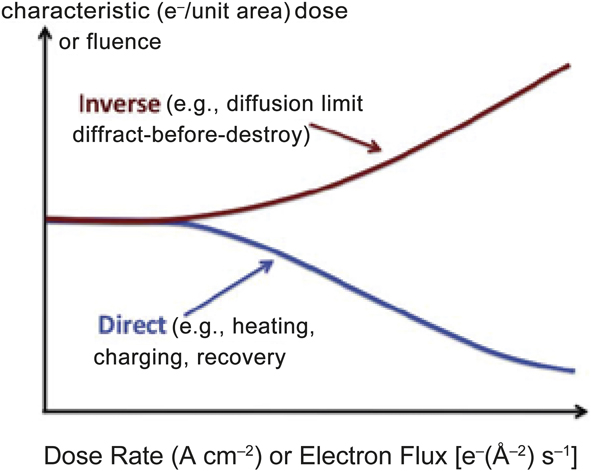
Dose-rate dependence is termed direct if the characteristic dose decreases with increasing dose rate (Figure 3). This situation can arise from the heating effect of the beam—high dose rate may cause an appreciable temperature rise that increases the radiolytic efficiency or even results in thermal damage. Another possible cause is electrostatic charging of the specimen, leading to image distortion, ion migration, ion emission (hole drilling), and even dielectric breakdown or mechanical rupture of the sample. These unwanted effects are minimized by reducing the electron flux, at the expense of a longer data-recording time. Radiation-recovery or healing effectsReference Jiang and Spence22 also lead to a direct dose-rate dependence and should benefit from a reduction in the electron flux, but no healing effects have been observed in biological radiation damage studies.
Direct dose-rate effect (characteristic dose increasing with increasing flux) compared with inverse dose rate (characteristic dose falling with increasing flux).

An inverse dose-rate effect means that the characteristic dose increases with dose rate (Figure 3), a situation that can arise from the time dependence of radiation damage. One example is the use of a free-electron laser to generate short x-ray pulses (as many as 1012 x-ray photons within 100 fs), allowing diffraction patterns from viruses or small crystals of macromolecules to be recorded before the atoms have had time to move.Reference Chapman, Fromme, Barty, White, Kirian, Aquila, Hunter, Schulz, DePonte, Weierstall, Doak, Maia, Martin, Schlichting, Lomb, Coppola, Shoeman, Epp, Hartmann, Rolles, Rudenko, Foucar, Kimmel, Weidenspointner, Holl, Liang, Barthelmess, Caleman, Boutet, Bogan, Krzywinski, Bostedt, Bajt, Gumprecht, Rudek, Erk, Schmidt, Hömke, Reich, Pietschner, Strüder, Hauser, Gorke, Ullrich, Herrmann, Schaller, Schopper, Soltau, Kühnel, Messerschmidt, Bozek, Hau-Riege, Frank, Hampton, Sierra, Starodub, Williams, Hajdu, Timneanu, Seibert, Andreasson, Rocker, Jönsson, Svenda, Stern, Nass, Andritschke, Schröter, Krasniqi, Bott, Schmidt, Wang, Grotjohann, Holton, Barends, Neutze, Marchesini, Fromme, Schorb, Rupp, Adolph, Gorkhover, Andersson, Hirsemann, Potdevin, Graafsma, Nilsson and Spence23 Unfortunately, Coulomb repulsion limits the electron flux, making it unlikely that we can outrun the entire damage process in the transmission electron microscope.Reference Egerton24,Reference Spence25 However, most of the radiolysis is created by secondary electrons (via photoelectrons, in the case of x-rays), and there are secondary stages of damage involving atomic motion over extended distances that occur more slowly, and may be accessible to a pulsed instrument in the nanosecond range. Radiation damage is also specific to the particular structure and composition of the molecules under interrogation—some bonds are less or more susceptible to breakage—this has been studied extensively in the context of macromolecular x-ray crystallography.Reference Gerstel, Deane and Garman26
Warkentin et al.Reference Warkentin, Hopkins, Badeau, Mulichak, Keefe and Thorne27 used 13 keV x-rays to irradiate protein (thaumatin) crystals at temperatures between 100 K and 300 K, monitoring the damage through the fading of diffraction spots. At 200 K, they observed an inverse dose-rate dependence, together with dark progression (further damage after irradiation was terminated) on a scale of minutes, which they attributed to the diffusive motion of radicals and groups of atoms. This radiation sensitivity had an activation energy of 0.19 eV (18 kJ/mol), making diffusive motion at 100 K negligible (reduced by a factor of 6 × 10⁴) for crystals a few hundred micrometers in size.
TEM specimens have a thickness of typically 50 nm, and if we take the diffusion distance as L = (C τ )1/2, where C is a diffusion coefficient at 100 K, the diffusion time, τ, is reduced by a factor ∼107 in such a thin sample, becoming just a few seconds for a cryo-TEM specimen. Regions under irradiation may also have enhanced diffusion due to diffuse reorganization of molecules in the thin film. Mass loss has been observed from polymer specimens at 100 K, with a dose-rate dependence that was inverse below 50 e–/Å/s, but direct at a higher dose rate, likely due to heating of the specimen.Reference Egerton and Rauf28 Karuppasamy et al.Reference Karuppasamy, Nejadasl, Vulovic, Kostera and Ravellia29 calculated beam heating to be significant above 50 e–/Å/s, which may account for devitrificationReference Dubochet, Adrian, Chang, Homo, Lepault, McDowall and Schultz2 of a vitreous specimen kept at an insufficiently low temperature in the microscope.
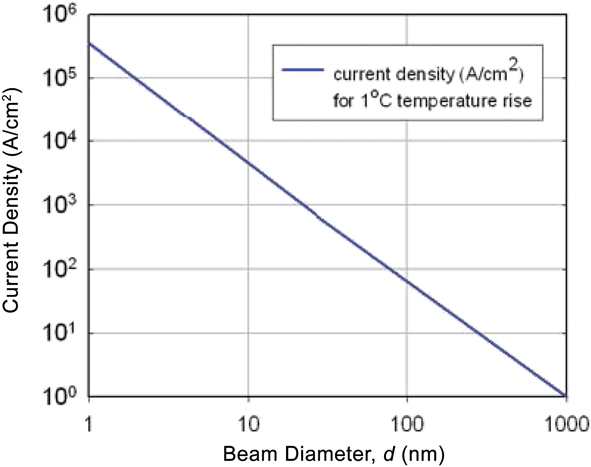
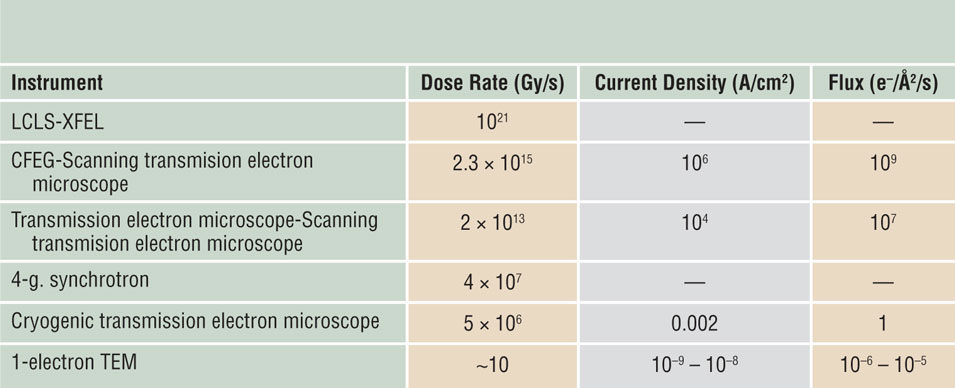
One way to achieve a high dose-rate without appreciable temperature rise is to reduce the diameter of the electron beam (Figure 4),Reference Egerton, Li and Malac30 as in STEM imaging. The STEM dose rate is higher than that achievable using normal synchrotron x-rays, although not as large as for x-rays from a free-electron laser (see Table II). There are indications that STEM could take advantage of an inverse dose-rate effect and cause less mass loss than TEM imaging, for the same total dose.Reference Egerton and Rauf28,Reference Egerton and Qian31
Current density that gives a temperature rise of 1 K (°C) in amorphous carbon, calculated assuming radial conduction from the electron probe to a heatsink a distance of 30 μm away.Reference Egerton, Li and Malac30 For a given probe current, the temperature rise scales logarithmically with 1/d whereas the current density scales as 1/d 2, where d is the probe diameter.

Typical dose rates in x-ray and electron-beam instruments, expressed in terms of energy deposition (gray units [Gy]) and, for the electron case, as a current density or electron flux.Reference Feist, Bach, Rubiano da Silva, Danz, Möller, Priebe, Domröse, Gatzmann, Rost, Schauss, Strauch, Bormann, Sivis, Schäfer and Ropers21
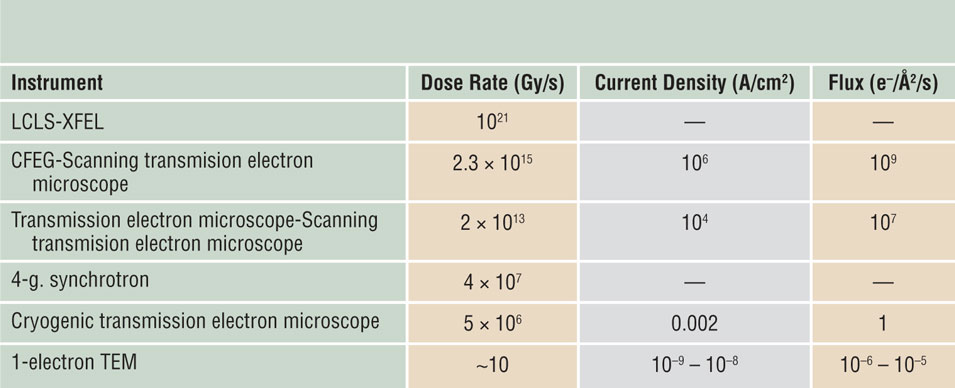
Note: XFEL, x-ray free electron laser; LCLS, Linac Coherent Light Source; CFEG, cold field-emission gun; 4-g, fourth generation; 1-electron TEM, transmission electron microscopy with pulsed single-electron packets.
Potential advantages and disadvantages of scanning transmission electron cryomicroscopy
It is not obvious what effect reduced mass loss might have on single-particle analysis, since at or below 100 K high-resolution, information is thought to be scarcely dependent on secondary damage.Reference Glaeser8,Reference Glaeser and Taylor32 However, this assessment is based largely on diffraction information, which is somewhat insensitive to specimen drift, whereas mass loss can result in specimen shrinkage, movement, and image blur. The spot-scan technique was developed for biological 2D crystals to mitigate these effects.Reference Bullough and Henderson33,Reference Downing34 Following the success of single-particle methods, similar scanned-beam techniques may have a newfound application in the imaging of radiation-sensitive polymers and organic materials. Examples include thin sheets of polypeptoids or crystals of small organic molecules,Reference Jiang, Xuan, Spencer, Zuckermann, Downing and Balsara35,Reference Johnstone, Allen, Danaie, Copley, Brum, Kirkland and Midgley36 in conjunction with other methods of image alignment, and averaging to reduce the effective dose to periodic or symmetric specimens. Low-dose electron crystallography has seen a recent resurgence in the form of microelectron diffraction (MicroED), (see the Nannenga and Gonen article in this issue),Reference Nannenga and Gonen37 which can be used to determine the structure of small molecules that are readily crystallizable, and whose radiation-sensitive three-dimensional crystals can be made small enough to avoid multiple-scattering effects.Reference Nannenga and Gonen37 Scanned or convergent beams may eventually play a role in this low-dose technique as well.
STEM techniques have recently been developed for extracting high-resolution phase information and are said to offer high dose efficiency.Reference Krumeich, Mueller and Wepf38–Reference Lazić, Bosch and Lazar40 To date, none have been shown to be more efficient than traditional bright-field phase contrast for low-dose imaging of a thin (<500 Å) specimen at high resolution. The related technique of electron ptychography, which uses an algorithm to recover the phases from an array of overlapping diffraction patterns, promises superior resolution for a particular probe size,Reference Ophus41 but requires reading out an entire diffraction pattern at each pixel, limiting the scanning speed and dose rate. The requirement for overlap between the individual pixels for phase recovery limits the dose efficiency of this method.
Besides phase contrast, STEM offers other imaging modes such as Z-contrast (high-angle annular dark field) and x-ray mapping. Wang et al.Reference Wang, Slater, Leteba, Roseman, Race, Young, Kirkland, Lang and Haigh42 used both of these techniques for structural analysis of Pt-Ni particles at a resolution of 1 nm. Ilett et al.Reference Ilett, Brydson, Brown and Hondow43 examined metal-oxide particles embedded in vitreous ice and reported that bubbling of the ice was conspicuous only for a scanning transmission electron microscope fluence above 1000 e–/Å2, compared to 100 e–/Å2 in fixed-beam TEM. However, bubble visibility is dependent on secondary effects such as diffusion and recombination, so this may not be a good metric for primary damage to the structure of the molecules themselves.
Structure on a larger-than-atomic scale may be affected directly by the mass-loss process.Reference Naganathanm and Munoz44,Reference Geremia, Campagnolo, Demitri and Johnson45 STEM resolution depends on the probe size and is unaffected by chromatic aberration arising from energy losses in the specimen. This makes STEM preferable for examining thicker specimens, as in electron tomography where damage is often a problem because of the large dose needed.Reference Leary and Midgley46 STEM offers the possibility of dynamic focusing (for a tilted specimen) and was found to cause less radiation-induced shrinkage than TEM for resin-embedded biological specimens examined at room temperature,Reference Aoyama, Takagi, Hirase and Miyazawa47 so it is now routinely used for this purpose.
Wolf et al.Reference Wolf, Houben and Elbaum13,Reference Wolf and Elbaum48 examined hydrated and vitrified specimens containing whole bacteria and human tissue cells, reporting improved contrast and resolution in STEM mode with a 1-nm-diameter probe. They observed reduced bubbling at a low dose rate, attributed to “healing” between scans, perhaps by the hydrogen diffusing away through the ice after it is produced by radiolysis. If a specimen has a mechanism for slow repair during periods without irradiation, the different time scales for repair and damage suggest using fast scanning to reduce mass loss (through an inverse dose-rate effect, Figure 3) but sufficient delay between scanned frames promote repair (a direct dose-rate effect) in the same specimen. Unfortunately, for biological specimens, no such repair mechanism has yet been found.
STEM will not yield improved data if the dose-rate dependency is direct rather than inverse. Beam heating can be significant for soft materials such as polymers, or if there is poor thermal contact with a heatsink (giving a temperature rise greater than in Figure 4). For highly insulating samples, electrostatic charging could be more troublesome in STEM. In the case of ionic specimens (e.g., inorganic oxides), the internal electric field generated by electron irradiation can cause ion drift or even ion emission and hole formation.Reference Jiang5,Reference Humphreys, Bullough, Devenish, Maher, Turner and Johari49 There is often a current-density threshold,Reference Jiang and Spence22 making STEM more damaging for such specimens.
It is worth mentioning that, even with a STEM probe with subnanometer diameter, radiolysis is delocalized over a diameter of a few nanometers, reflecting the range of secondary electrons and delocalized nature of inelastic scattering.Reference Egerton6 Recent work with high-resolution STEM-electron energy-loss spectroscopy has shown that vibrational spectra can be obtained from the collective excitation of many molecules in aloof mode (where the electron beam is sufficiently far away from the specimen to prevent damaging energy transfer) from crystals of alanine, an amino acid.Reference Krivanek, Dellby, Hachtel, Idrobo, Hotz, Plotkin-Swing, Bacon, Bleloch, Corbin, Hoffman, Meyer and Lovejoy50,Reference Hachtel, Huang, Popovs, Jansone-Popova, Keum, Jakowski, Lovejoy, Dellby, Krivanek and Idrobo51 Although potentially beneficial to point analysis of a beam-sensitive specimen, such delocalization becomes irrelevant when the beam is scanned over the specimen with a scan step, s, equal to the probe diameter, d. For s > d (undersampling, as in leapfrog scanningReference Egerton6) or s < d (oversampling, as in ptychography), the situation is more complicated and the dose per pixel and average dose per frame may differ, which is of concern for accurate dosimetry.Reference Naganathanm and Munoz44 In general, STEM involves more parameters, making the optimal imaging more complicated than for fixed-beam TEM.
A key benefit of direct detectors in electron cryomicroscopy has been the ability to collect low-dose movies of the specimen. These movies made it immediately clear that the molecules were moving a great deal even before they were destroyed by the beam,Reference Brilot, Chen, Cheng, Pan, Harrison, Potter, Carragher, Henderson and Grigorieff52 which was already recognized as a problem for 2D crystallography.Reference Glaeser, McMullan, Faruqi and Henderson18,Reference Henderson and Glaeser53 Much of this movement is related to the differential contraction of the specimen support foil and the grid, which can be eliminated by making them all out of the same material.Reference Russo and Passmore54 Specimen supports made entirely of gold (grid bar and foil) are now used routinely to eliminate this cause of specimen movement at the beginning of low-dose imaging of a cryo-specimen. Tracking and alignment algorithms can also be used to reduce the blurring effects of movement in the images,Reference Brilot, Chen, Cheng, Pan, Harrison, Potter, Carragher, Henderson and Grigorieff52,Reference Li, Mooney, Zheng, Booth, Braunfeld, Gubbens, Agard and Cheng55,Reference Bai, Fernandez, McMullan and Scheres56 provided there is sufficient signal in each frame of the movie to perform the alignment accurately. Such tracking algorithms are now incorporated in all the major software packages used for single-particle reconstruction.
Serial diffraction patterns such as those shown in Figure 1 are a quick and easy way of assessing whether or not a particular specimen is subject to radiation damage. Movement of the specimen during imaging can confound the results, since new parts of the crystal are continuously entering the irradiated region. A famous example of this was from studies of radiation damage at liquid-helium temperatures, where rapid drift of the holder brought new regions of crystal into the beam faster than it was destroyed, making the crystal seem more radiation hard than it actually was.Reference Dubochet and Knapek57 The illumination geometry (e.g., the tails of a Gaussian-shaped beam) can also lead to misinterpretation, as was shown recently for studies of x-ray damage to protein crystals.Reference Atakisi, Conger, Moreau and Thorne58 Finally, absent a strong theoretical and empirical understanding of the radiation sensitivity of the material under study, one must be aware that the specimen might be already damaged in the first frame or at the first time point of data collection—data that do not change with time or dose do not necessarily imply no damage. It could be possible that the specimen has reached a terminal state of degradation before the first image or spectra appears on the detector.
Conclusions
In electron cryomicroscopy, a wealth of knowledge and technology available for minimizing radiation damage and maximizing the information content in electron micrographs, diffraction patterns, and spectra now exist. Much of this technology was developed in the context of phase-contrast cryo-TEM of biological specimens, which are particularly sensitive to the electron beam, and is yet to be applied to radiation-sensitive specimens of interest to the materials science community. Scanning transmission electron cryomicroscopy is a nascent field, offering opportunities for imaging and spectroscopy that exploit various properties of electron-beam damage that have not been widely appreciated to date. Even so, questions in the study of radiation damage in the electron microscope still remain unanswered. Many researchers have reported on dose-rate effects for inorganic specimens, even at room temperature, but with little quantitative information about the time dependence and mechanisms involved. Once addressed, these and related questions could lead to further improvements in our ability to analyze materials that currently remain elusive due to the destructive aspect of energetic electrons.
Acknowledgments
We thank R. Henderson, P. Midgley, and M. Peet for comments on the manuscript. This work was supported by the Medical Research Council, UK (MC_UP_120117) and the Natural Sciences and Engineering Research Council of Canada.

Chris Russo is a group leader in the Structural Studies Division of the Medical Research Council Laboratory of Molecular Biology in Cambridge, UK. He received his BS degree in electrical engineering and philosophy from the University of Notre Dame, and his PhD degree in applied physics from Harvard University in 2010. His research focuses on the physical phenomena that limit electron imaging in biology. His awards include the Microscopy Society of America Burton Medal for 2017. Russo can be reached by email at crusso@mrc-lmb.cam.ac.uk.
Ray Egerton is currently at the University of Alberta, Canada. He obtained his BA degree at the University of Cambridge, UK, in 1965 and his PhD degree at Imperial College (London University), UK, in 1968. His research focuses on developing techniques for electron energy-loss spectroscopy and for minimizing radiation damage in transmission electron microscopy. He has received numerous awards, including the 2004 Distinguished Physical Scientist Award from the Microscopy Society of America. He is a Fellow of the Royal Society of Canada. Egerton can be reached by email at regerton@ualberta.ca.