Inflammatory bowel disease (IBD), encompassing Crohn’s disease (CD) and ulcerative colitis, is a multigenetic and environmentally triggered disease characterised by an inappropriate immune response to an altered gut microbiota(Reference Sartor1). Diet is one of the major determinants of the gut microenvironment and one of the more obvious factors linking the impact of industrialisation with the worldwide increased incidence of IBD(Reference Lewis and Abreu2). Numerous epidemiological studies and animal studies have demonstrated associations between specific dietary components of a Western diet and the risk of developing IBD, although more consistently with CD(Reference Ananthakrishnan, Khalili and Song3–Reference Ananthakrishnan, Khalili and Konijeti9). Importantly in paediatric IBD, dietary factors also play a key role in a child’s growth and development. Evidence-based dietary interventions, ranging from nutrition education to targeted diet therapies, may therefore have the potential to better control disease, optimise growth potential and avoid complications while limiting drug exposure and toxicity.
Dietary intake involves complex interactions between different foods and nutrients. A whole dietary pattern should therefore be considered when performing nutrition research to preserve the potential for synergism between nutrients. There is currently a paucity of data on the diet quality of children with CD(Reference D’Souza, Levy and Mack10–Reference Sila, Trivić and Pavić15) with most studies focusing on single food or individual micronutrients(Reference Hartman, Marderfeld and Davidson13–Reference Pituch-Zdanowska, Albrecht and Banasiuk16). Moreover, dietary intake in children with CD may vary according to disease activity, as symptoms, appetite changes or treatment-related factors can influence food choices and overall diet quality. The translation of these types of study into dietary guidance in clinical practice has been difficult, as exemplified by the contradicting results surrounding the n-3 fatty acids(Reference Ananthakrishnan, Khalili and Konijeti9,Reference Belluzzi, Brignola and Campieri17,Reference Feagan, Sandborn and Mittmann18) and consumption of red meat(Reference Hou, Abraham and El-Serag8,Reference Albenberg, Brensinger and Wu19) . Moreover, studies of single nutrient or food group supplementation or restriction have shown inconsistent results suggesting that the overall pattern of the diet may be more important(Reference Lewis and Abreu2). Dietary indices assessing the quality of the whole dietary pattern may allow more precise diet management and become useful tools in preventing and managing IBD in the future. Therefore, we investigated the associations of dietary quality and inflammatory potential with paediatric CD.
To assess diet quality and dietary inflammatory potential in children with CD, we conducted a cross-sectional study comparing children with CD to healthy controls and evaluated how these measures vary according to clinical disease activity and disease-related factors. We evaluated diet quality using two indices – the Healthy Eating Index (HEI)-2015 and the alternate Mediterranean diet score (aMed) – and assessed dietary inflammatory potential using the modified Children-Dietary Inflammatory Index (mC-DII).
Materials/Subjects and methods
Study design and population
This cross-sectional study included participants enrolled from two observational cohort studies under a defined set of eligibility criteria: the Pediatric Longitudinal Study of Elemental Diet and Stool Microbiome Composition (PLEASE)(Reference Lee, Baldassano and Otley20) and DYsbiosis, iNflammatory bowel disease and Antibiotics in the MICrobiome paediatric IBD study that has been described previously(Reference Lemons, Conrad and Tanes21,Reference Bushman, Conrad and Ren22) . Children under the age of 22 years with active CD who were initiating therapy with either enteral nutrition therapy or anti-tumour necrosis factor-α therapy were enrolled in the PLEASE study. Outpatients under the age of 22 years with IBD receiving care at CHOP and healthy controls from the institution’s general paediatric clinic were enrolled in the DYsbiosis, iNflammatory bowel disease and Antibiotics in the MICrobiome study. Both original study protocols used the same methodology regarding participant clinical assessments, calprotectin measurement and dietary intake assessment therefore allowing the combination of the two datasets under the current study analysis. All dietary and disease activity measurements were collected concurrently at baseline for all participants, maintaining a cross-sectional design.
Included in the present study were 122 children with active CD (PLEASE; n 83 and DYsbiosis, iNflammatory bowel disease and Antibiotics in the MICrobiome; n 39), twenty-two children with quiescent CD defined as clinical remission for at least 3 months (PLEASE study only) and fifty-seven healthy controls (PLEASE study only); all participants were aged 6–18 years and had complete dietary data at baseline. Participants with both clinically active and quiescent CD were included in order to capture the full range of paediatric CD presentations and to explore whether dietary quality and inflammatory potential differed by disease activity status. Healthy controls included children enrolled from the primary care network at CHOP and without IBD, gastrointestinal symptoms or disorders, active infection or any prior chronic diagnosis. Controls were not formally matched to participants with CD, but age and sex distributions were assessed for comparability. Participants were excluded if they had an ostomy (two quiescent CD), were on a therapeutic diet such as exclusive or partial enteral nutrition or the specific carbohydrate diet (two active CD, four quiescent CD) or had incomplete dietary intake data (three active CD, four quiescent CD, three healthy controls) or anthropometric data (three active CD, two quiescent CD). In total, twenty-three participants were excluded from the current study analysis. This study was conducted according to the guidelines laid down in the Declaration of Helsinki, and all procedures involving participants were approved by the Institutional Review Board at CHOP, Philadelphia, PA, Approval Number 11817. Written informed consent was obtained from all participants.
Disease activity
Disease activity was evaluated using the paediatric Crohn’s disease activity index(Reference Turner, Griffiths and Walters23) or when unavailable/incomplete, short paediatric Crohn’s disease activity index(Reference Turner, Griffiths and Walters24,Reference Kappelman, Crandall and Colletti25) and faecal calprotectin (FCP) concentration (Genova Diagnostics, Asheville, NC). Active CD was defined based on a previously validated paediatric Crohn’s disease activity index cut-off of ≥ 10 or short paediatric Crohn’s disease activity index cut-off of ≥ 15 and FCP > 250 µg/g, a cut-off previously shown to correlate with endoscopically defined inflammation, was considered to have active disease(Reference Dulai, Peyrin-Biroulet and Danese26).
Growth and anthropometrics
Anthropometrics for all participants were measured within two weeks of disease activity and dietary intake assessment. The nutritional status of participants was determined using the 2000 Center for Disease Control reference growth charts(Reference Kuczmarski, Ogden and Grummer-Strawn27–Reference Barlow29) and using the SAS Program for the 2000 Center for Disease Control Growth Charts. Malnutrition was defined by a BMI-for-age Z-score (BMIz) ≤ −1·0, with mild, moderate and severe malnutrition corresponding to a BMIz between −1·0 – −1·99, −2·0 – −2·99 and ≤ −3·0, respectively(Reference Becker, Carney and Corkins30). Overweight was defined as BMIz ≥ 1·0, and obesity was defined as BMIz ≥ 2·0(Reference Becker, Carney and Corkins30).
Since accurate heights at younger ages were commonly unavailable for assessment of height velocity upon diagnosis or for healthy controls, growth failure or stunting was defined as height-for-age < 5th percentile (Height Z-score < −1·64) for all participants(Reference Kuczmarski, Ogden and Guo28).
Dietary intake
Dietary intake was estimated using three 24-hour dietary recalls, conducted by a research bionutritionist through telephone, two on weekdays and one on a weekend day, and obtained from participants with assistance from parents as needed. Intake of calories, macronutrients, vitamins and food groups was assessed using the Nutrition Data System for Research (NDSR, University of Minnesota, Minneapolis, MN, USA) and adjusted for total energy intake. Estimated energy requirement (EER) for each child was calculated using dietary reference intakes (DRI) values from the Institute of Medicine based on age, sex, height and weight. DRI values were based on recommended dietary allowances and adequate intakes, where no recommended dietary allowances have been established. Since data about physical activity had not been collected, it was presumed that most of the participants had a ‘light’ physical activity level(Reference Trumbo, Schlicker and Yates31). This did not include potential additional energy requirements related to CD or energy for catch-up growth. Total average daily caloric intake was divided by EER to obtain energy intake as percent intake of EER (%EER).
Dietary indices
Healthy Eating Index
The HEI is a dietary index developed by the USA Department of Agriculture (USDA) to assess adherence to the Dietary Guidelines for Americans(32,Reference Krebs-Smith, Pannucci and Subar33) . The HEI is scored from 0 to 100; the higher an individual’s score, the healthier their diet is. The HEI-2015 was computed using a SAS code(34) developed by the University of Minnesota Nutrition Coordinating Center.
Alternate Mediterranean diet
The aMed contains nine components, and one point is assigned for consumption above (vegetables excluding potatoes, fruits, whole grains, nuts, legumes, fish, ratio of monounsaturated to saturated fat) or below (red and processed meat, alcohol) the reference population-specific median(Reference Fung, McCullough and Newby35). The healthy control cohort was used as the reference population in the current comparative analysis. Component serving counts were adjusted per 1000 kcal prior to median computation and point value assignments to level out systemic differences in intake by age. A higher score represents a closer resemblance to the Mediterranean diet.
Dietary Inflammatory Index
The DII enables categorisation of individuals’ diets according to their inflammatory potential based on a summation of the intake of 45 pro-or anti-inflammatory nutrients(Reference Shivappa, Steck and Hurley36). A DII score above zero represents a pro-inflammatory diet and a DII score below zero represents an anti-inflammatory diet. The original DII was derived from a global standard database including only adult dietary intakes, and not all the parameters that comprise the DII (e.g. alcohol) are appropriate to include or consistently available when evaluating children’s dietary intake. In our study, data on 26 of the 45 nutrients were available for the DII score. This subset corresponds to the validated, literature-derived Children’s Dietary Inflammatory Index (C-DII)(Reference Khan, Wirth and Ortaglia37), which was specifically designed to accommodate the limited range of foods and nutrients typically consumed by children. The available nutrients included the following:
Carbohydrate, protein, total fat, alcohol, fibre, cholesterol, saturated fat, monounsaturated fat, polyunsaturated fat, trans fat, n-3, n-6 fatty acid, niacin, thiamin, riboflavin, vitamin B12, vitamin B6, iron, magnesium, zinc, vitamin A, vitamin C, vitamin D, vitamin E, folic acid and beta-carotene. Missing dietary factors included foods less commonly consumed by children such as spices (ginger, saffron, turmeric, pepper, oregano, rosemary); phenols/flavonoids (eugenol, flavan-3-ol, flavones, flavonols, flavonones, anthocyanidins, isoflavones); caffeine; black/green tea; onions and garlic. We further modified the C-DII to form the modified C-DII (mC-DII) in two substantial ways. First, our sample of healthy children was located in the same geographic region and thus exposed to a similar food environment as the children with CD reported on here. Both followed the same dietary and clinical metadata collection protocols. Therefore, to increase internal validity and ensure that the inflammatory potential score reflected this specific paediatric food environment, we standardised nutrient intakes using the mean and sd of the local healthy control population rather than the global reference database. Second, we included trans fats while the original C-DII did not have that variable available but are relevant in this study population. To calculate the overall mC-DII for each individual, we used the same technique as the one previously used in the original DII(Reference Shivappa, Steck and Hurley36). Intake totals were adjusted per 1000 kcal to level out systematic differences in total intake by age. We also developed tertiles of the mC-DII for comparison with the HEI-2015 variables.
Statistical analysis
Differences in baseline disease characteristics between patients with clinically active CD and quiescent CD were analysed using Fisher’s exact tests for categorical variables and t tests, or Wilcoxon signed rank tests, for normally and non-normally distributed continuous variables, respectively. Differences in demographics and anthropometric measurements and dietary intake measures between the three groups were analysed using one-way ANOVA for normally distributed variables or the Kruskal–Wallis test with the Dwass, Steel, Critchlow–Flinger test and then applied to assess post-hoc pairwise comparisons. ANOVA was used to evaluate the distribution of the individual components of the HEI across tertiles of DII, separately among children with CD and the healthy population.
Regression models were developed within the CD cohort to describe the associations of demographic and clinical parameters with dietary quality scores. Since children with CD often experience unique challenges (disease activity, malnutrition, corticosteroid exposure) that can directly impact diet, we aimed to evaluate how these factors influenced dietary indices (HEI-2015, aMed, mC-DII) and fibre intake. The following independent variables were included: clinical disease activity (quiescent v. active), years since diagnosis, age, gender, presence of malnutrition (BMIz ≤ −1), FCP and systemic corticosteroid exposure. In individual multivariable regression models, fibre intake, aMed, DII and HEI total scores were assessed as dependent variables. Statistical analyses were conducted using SAS 9.4, and P-value < 0·05 was considered significant.
Results
Baseline characteristics
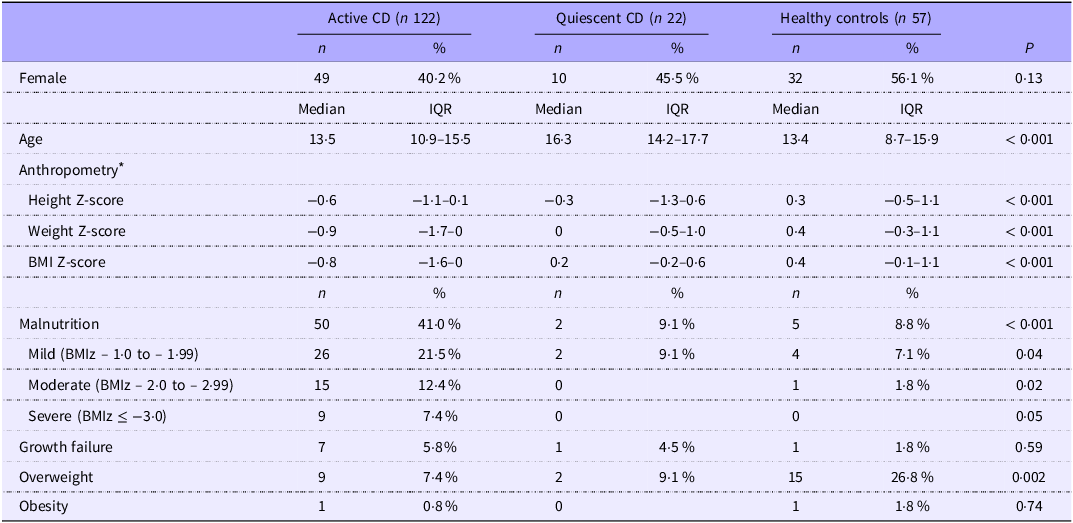
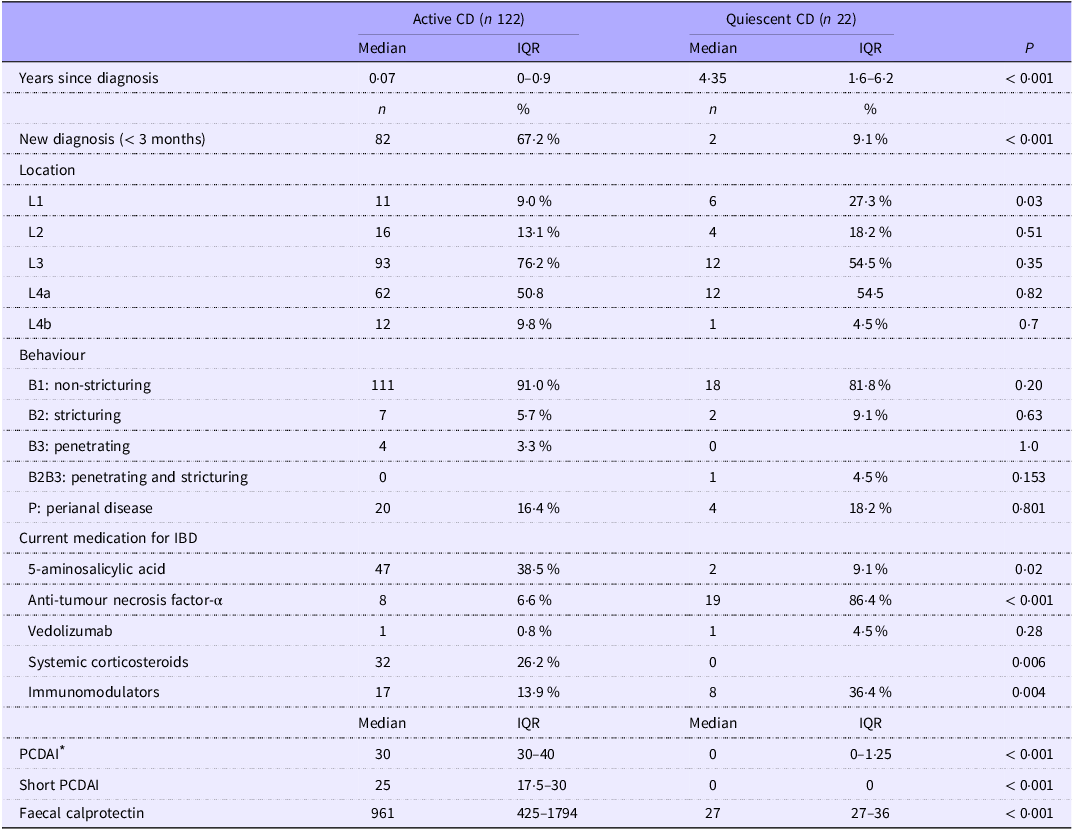
In total, 144 patients with CD were included, 122 (84·7 %) with clinically active disease (median age: 13·5, IQR (10·9–15·5) years) and 22 (15·3 %) with quiescent disease (median age: 16·3, IQR (14·2–17·7) years). The healthy control sample was comprised of 57 children (median age: 13·4, IQR (8·7–15·9) years) (Table 1A). Children with quiescent CD were significantly older (P < 0·001) and had a longer disease duration than children with active CD, of whom 82 (67·2 %) were newly diagnosed (median: 4·35, IQR (1·6–6·2) v. 0·07, IQR (0–0·9) years, P < 0·001). The clinical characteristics of our CD cohort, including disease location, behaviour, medications and paediatric Crohn’s disease activity index scores, contextualise these dietary patterns in relation to nutritional risk and potential symptom burden and are presented in Table 1B.
Participant baseline characteristics †

Table 1A Long description
A table comparing baseline characteristics of participants with active CD, quiescent CD, and healthy controls. The table has 12 rows and 7 columns. Column headers are: Active CD (n 122), Quiescent CD (n 22), Healthy controls (n 57), and P. Row labels include Female, Age, Height Z-score, Weight Z-score, BMI Z-score, Malnutrition, Mild (BMIz 1.0 to 1.99), Moderate (BMIz 2.0 to 2.99), Severe (BMIz ≤ -3.0), Growth failure, Overweight, and Obesity. Each row provides data for the three groups and a P value. Notable trends include higher percentages of females in the healthy controls group, older median age in the quiescent CD group, and significant differences in anthropometry and malnutrition status across the groups.
BMIz, BMI Z-score; CD, Crohn’s disease; IQR, interquartile range.
Values are n (%) or median (interquartile range).
Continuous variables are presented as mean (sd) or median (IQR) and were compared using t tests or Mann–Whitney U tests as appropriate. Categorical variables were compared using χ 2 tests or Fisher’s exact tests when expected cell counts were < 5.
* Two participants had missing anthropometrics (one in the active CD group and one in the healthy control group). Statistics provided for 121 children in the active CD group and fifty-six children in the healthy control group.
† ANOVA was used to test the difference across the three groups.
Disease characteristics

Table 1B Long description
A table comparing disease characteristics between active and quiescent Crohn's disease patients. The table has 22 rows and 10 columns. Column headers are: Years since diagnosis, New diagnosis (< 3 months), Location, Behaviour, Current medication for IBD, PCDAI, Short PCDAI, Faecal calprotectin. Row labels are: Median, IQR, Median, IQR, P. The table compares data for Active CD (n 122) and Quiescent CD (n 22). Key data points include: Years since diagnosis: Active CD Median 0.07, IQR 0-0.9; Quiescent CD Median 4.35, IQR 1.6-6.2. New diagnosis (< 3 months): Active CD 82 (67.2 percent), Quiescent CD 2 (9.1 percent). Location: L1 Active CD 11 (9 percent), Quiescent CD 6 (27.3 percent); L2 Active CD 16 (13.1 percent), Quiescent CD 4 (18.2 percent); L3 Active CD 93 (76.2 percent), Quiescent CD 12 (54.5 percent); L4a Active CD 62 (50.8 percent), Quiescent CD 12 (54.5 percent); L4b Active CD 12 (9.8 percent), Quiescent CD 1 (4.5 percent). Behaviour: B1 Active CD 111 (91 percent), Quiescent CD 18 (81.8 percent); B2 Active CD 7 (5.7 percent), Quiescent CD 2 (9.1 percent); B3 Active CD 4 (3.3 percent), Quiescent CD 0; B2B3 Active CD 0, Quiescent CD 1 (4.5 percent); P Active CD 20 (16.4 percent), Quiescent CD 4 (18.2 percent). Current medication for IBD: 5-aminosalicylic acid Active CD 47 (38.5 percent), Quiescent CD 2 (9.1 percent); Anti-tumour necrosis factor-alpha Active CD 8 (6.6 percent), Quiescent CD 19 (86.4 percent); Vedolizumab Active CD 1 (0.8 percent), Quiescent CD 1 (4.5 percent); Systemic corticosteroids Active CD 32 (26.2 percent), Quiescent CD 0; Immunomodulators Active CD 17 (13.9 percent), Quiescent CD 8 (36.4 percent). PCDAI: Active CD Median 30, IQR 30-40; Quiescent CD Median 0, IQR 0-1.25. Short PCDAI: Active CD Median 25, IQR 17.5-30; Quiescent CD Median 0, IQR 0. Faecal calprotectin: Active CD Median 961, IQR 425-1794; Quiescent CD Median 27, IQR 27-36.
CD, Crohn’s disease; IQR, interquartile range; IBD, inflammatory bowel disease; PCDAI, paediatric Crohn’s disease activity index.
Values are n (%) or median (interquartile range).
Continuous variables are presented as mean (sd) or median (IQR) and were compared using t tests or Mann–Whitney U tests as appropriate. Categorical variables were compared using χ 2 tests or Fisher’s exact tests when expected cell counts were < 5.
ANOVA was used to test the difference across the three groups.
L1, distal 1/3 ileum ± limited cecal disease; L2, colonic; L3, ileocolonic; L4a, upper disease proximal to ligament of Treitz; L4b, upper disease distal to ligament of Treitz and proximal to distal 1/3 ileum.
* PCDAI was incomplete for twenty-seven of the 144 (18·75 %) children with CD included in the current study. Statistics were provided for 105 children in the active CD group and twelve children in the quiescent CD group.
Anthropometrics and nutritional status
Anthropometric measurements and nutritional status based on BMIz of all participants are shown in Table 2. While median Height Z-score did not differ according to disease activity status, children with active CD had a significantly lower median Height Z-score than healthy controls (median: −0·6, IQR (–1·1–0·1) v. 0·3, IQR (–0·5–1·1), P < 0·001). Growth failure rates did not differ significantly across the three groups. Patients with active CD had significantly lower BMIz values than children with quiescent CD and healthy controls (median: −0·8, IQR (–1·6–0) v. 0·2, IQR (–0·2–0·6) v. 0·4, IQR (–0·1–1·1), respectively, P < 0·001). This was in turn reflected in the higher proportion of malnutrition, as defined by BMIz ≤ −1·0, in children with active CD (50 (41 %) v. 2 (9·1 %) v. 5 (8·8 %), P < 0·001).
Comparison of the Healthy Eating Index-2015 across children with Crohn’s disease and healthy controls

Table 2 Long description
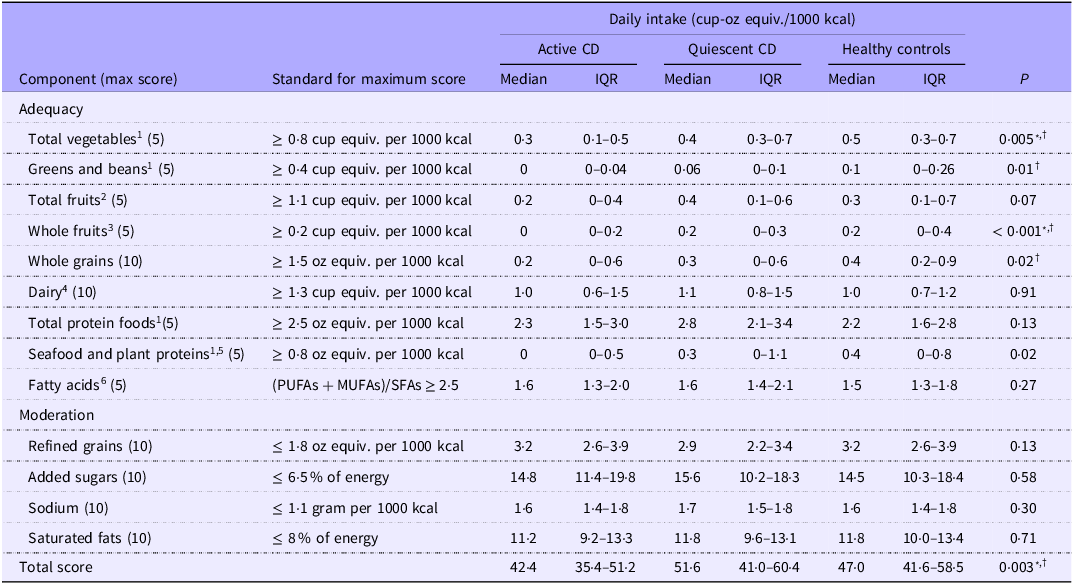
A table comparing daily intake of various food components among children with Crohn's disease (CD) and healthy controls. The table has 18 rows and 10 columns. Column headers are Component (max score), Standard for maximum score, Active CD Median, Active CD IQR, Quiescent CD Median, Quiescent CD IQR, Healthy controls Median, Healthy controls IQR, and P. Row labels include Total vegetables, Greens and beans, Total fruits, Whole fruits, Whole grains, Dairy, Total protein foods, Seafood and plant proteins, Fatty acids, Refined grains, Added sugars, Sodium, Saturated fats, and Total score. Each row provides median and interquartile range (IQR) values for daily intake per 1000 kcal for active CD, quiescent CD, and healthy controls, along with P-values indicating statistical significance.
CD, Crohn’s disease; IQR, interquartile range.
Values are median (interquartile range).
ANOVA was used to test the difference across the three groups.
1Includes legumes (beans and peas); 2Includes 100 % fruit juice; 3includes all forms except juice; 4includes all milk products, such as fluid milk, yogurt, cheese and fortified soy beverages; 5includes seafood, nuts, seeds, soy products (other than beverages) and legumes (beans and peas); 6ratio of PUFA and MUFA to SFA.
* Indicates significant difference between Active and Quiescent CD (P < 0·05).
† Indicates significant difference between Healthy and Active CD (P < 0·05).
Energy and dietary intake
The median overall energy intake (%EER) did not differ significantly across the three groups, namely children with active or quiescent CD and healthy controls (median: 72·4, IQR (67·6–91·7) v. 87·4, IQR (68·3–109·4) v. 83·5, IQR (67·0–98·7), P = 0·19) (online Supplementary material 1, Additional File 1). Sensitivity analysis performed on energy intake while adjusting for age did not show any significant difference between the three groups (data not shown).
Intake of all macronutrients in reference to DRI values was similar between both patients with active and quiescent CD and the healthy sample, with the exception of fibre intake (online Supplementary material 1, Additional File 1). Specifically, total fibre intake relative to the %DRI was lower in participants with active CD than in both those with quiescent CD and healthy controls (median: 37·0, IQR (22·6–48·3) v. 41·2, IQR (34·1–49·1) v. 45·8, IQR (35·7–62·0), P < 0·001).
Micronutrient intake in reference to DRI values was similar between participants in all three groups (online Supplementary material 1, Additional File 1).
Dietary indices
Healthy Eating Index-2015
Children with active CD had lower total HEI scores (%) than those with quiescent disease and the healthy cohort, respectively (median: 42·4, IQR (35·4–51·2) v. 51·6, IQR (41·0–60·4) v. 47·0, IQR (41·6–58·5), P = 0·03) (Table 2, Figure 1). Children with active CD had significantly lower intake of vegetables and whole fruits than children with quiescent CD and healthy controls (P = 0·005 and P < 0·001, respectively). Additionally, children with active CD had lower intake of greens and beans, seafood and plant proteins, and whole grains when compared with healthy controls (P = 0·01, P = 0·02 and P = 0·02, respectively). Figure 1 illustrates the individual components of the HEI-2015 graphed as percentages across the three groups on a radar plot.
Radar plot: comparison of the Healthy Eating Index-2015 scores across children with Crohn’s disease and healthy controls. Radar plot visualisation of average Healthy Eating Index-2015 component scores contributing to the total score in children with active CD, quiescent CD and healthy controls. Component scores are graphed as percentages (e.g. a total fruit score of 4 out of 5 is graphed as 80 %). CD, Crohn’s disease. †Indicates significant difference between Active and Quiescent CD (P < 0·05). *Indicates significant difference between Healthy and Active CD (P < 0·05).

Alternate Mediterranean dietary index
Both children with CD and healthy controls showed low adherence to a traditional Mediterranean diet as shown by the low total aMed score (online Supplementary material 2, Additional File 2), with no difference according to clinical disease activity status. Compared with healthy children, participants with active disease had a significantly lower total scores (median: 2·0, IQR (1·0–3·0) v. 3·0, IQR (2·0–4·0), P = 0·04). This difference was driven by a significantly lower score for intake of vegetables, nuts and cereals.
Dietary Inflammatory Index
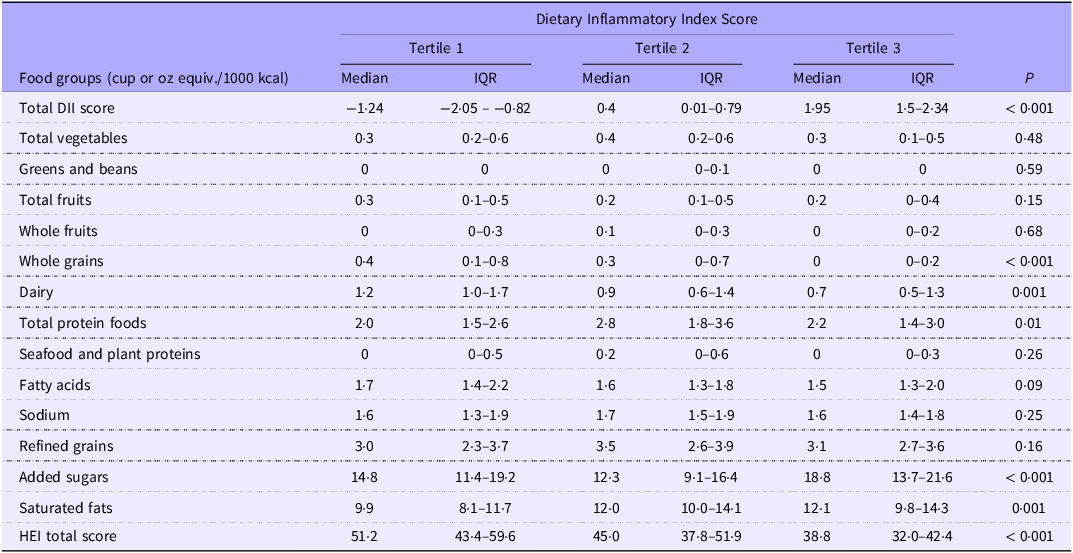
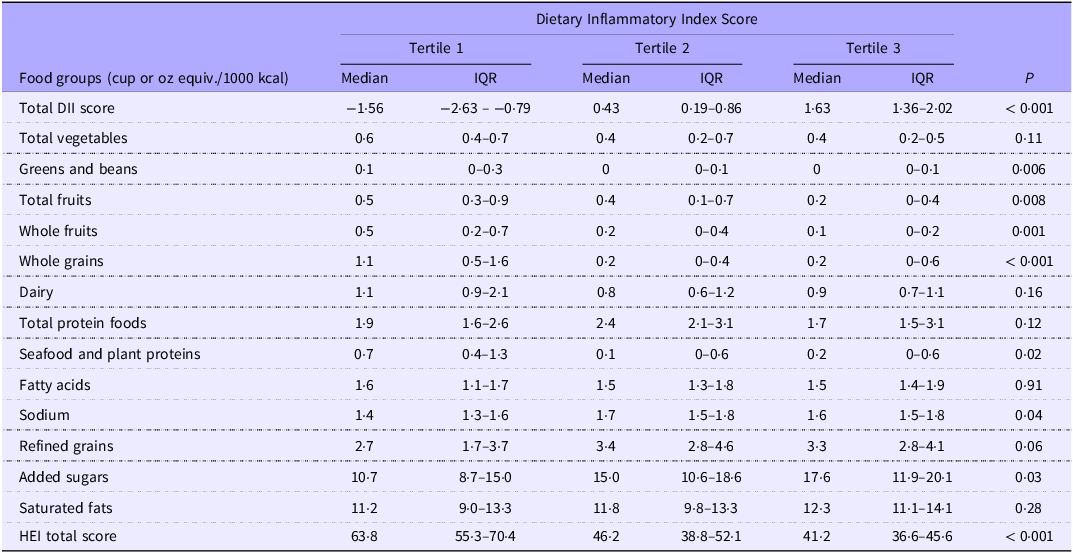
The total mC-DII score did not differ between children with active or quiescent disease nor did it differ from the healthy sample (median: 0·40, IQR (–0·87–1·51) v. 0·40, IQR (–0·32–1·48) v. 0·43 IQR (–0·79–1·36), P = 0·89) and was overall found to be pro-inflammatory (online Supplementary material 3, Additional File 3). To determine which food groups were most strongly associated with a pro-inflammatory mC-DII score, the HEI-2015 food group intake levels were distributed across tertiles of mC-DII, comparing children with CD (Table 3A) and healthy children (Table 3B) separately. Children with CD in the most pro-inflammatory tertile had greater consumption of added sugars, saturated fats and proteins and lower intake of whole grains and dairy foods (Table 3A). Similarly, healthy children in the most pro-inflammatory tertile had higher consumption of added sugars and lower intake of whole grains, but also had greater consumption of sodium and lower intake of greens and beans, total fruits, whole fruits, seafood and plant proteins (Table 3B). A lower HEI-2015 score was found to be significantly associated with a more pro-inflammatory mC-DII score in both groups (P < 0·001).
Distribution of consumption of food groups across tertiles of modified Children-Dietary Inflammatory Index in children with Crohn’s disease (n 144)

Table 3A Long description
A table comparing dietary inflammatory index scores across food groups in children with Crohn's disease. The table has 15 rows and 10 columns. The columns are labeled as follows: Food groups, Tertile 1 Median, Tertile 1 IQR, Tertile 2 Median, Tertile 2 IQR, Tertile 3 Median, Tertile 3 IQR, and P. The rows list different food groups and their respective dietary inflammatory index scores across three tertiles. Notable trends include higher consumption of added sugars, saturated fats, and proteins in the most pro-inflammatory tertile and lower intake of whole grains and dairy foods. The P values indicate the statistical significance of the differences observed.
IQR, interquartile range; DII, Dietary Inflammatory Index; HEI, Healthy Eating Index.
Values are median (interquartile range).
ANOVA was used to test the difference across the three groups.
Distribution of consumption of food groups across tertiles of modified Children-Dietary Inflammatory Index in healthy controls (n 57)

Table 3B Long description
A table comparing dietary inflammatory index scores across different food groups. The table has 15 rows and 11 columns. The columns are labeled as follows: Food groups, Tertile 1 Median, Tertile 1 IQR, Tertile 2 Median, Tertile 2 IQR, Tertile 3 Median, Tertile 3 IQR, and P. The rows list various food groups and their corresponding values across the tertiles. Row 1: Total DII score, -1.56, -2.63 to -0.79, 0.43, 0.19 to 0.86, 1.63, 1.36 to 2.02, < 0.001. Row 2: Total vegetables, 0.6, 0.4 to 0.7, 0.4, 0.2 to 0.7, 0.4, 0.2 to 0.5, 0.11. Row 3: Greens and beans, 0.1, 0.0 to 0.3, 0, 0.0 to 0.1, 0, 0.0 to 0.1, 0.006. Row 4: Total fruits, 0.5, 0.3 to 0.9, 0.4, 0.1 to 0.7, 0.2, 0.0 to 0.4, 0.008. Row 5: Whole fruits, 0.5, 0.2 to 0.7, 0.2, 0.0 to 0.4, 0.1, 0.0 to 0.2, 0.001. Row 6: Whole grains, 1.1, 0.5 to 1.6, 0.2, 0.0 to 0.4, 0.2, 0.0 to 0.6, < 0.001. Row 7: Dairy, 1.1, 0.9 to 2.1, 0.8, 0.6 to 1.2, 0.9, 0.7 to 1.1, 0.16. Row 8: Total protein foods, 1.9, 1.6 to 2.6, 2.4, 2.1 to 3.1, 1.7, 1.5 to 3.1, 0.12. Row 9: Seafood and plant proteins, 0.7, 0.4 to 1.3, 0.1, 0.0 to 0.6, 0.2, 0.0 to 0.6, 0.02. Row 10: Fatty acids, 1.6, 1.1 to 1.7, 1.5, 1.3 to 1.8, 1.5, 1.4 to 1.9, 0.91. Row 11: Sodium, 1.4, 1.3 to 1.6, 1.7, 1.5 to 1.8, 1.6, 1.5 to 1.8, 0.04. Row 12: Refined grains, 2.7, 1.7 to 3.7, 3.4, 2.8 to 4.6, 3.3, 2.8 to 4.1, 0.06. Row 13: Added sugars, 10.7, 8.7 to 15.0, 15.0, 10.6 to 18.6, 17.6, 11.9 to 20.1, 0.03. Row 14: Saturated fats, 11.2, 9.0 to 13.3, 11.8, 9.8 to 13.3, 12.3, 11.1 to 14.1, 0.28. Row 15: HEI total score, 63.8, 55.3 to 70.4, 46.2, 38.8 to 52.1, 41.2, 36.6 to 45.6, < 0.001.
IQR, interquartile range; DII, Dietary Inflammatory Index; HEI, Healthy Eating Index.
Values are median (interquartile range).
ANOVA was used to test the difference across the three groups.
Associations of fibre intake and diet quality with disease-related variables in children with Crohn’s disease
To explore predictors of dietary quality and inflammatory potential within the CD population, we examined associations between dietary indices/fibre intake and clinical or demographic characteristics. To determine which clinical variables were most strongly associated with the dietary indices and fibre intake, the following independent variables were considered: clinical disease activity (quiescent v. active), years since diagnosis, age, gender, malnutrition (BMIz ≤ −1), FCP and systemic corticosteroid use. Clinically active disease (P = 0·04) and corticosteroid use (P = 0·02) were both associated with a lower HEI total score. A negative trend was observed in the association between corticosteroid use and the aMed score (P = 0·07). A positive trend was observed between malnutrition and a more pro-inflammatory mC-DII score (P = 0·07). Finally, a higher FCP value was associated with lower fibre intake (P = 0·009).
Discussion
In our study, we demonstrate that children with CD, particularly those with clinically active disease, have significantly lower diet quality scores (HEI-2015 and aMed) and lower fibre intake compared with both quiescent CD and healthy controls. While suboptimal diet quality is well documented in the general paediatric population from large national surveys, our findings provide novel evidence that poor dietary patterns are further accentuated in children with active CD and that these patterns are linked to higher dietary inflammatory potential. While some observed differences in intake were modest, they highlight a population-level concern that may be exacerbated in children with active disease, supporting the need for targeted nutritional guidance. These results advance the field by highlighting disease-specific vulnerabilities in dietary intake that may contribute to disease course and represent potential targets for tailored nutritional strategies in paediatric CD care
The few controlled studies that have assessed dietary intake in paediatric IBD have reported inconsistent results, largely due to the heterogeneity of the study population and methodology(Reference Hartman, Marderfeld and Davidson13–Reference Pituch-Zdanowska, Albrecht and Banasiuk16). Notably, some of these studies(Reference Diederen, Krom and Koole14,Reference Sila, Trivić and Pavić15) estimated dietary intake using FFQ, while we obtained three 24-hour recalls prompted by a research bionutritionist, a method recognised to be more accurate and less prone to recall bias(Reference Burrows, Ho and Rollo38). Moreover, our sample of healthy children was located in the same geographic region and therefore exposed to a similar food environment as the children with CD in this study. Thus, our study provides strong evidence supporting inadequate dietary fibre intake and poor diet quality in children with CD, particularly in those with clinically active disease.
Here, we provide new evidence that children with CD have a suboptimal eating pattern, deviating from the recommended healthy eating pattern by the Dietary Guidelines for Americans, and the traditional Mediterranean diet. The latter has also been described in European countries, including Mediterranean regions, and in regional USA cohorts of children, where children have been shown to have a low adherence to a Mediterranean-like diet(Reference Tognon, Moreno and Mouratidou39,Reference Grosso and Galvano40) . In our study, in patients with active CD in comparison with healthy children, both dietary scores (HEI-2015 and aMed) identified significantly lower vegetable, fruit and cereal intakes, all considered high dietary fibre sources. It should be noted that all three cohort populations showed a low fibre intake. This is an important finding given the current literature showing an association between industrialisation-induced dietary changes, particularly low fibre intake, and development of CD and progression(Reference Levine, Sigall Boneh and Wine41,Reference Ng, Shi and Hamidi42) . Dietary fibres have been linked to maintenance of the gut epithelial barrier, modification of the intestinal immune response, and alteration of microbial composition, all of which are critical factors in the pathogenesis of IBD(Reference Levine, Sigall Boneh and Wine41,Reference Vangay, Johnson and Ward43,Reference Sonnenburg, Smits and Tikhonov44) . We also provide novel data regarding the inflammatory potential of dietary patterns in children with CD, using the literature-derived DII for the first time in a paediatric IBD cohort. The association between disease activity and DII has been previously demonstrated in two previous uncontrolled studies in adults with conflicting results(Reference Lamers, de Roos and Witteman45,Reference Mirmiran, Moslehi and Morshedzadeh46) . Here, the diets in both children with CD and healthy children were pro-inflammatory and negatively associated with the HEI-2015 score. While our study did not show an association between the dietary inflammatory potential and disease activity, our results showed a positive trend between malnutrition and a higher pro-inflammatory DII score in children with CD. Whether diet-related inflammation affects nutritional status in paediatric IBD deserves further investigation.
We acknowledge several limitations of the current study. First, this was a cross-sectional study and the direction of associations, such as the negative association found between fibre intake and FCP, cannot be established and should be tested in an interventional study. We acknowledge that causal relationship between disease activity and dietary intake and quality cannot be drawn from these results. Second, dietary beliefs and food avoidance behaviours, commonly reported in patients with IBD(Reference Hou, Lee and Lewis47–Reference Zallot, Quilliot and Chevaux49), were not assessed in the current study. High fibre foods, including vegetables and fruits, are often avoided specially during active disease as they are perceived as having a negative effect on IBD(Reference Tognon, Moreno and Mouratidou39,Reference Grosso and Galvano40) , despite current dietary guidelines recommending moderate to high fibre intake in CD in the absence of symptomatic or significant stricturing disease(Reference Levine, Rhodes and Lindsay50). Previous studies have shown that up to 60–70 % of children with CD report intentional food avoidance soon after diagnosis, with many maintaining restrictive patterns months to years later(Reference Hartman, Marderfeld and Davidson13,Reference Palamenghi, Figliuc and Leone51,Reference Scarallo and Lionetti52) . Therefore, it is not clear whether our results reflect adjustments made following physician and dietitian instructions or patient and family preferences and beliefs or fear of experiencing symptoms. Third, this study is limited by the small sample size of patients with clinically quiescent disease, which could have limited our ability to determine significant associations between diet quality and disease activity. Fourth, not all of the original 45 literature-derived DII components were queried in our study. However, the majority of the missing components are typically consumed in very low amounts in the USA, especially in children, making the risk of misclassification unlikely. Importantly, our list composed of 26 parameters corresponded to the previously validated population-based C-DII(Reference Khan, Wirth and Ortaglia37). We used the mean and sd of intake levels of the healthy control population used in this study, a comparative population located in the same geographic region and thus exposed to a similar food environment as the CD population reported on here. Additionally, while the aMed index has previously been validated in adults and widely used in research, it has not been validated in children. We chose the aMed index for its applicability and reliability when used in non-Mediterranean populations as supported by previous studies(Reference Zaragoza-Marti, Cabanero-Martinez and Hurtado-Sanchez53). Last, our study participants were mostly Caucasians, and therefore, the current study was unable to capture ethnicity-specific dietary associations. Extrapolating our findings to individuals of other cultural backgrounds should therefore be performed with caution.
The strengths of this study stem from the assessment of diet quality and dietary inflammatory potential using, for the first time in a paediatric IBD population, the three following dietary indices: HEI-2015, aMed and mC-DII. Numerous epidemiological studies have demonstrated associations between specific dietary components and the risk of developing IBD or promoting relapse in those with established disease(Reference Lewis and Abreu2,Reference Hou, Abraham and El-Serag8,Reference Levine, Sigall Boneh and Wine41) . However, the evidence is still inconsistent. Dietary habits are multidimensional, and individual components of an eating pattern can have interactive, synergistic, and potentially cumulative relationships. Hence, the relation between a whole dietary pattern, rather than that of a single food or nutrient, and IBD should be examined for findings to capture the complexities of diet and the potential for synergism between dietary components. This complexity can be simplified by using dietary indices that quantify dietary variance in a single measure. As such, index-based dietary patterns may be more predictive of overall health status and disease risk than individual foods or nutrients, allowing more precise dietary recommendations in disease prevention and management.
Conclusions
In conclusion, our findings show that children with CD, particularly those with active disease, show lower adherence to recommended healthy eating patterns, including low intake of fibre, fruits, vegetables and whole grains. These patterns are associated with a high dietary inflammatory potential and a trend toward poorer nutritional status. While poor diet quality has been observed in paediatric populations broadly, our study is the first to apply multiple validated dietary indices to a paediatric CD cohort, thereby providing disease-specific insight into nutritional risk. This study provides essential baseline knowledge to guide future research on diet–microbiota interactions and supports the development of targeted, evidence-based dietary strategies for paediatric CD management.
Supplementary material
For supplementary material/s referred to in this article, please visit https://doi.org/10.1017/S0007114526107004
Acknowledgments
The authors thank Jennifer Vales, resource coordinator for the Center for Pediatric IBD at Children’s Hospital of Philadelphia who reviewed the final manuscript, and Debra Cahn, RD, LDN at the University of Pennsylvania for assistance with the dietary intake information.
The research leading to these results received funding from the Tobacco Formula grant under the Commonwealth Universal Research Enhancement (C.U.R.E) program (grant number SAP 4100068710). J. B. received the Crohn’s and Colitis Foundation Career Development Award (grant number 693 867).
No writing assistance was provided, and all views expressed in this manuscript are those of the authors. J. B., M. C., K. K., R. B., L. A. and C. W. C. designed and conducted research; J. B., M. C., R. Q., R. B., L. A. and C. W. C. analysed data; J. B., M. C., L. A. and C. W. C. wrote the paper; J. B., L. A. and C. W. C. had primary responsibility for final content. All authors read and approved the final manuscript.
There are no conflicts of interest.
Data described in the manuscript, code book and analytic code will be made available upon request pending approval by the corresponding author.