Maternal obesity induced by high-fat diets in rodent models leads to weight gain, adiposity, leptin and insulin resistance(Reference Monks, Orlicky and Stefanski1,Reference Ribaroff, Wastnedge and Drake2) . This increases the risk of metabolic(Reference Bautista, Montaño and Ramirez3,Reference Buison, Lu and Guo4) , cardiovascular disease(Reference Payen, Guillot and Paillat5) and mortality in the offspring(Reference Salvestrini, Sell and Lorenzini6,Reference Schoonejans and Ozanne7) . In our model of an obesogenic diet during pregnancy and lactation in rats, changes to milk composition occur, including an increase in leptin and fat content(Reference Bautista, Montaño and Ramirez3), this has a detrimental effect on offspring during the early stages of development. It leads to an increase in adipose tissue and possible delays in brain development in a sex-specific manner(Reference Bautista, Montaño and Ramirez3,Reference Rasmussen, Thompson and Gyllenhammer8) , resulting in premature ageing(Reference Rodríguez-González, Reyes-Castro and Bautista9). In addition, other studies in rodent models of maternal obesity(Reference Taylor, Samuelsson and Poston10) and human studies demonstrate(Reference Zielinska-Pukos, Kopiasz and Hamulka11,Reference Marousez, Hanssens and Butruille12) a strong relationship between milk leptin concentrations, increased BMI and altered appetite regulation in offspring. However, the use of Western diet in rats during gestation and lactation has been shown to result in lower protein content and insulin, leptin and adiponectin levels in milk throughout or at the end of lactation compared with mothers who were fed a control diet(Reference Pomar, Castillo and Palou13). Several strategies have been developed to reverse or prevent adverse offspring programming effects caused by maternal obesity, including physical activity in human(Reference Linder, Eder and Monod14–Reference Padmanabhan, Cardoso and Puttabyatappa16) and in rodents(Reference Zhang, Jia and Wei17–Reference Ros, Argente and Chowen19). Antioxidants are used strategically to improve the metabolic environment in obese individuals and animal models(Reference Springer and Moco20,Reference Gong, Guo and Zou21) . Resveratrol (Res), a polyphenol found in grapes and red wine, has anti-inflammatory, anti-ageing and antioxidant properties that have been proven to benefit the cardiovascular system, metabolic diseases and obesity(Reference Ricapa, Grueso and González22). Oral supplementation of Res in humans(Reference Ricapa, Grueso and González22–Reference Wang, Moustaid-Moussa and Chen24) and rodents(Reference Gong, Guo and Zou21,Reference Tsai, Tsai and Huang25,Reference Rodríguez-González, Vargas-Hernández and Reyes-Castro26) reduces the production of reactive oxygen species, restores lipid metabolism and reduces insulin resistance. In addition, Res supplementation during gestation in women prevents the adverse effects of maternal hypoxia(Reference Segovia, Vickers and Gray27), gestational diabetes and susceptibility to develop diabetes type 2(Reference Langley-Evans28). Maternal obesity and Res supplementation before and during pregnancy in rat have been shown to have a positive effect on adipocyte size distribution, TAG and insulin resistance(Reference Rodríguez-González, Vargas-Hernández and Reyes-Castro26), accompanied by low liver fat accumulation and progressive effects on genes related to insulin resistance, oxidative stress and inflammatory processes in the fetus, preventing negative effects in a sex-dependent manner(Reference Rodríguez-González, Vargas-Hernández and Reyes-Castro26). Both young and old offspring of obese rat dams treated with Res show improved lipid metabolism and reduced fat deposits associated with improved intestinal morphology(Reference Castro-Rodríguez, Reyes-Castro and Vargas-Hernández29). Moreover, Res supplementation in a rat model of undernutrition during pregnancy reduce negative effects on placenta function, reduced maternal levels of reactive oxygen species and partially restored antioxidant liver enzyme activities and maternal metabolic parameters. In the fetus, maternal Res supplementation improved corticosterone levels and partially ameliorated increases in body and liver weight(Reference Vega, Reyes-Castro and Rodríguez-González30). These studies suggest that supplementing dams with Res during pregnancy, in the presence of negative nutritional conditions, not only has positive effects on the dam but also prevents or ameliorates various negative programming effects in fetal and neonatal life, particularly those related to metabolism, oxidative stress(Reference Rodríguez-González, Vargas-Hernández and Reyes-Castro26,Reference Castro-Rodríguez, Reyes-Castro and Vargas-Hernández29) and adipose tissue function(Reference Tsai, Tsai and Huang31). The present study will focus on the potential benefits of Res supplementation in obese pregnancy on mammary gland proliferation, differentiation and milk production. The present study hypothesises that Res supplementation in the obese dams will improve maternal metabolism that will last throughout the lactation period positively impacting milk production and quality through changes in mammary gland development, with benefits for metabolism in juvenile offspring.
Materials and methods
Care and maintenance of animals
All procedures were approved by the Animal Experimentation Ethics Committee of the Instituto Nacional de Ciencias Médicas y Nutrición ‘Salvador Zubirán’ (INCMNSZ), Mexico City, Mexico (BRE-1868-16/19-1) and are consistent with the ARRIVE guidelines for reporting studies involving animals(Reference Grundy32,Reference Kilkenny, Browne and Cuthill33) . Twenty-two female albino Wistar rats were maintained from birth in the INCMNSZ animal facility, which is accredited by and adheres to the standards of the Association for Assessment and Accreditation of Laboratory Animal Care International (AAALAC). Rats were maintained at 22–23 °C under controlled lighting (lights on 07:00 to 19:00 h) and fed a control diet (C) of Lab Rodent Purina Diet 5001 (Standard laboratory non purified diet; Fort Worth, TX, USA) (Table 1)(Reference Bautista, Reyes-Castro and Bautista34). At age 14–16 weeks, when they weighed 200–240 g, females were bred to randomly assigned, non-litter mate, proven male breeders. Dams included in the study were chosen from litters that were standardised to ten pups (with at least four females), ensuring consistency across dams.
Maternal diet composition

Table 1 Long description
A table comparing the composition of control and obesogenic diets for rodents. The table has 9 rows and 3 columns. The columns are labeled Components (percent), Control diet (percent), and Obesogenic diet (percent). The rows list the components and their respective percentages in each diet. Row 1: Protein, 23.9, 23.5. Row 2: Polysaccharide, 31.9, 21. Row 3: Simple sugars, 27.5, 21. Row 4: Fibre, 5.3, 5.0. Row 5: Minerals, 6.9, 5.0. Row 6: Vitamins, 0.5, 1.0. Row 7: Fat, 4.5 (oil), 25 (20 lard + 5 oil). Row 8: Energy (Kcal/g), 4.0, 4.8.
Litters with less than ten or more than fourteen pups were excluded. At weaning (postnatal day, PND 21), one female F0 pup from each litter was randomly assigned to either the maternal control (C) group fed a Lab Rodent Purina Diet 5001 or to the maternal obesity group (MO) fed a high-fat diet (Table 1)(Reference Bautista, Montano and Ramirez35). The high-energy obesogenic diet was produced in the specialised dietary facility of the INCMNSZ. Only one female from each litter was used in each experimental group to avoid ‘within litter’ effects of shared genetic background. The same mothers and offspring were used throughout the experiment.
Resveratrol suplementation
At PND 90, 1 month before mating and throughout pregnancy, half of the F0 females from each group (C and MO) were maintained on their assigned diet and were also administered 20 mg/kg/day Res (Harmony Flavors and Ingredients S.A de C.V México). Daily Res treatment was administered orally by individual pipette to generate two additional groups, CRes and MORes(Reference Rodríguez-González, Vargas-Hernández and Reyes-Castro26). The F0 female rats were placed with proven male breeders on day 120 and conceived during the next estrous cycle(Reference Rodríguez-González, Vargas-Hernández and Reyes-Castro26). Lactating dams were maintained on their pregnancy diet (C; n 5, MO; n 5, CRes, n 6 and MORes; n 6). At PND 2, the number of pups in each litter was adjusted to 10, with a male:female ratio of 5:5 wherever possible. Litters with less than ten or more than fourteen pups were excluded. At weaning, litters from each mother were divided into different cages by same sex siblings (n 2 or 3/male or female per cage) and fed with a control diet (Lab Rodent Purina Diet 5001) until PND 36 when offspring blood and adipose tissue was collected. Offspring groups conserved the same nomenclature as dams C, CRes, MO and MORes. We study the offsprings at PND 36 to avoid the influence of the maternal milk and diet on the offspring metabolic parameters (Figure 1).
Experimental design. Consumption of two experimental diets and resveratrol (Res) supplementation. Female rats were fed a control diet (C = Lab Rodent Diet 5001, Fort Worth, TX, USA) or an obesogenic diet (MO = maternal obesity 20 % lard + 5 % vegetable oil) during growth (21–120 day of life) and pregnancy and lactation. At PND 90, females were divided into four groups for Res intervention (Do = 20 mg/kg.day) and identified as C, CRes, MO and MORes (n 5–6). After weaning pups were fed with a C diet until PND 36 and identified with the same maternal group.

Maternal and pups’ body weight measurements
At 21 days of lactation (dL), maternal body weights were recorded and at PND 36 male and female offspring body weights were recorded (n 5–6 dams and offspring from different litters).
Maternal and pups blood collection
At 21 dL dams were fasted for 6 h. Offspring (one male and female from different litters) were fasted for 4 h at PND 36. The animals were then anesthetised with isoflurane and rapidly decapitated by personnel experienced in using a rodent guillotine (Thermo Scientific). Trunk blood was collected into polyethylene tubes, allowed to clot at 4°C for 1 h and centrifuged at 3500 rpm for 15 min at 4°C. The serum of both the dams and offspring was stored at –20°C for quantification of metabolic parameters and hormone levels (Figure 1).
Maternal serum metabolic parameters
Serum glucose concentrations were determined spectrophotometrically by the enzymatic hexokinase method (Beckman Coulter Co. Fullerton) for dams at 21 dL and for offspring at PND 36. Serum TAG and total cholesterol concentrations were determined enzymatically using the Synchron CX auto analyzer (Beckman Coulter Co.). All samples were assayed in duplicate(Reference Rodríguez-González, Vargas-Hernández and Reyes-Castro26).
Maternal serum hormonal parameters by enzyme-linked immunosorbent assay
Serum insulin and leptin concentrations were determined using ELISA kits from Millipore (Burlington) (cat. no. EZRMI-13K) and Invitrogen Thermo Fisher Scientific (cat. no. KRC-2281) for dams at 21 dL and offspring at PND 36. All samples were assayed in duplicate. Insulin resistance index was calculated with the baseline values from the formula Homeostatic Model Assessment for Insulin Resistance (HOMA-IR = Glucose × Insulin/22·5).
Maternal and pups adipose tissue weight
Maternal visceral fat depots located inside the thorax (mediastinal) and abdomen (omental, perirenal, retroperitoneal, periovarian, perivesical and parametrial) were excised and weighed. The total fat of the offspring was calculated based on the subcutaneous area only(Reference Zambrano, Rodríguez-González and Reyes-Castro36).
Maternal mammary gland collection and histology analysis
At 21 dL, the maternal mammary gland (MG) tissue was excised and weighed. The MG beneath the sixth right nipples (counted from the cephalad end) was longitudinally sectioned into two equal parts. One part was immediately frozen at −20°C, while the other was immersion fixed in 10 % formaldehyde in neutral phosphate-buffered saline for morphometric analysis.
After 24 h, the tissue samples were washed with PBS phosphate-buffered saline three times for 6 h and then dehydrated using a series of ethanol concentrations starting at 75 % and increasing to 95 %. Finally, the tissue samples were immersed in a 50–50 % mixture of xylol-ethanol and xylol and embedded in paraffin. 5 µm sections were cut from three different tissue samples and stained with haematoxylin and eosin for morphometric analysis.
Morphometric analysis
Mammary gland cell differentiation
Morphometric analysis was performed on ten images from three to five sections of each MG. At least 150 lobules were quantified at a 20× magnification using a Leica ICC50 HD microscope. The areas of adipose and parenchymal tissue (expressed as a percentage of acinar and ductal epithelium) were determined using AxioVisio LE real software version 4·8 (Zeiss® copyright 2006–2010 Stuttgart-Germany). Cytoplasm area (μm2) and nuclei size (μm2) were measured for fifty acini per animal at a magnification of 100× using AxioVision® software. Each acinus contained around 7–15 cells. Two independent observers performed all histological measurements blinded to the tissue source, and the results were averaged for each animal.
Immunohistochemistry of IL-6 in mammary glands
Mammary gland paraffin sections (5 µm) were deparaffinised in xylene and then rehydrated using descending concentrations of ethanol. Antigen retrieval was performed by treating the sections with 0·01 M citrate buffer for 30 min. After that, tissue slides were treated with mouse/rabbit polydetector plus (Bio-SB, Bioscience of the world) according to the manufacturer’s instructions and then incubated overnight at 4°C with the primary antibody, mouse monoclonal anti-IL6 (sc-57315; Santa Cruz Biotechnology) 1:100. Immunostaining was visualised and photographed using an Leica 1000 light microscope 40× magnification and analysed with ImageJ software from five fields for each rat(Reference Shu, Qiu and Ilyas37).
Apoptosis measurement in mammary gland
The terminal deoxynucleotidyl transferase dUTP nick-end labeling (TUNEL) assay was performed to determine apoptosis in the MG at 21dL. Tissue sections were deparaffinised, permeabilised and exposed to a TUNEL reaction containing terminal deoxynucleotidyl transferase and nucleotides (including 2′-deoxyuridine labelled with fluorescein isothiocyanate 5′-triphosphate). DNA breakage in the nucleus was identified by positive staining using a fluorescence microscope (Leica Q 500W). The number of apoptotic cells was counted in ten different fields at a 20× magnification. The results are represented as the percentage of the positively stained cells of the total number of cells/field. The apoptotic cells were identified using a Click-iT® TUNEL Alexa Fluor® 488 Imaging Assay kit (Thermo Fisher) according to the manufacturer’s protocol.
Proliferation measurement in mammary gland
Paraffin sections, 5 µm thick, from five rats in each group were deparaffinised and rehydrated. They were then fixed in 10 % formaldehyde and permeabilised with 0·1 % triton. Slides were blocked with 1 % Bovine serum albumin (BSA) for 2 h. After washing with PBS, the sections were incubated overnight at 4°C with a mouse monoclonal Proliferating Cell Nuclear Antigen anti-(PCNA) antibody (1:500) (Santa Cruz Technology sc-25280). After washing, tissues were incubated with a secondary conjugated antibody, Alexa Fluor 594 Donkey Anti-Mouse 1:500 (Invitrogen), at room temperature. Images were counterstained with DAPI (4′,6-diamidino-2-phenylindole), and proliferating cells were identified by positive staining of the nucleus using a fluorescence microscope (Leica Q 500W) and confirmed by DAPI (4′,6-diamidino-2-phenylindole staining). The number of PCNA-positive nuclei was counted in 6–10 fields for each rat at 40× magnification. The results are presented as the percentage of PCNA-positive cells per field(Reference Kim, Ramírez and Barrera-Chimal38).
Maternal milk production and offspring nutrient milk intake
Milk production was estimated at 20 dL, at 7:00 am offspring were separated from their dams for 4 h, during which time the dams had free access to water and food to produce milk, while the offspring did not eat(Reference Bautista, Bautista and Montaño39). The weight of both dams and offspring was recorded at the beginning (time 1) and end of the 4 h period (time 2). After 4 h, the offspring were returned with their dams and both were weighed again 1 h later (time 3). The difference in weight between the dam and the offspring was determined as indirect method of dam’s milk production and the offspring milk intake(Reference Bautista, Bautista and Montaño39). Offspring milk component intakes (water, protein, fat, arachidonic acid (AA), EPA and DHA) were estimated by milk intake (g/h) × milk component (%)/ 100(Reference Zambrano, Rodríguez-González and Reyes-Castro36).
Measurement of milk composition
Milk composition was measured as previously described. Briefly, on day 21 of lactation, the pups were separated from their mother, who had free access to water and food. Four hours later, 0·8 U of oxytocin was administered intraperitoneally to the mother, and the rats were milked 15 min later. The milk samples were subjected to homogenisation using a vortex, following which they were assayed in duplicate for each dam. Milk water was studied by gravimetric analysis. The protein concentration was determined by the Bradford assay (Bio-Rad) with a limit of detection of 0·5 ng/mL. Finally, the total fat in the maternal milk was determined by a modified Folch technique, as described(Reference Zambrano, Rodríguez-González and Reyes-Castro36). Saturated and mono-saturated acids and AA, EPA and DHA content from milk fat were measured by GC(Reference Zambrano, Rodríguez-González and Reyes-Castro36).
Statistical analysis
Maternal body and tissue weight, morphometric analysis, milk composition, apoptotic cell number, cell proliferation and biochemical data are presented as mean ± sem. (n 5–6 per group) P values <0·05 indicated significant differences(Reference Rodríguez-González, Vargas-Hernández and Reyes-Castro26,Reference Dell, Holleran and Ramakrishnan40) . The normality of the data was confirmed by Shapiro–Wilk test. For offspring tissues, one animal per group and sex from each litter were analised. To assess the statistical differences within the maternal diet and Res supplementation, data were analysed using two-way multiple ANOVA, followed by the Tukey test(Reference Rodríguez-González, Vargas-Hernández and Reyes-Castro26). The body weight, total fat, glucose, TAG, cholesterol, insulin, HOMA-IR and leptin of male and female MO rats at PND 36 were analysed using a t-test. The meaningful endpoints provided by the MO group differed between male and female offspring; therefore, the differences were indicated by #.
Values are mean ± sem, n 5–6 (C: Control; CRes: Control+Res; MO: Maternal Obesity; MORes: Maternal Obesity+Res). *P < 0·05 Diet effect (C and MO) or (CRes and MORes); P < 0·05 Res supplementation effect, is represented as different letters between C and CRes or MO and MORes. I: interaction between maternal diet and Res supplementation.
Results
Body weight and total fat from dams at 21 dL
Maternal body weight was similar between the C and MO groups, as well as the CRes and MORes groups. However, Res supplementation reduced body weight in the MORes group compared with the MO group (Figure 2a). There was an interaction between maternal diet and Res supplementation (P < 0·01). Maternal total fat was higher in the MO group compared with the C group, and in the MORes group compared with the CRes group, increasing by 4- to 6-fold. However; Res supplementation in the MORes group decreased total fat by around 2-fold compared with the MO group, with no changes observed in the animals with the control diet (C v. CRes) (Figure 2b); there was an interaction between maternal diet and Res supplementation (P < 0·02).
(a) Maternal body weight (g) and (b) total fat content (g), (c) MG weight (g), (d) MG weight relative to body weight, (e) percentage of parenchymal area (%) in MG, (f) percentage of fat area (%) in MG, (g) MG micrograph at 20×- (blue arrows point to parenchymal and red adipose tissue). Female rats were fed a control diet (C = Lab Rodent Diet 5001, Fort Worth, TX, USA) or an obesogenic diet (MO = maternal obesity 20 % lard + 5 % vegetal oil) during growth (21–120 day of life) and pregnancy and lactation. At PND 90, females were divided into four groups for Res intervention (Do = 20 mg/kg.day) and identified as C, CRes, MO and MORes (n. 5–6). (h) Male and (j) female pups body weight and (i) male and (k) female total fat content (g) at PND 36. After weaning (PND 21), pups were fed with a control diet until PND 36 and identified with the same maternal group. Data are mean ± sem, two-way ANOVA, *P < 0.05 for diet effect between C and MO or CRes and MORes; P < 0.05 for effect of Res, different letters between C and Cres or MO and MORes. # P < 0.05 v. male; I: interaction between maternal diet and Res supplementation; n.s. not significant.

Figure 2 Long description
Panel A: A vertical bar graph shows maternal body weight in grams for four groups: C, CRes, MO, and MORes. The y-axis represents body weight in grams, and the x-axis lists the groups. Panel B: Another vertical bar graph displays total fat content in grams for the same groups. The y-axis represents total fat content in grams, and the x-axis lists the groups. Panel C: A vertical bar graph illustrates MG weight in grams for the four groups. The y-axis represents MG weight in grams, and the x-axis lists the groups. Panel D: A vertical bar graph shows MG weight relative to body weight as a percentage for the four groups. The y-axis represents the percentage, and the x-axis lists the groups. Panel E: A vertical bar graph depicts the percentage of parenchymal area in the MG for the four groups. The y-axis represents the percentage, and the x-axis lists the groups. Panel F: A vertical bar graph shows the percentage of fat area in the MG for the four groups. The y-axis represents the percentage, and the x-axis lists the groups. Panel G: Micrographs at 20X magnification show the mammary gland tissue for the four groups, with blue arrows pointing to parenchymal tissue and red arrows pointing to adipose tissue. Panel H: A vertical bar graph displays body weight in grams for male offspring at PND 36 for the four groups. The y-axis represents body weight in grams, and the x-axis lists the groups. Panel I: A vertical bar graph shows total fat content in grams for male offspring at PND 36 for the four groups. The y-axis represents total fat content in grams, and the x-axis lists the groups. Panel J: A vertical bar graph displays body weight in grams for female offspring at PND 36 for the four groups. The y-axis represents body weight in grams, and the x-axis lists the groups. Panel K: A vertical bar graph shows total fat content in grams for female offspring at PND 36 for the four groups. The y-axis represents total fat content in grams, and the x-axis lists the groups.
Maternal serum metabolic and hormonal parameters at 21 dL
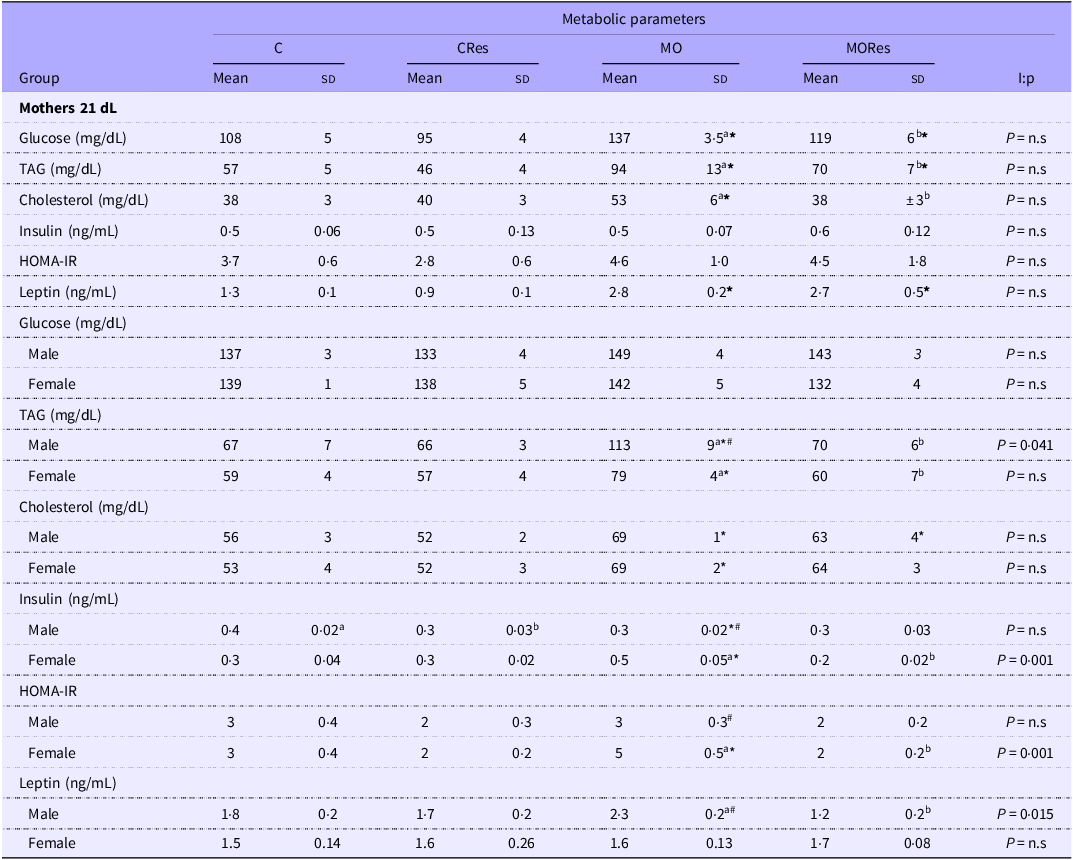
Glucose, TAG and cholesterol concentrations were higher in the MO group compared with the C; the Res supplementation in MO feed rats reduced glucose, TAG and cholesterol concentration levels compared with MO, without changes among C v. CRes (Table 2). Maternal fasting insulin concentrations did not differ with diets or Res supplementation. Leptin concentrations were elevated in the MO groups, with no apparent effect of Res supplementation (Table 2).
Maternal serum metabolic parameters at 21 dL and offspring metabolic parameters at PND 36.
Female rats were fed a control diet (C = Lab Rodent Diet 5001, Fort Worth, TX, USA) or with an obesogenic diet (MO= maternal obesity 20 % lard + 5 % vegetal oil) during growth (21–120 day of life) and pregnancy and lactation. At PND 90 females were divided in four groups for Res intervention (Do = 20 mg/kg.day) and identified as C, CRes, MO and MORes (n=5-6). After weaning pups were fed with a C diet until PND 36 and identified with the same maternal group. * p < 0.05 for Diet Effect between C and MO or CRes and MORes; abTreatment Effect for the effect of Res, different letters between C and Cres or MO and MORes indicates p < 0.05. I:p = interaction between maternal diet and Res supplementation. #p < 0.05 v. male; n.s. not significant

Table 2 Long description
The table presents metabolic parameters for mothers and offspring across four groups: C, CRes, MO, and MORes. It includes measurements for glucose, TAG, cholesterol, insulin, HOMA-IR, and leptin levels. The table has 16 rows and 12 columns, with column headers indicating the groups and their mean and standard deviation values. Row labels categorize the data by mothers and offspring, further divided by gender where applicable. Notable trends include higher glucose, TAG, and cholesterol concentrations in the MO group compared to the C group, and the effect of Res supplementation in reducing these levels in the MORes group. Insulin levels did not differ significantly with diets or Res supplementation, while leptin concentrations were elevated in the MO groups.
Maternal mammary gland parameters at 21 dL
MG weight and weight relative to body weight were higher in MO groups compared with C and CRes; however, there was no apparent effect of Res (Figure 2c and d). Histological analysis of the MG showed that the parenchymal area was significantly lower in the MO group compared with the C group and in the MORes group compared with the CRes group. Res supplementation increased the percentage of parenchymal area in the CRes compared with the C group and in the MORes compared with the MO group (Figure 2e). There was an interaction between maternal diet and Res supplementation (P = 0·03). In contrast, the percentage of the fat area was reduced in both CRes v. C and MORes v. MO in MG (Figure 2f). The micrograph showed less parenchymal area with a higher percentage of adipose cells in the MG from MO compared with C and MO to MORes animals (Figure 2g).
Maternal mammary gland morphometric and IL-6 immunohistochemical analyses at 21 dL
The morphometric analysis indicates that the cytoplasmic area in the MG was lower in MO animals compared with the C group, but was restored by Res supplementation. The nuclei size was also lower in the MO group compared with the C group and was partially restored by Res supplementation. Interestingly, there was a small but significant reduction in nuclei size with Res supplementation in the control animals (Figure 3a–c); both cytoplasm (P < 0·001) and nuclei size (P < 0·001) showed interaction between maternal diet and Res supplementation. The MO group had a higher IL-6 immunostained area in the MG compared with the C group (P < 0·001), with no significant effect of Res treatment. However, the MORes group had a higher immunostained area in the MG compared with the CRes group (P < 0·001-Figure 3d) and there is an interaction between the maternal diet and Res supplementation. The micrograph showed more area staining in MO and MORes compared with C and CRes (Figure 3e).
Maternal mammary gland (MG) morphology at 21 dL. (a) Cytoplasm area (µm2), (b) Nuclei size (µm2), (c) MG micrograph 100×, staining with hematoxylin and eosin; (d) MG % staining area IL-6, (e) MG micrograph with IL-6 and contra staining with hematoxylin 40X. Female rats were fed with a control diet (C = Lab Rodent Diet 5001, Fort Worth, TX, USA) or with an obesogenic diet (MO = maternal obesity 20 % lard + 5 % vegetal oil) during growth (21–120 day of life) and pregnancy and lactation. At PND 90, females were divided into four groups for Res intervention (Do = 20 mg/kg.day) and identified as C, CRes, MO and MORes (n 5–6). Data are mean ± sem, two-way ANOVA, *P < 0.05 for effect of diet between C and MO or CRes and MORes; P < 0.05 for effect of Res, different letters between C and CRes or MO and MORes; I: interaction between maternal diet and Res supplementation.

Figure 3 Long description
Panel A: One vertical bar graph shows the cytoplasm area in square micrometers. The x-axis labels are C, CRes, MO, and MORes. The y-axis is labeled Cytoplasm (x1000um2). Panel B: One vertical bar graph shows the nuclei size in square micrometers. The x-axis labels are C, CRes, MO, and MORes. The y-axis is labeled Nuclei size (x1000um2). Panel C: Four micrographs at 100X magnification show mammary gland tissue stained with hematoxylin and eosin. The labels are C, CRes, MO, and MORes. Panel D: One vertical bar graph shows the percentage staining area of IL-6. The x-axis labels are C, CRes, MO, and MORes. The y-axis is labeled % staining area IL-6. Panel E: Four micrographs at 40X magnification show mammary gland tissue stained for IL-6 and counterstained with hematoxylin. The labels are C, CRes, MO, and MORes.
Maternal mammary gland TUNEL staining and PNCA proliferation at 21 dL
The number of apoptotic cells was higher in the MO groups compared with the C groups with a significant ameliorating effect of Res supplementation (Figure 4a, b1–b3). Res was able to reduce cell death in obesogenic animals, but not to the same levels as in control animals. There was an interaction between maternal diet and Res supplementation (P < 0·0005). The cell proliferation quantified by PCNA-positive cells was similar in all groups (Figure 5a, b1–b3). There was an interaction between maternal diet and Res supplementation (P < 0·01).
Maternal MG TUNEL at 21 dL. (a) Quantitative analysis of MG apoptotic cells (% positive TUNEL cells per field) and micrographs 20× (b1) apoptotic cells in green Alexa Flour 488 ®, (b2) nuclei were stained with DAPI in blue and (b3) Merge images with arrows point the positive TUNEL cells in yellow. Female rats were fed with a control diet (C = Lab Rodent Diet 5001, Fort Worth, TX, USA) or with an obesogenic diet (MO = maternal obesity 20 % lard + 5 % vegetal oil) during growth (21–120 days of life) and pregnancy and lactation. At PND 90, females were divided into four groups for Res intervention (Do = 20 mg/kg.day) and identified as C, CRes, MO and MORes (n 5–6). Data are mean ± sem, two-way ANOVA, *P < 0.05 for the effect of diet between C and MO or CRes and MORes; P < 0.05 for the effect of Res, different letters between C and CRes or MO and MORes; I: interaction between maternal diet and Res supplementation.

Maternal proliferation index. (a) Quantitative MG proliferating cells (% PCNA positive cells per field) and micrographs 40× (b1) proliferating cells Alexa fluor 594 ®, (b2) nuclei were stained with DAPI in blue and (b3) merge images with arrows pointing the positive proliferating cells in pink. Female rats were fed with a control diet (C = Lab Rodent Diet 5001, Fort Worth, TX, USA) or with an obesogenic diet (MO = maternal obesity 20 % lard + 5 % vegetal oil) during growth (21–120 days of life) and pregnancy and lactation. At PND 90, females were divided into four groups for Res intervention (Do = 20 mg/kg.day) and identified as C, CRes, MO and MORes (n 5–6). Data are mean ± sem, two-way ANOVA, I: interaction between maternal diet and Res.

Figure 5 Long description
Panel A: The bar graph displays the percentage of PCNA positive cells per field. The x-axis represents different groups: C, CRes, MO, and MORes. The y-axis shows the percentage of PCNA positive cells per field. The graph indicates that the C group has the highest percentage of PCNA positive cells, followed by CRes, MO, and MORes groups. Panel B: The micrographs show proliferating cells stained with Alexa Fluor 594 in red, nuclei stained with DAPI in blue, and merged images with arrows pointing to positive proliferating cells in pink. The images are labeled as C, CRes, MO, and MORes, corresponding to the different diet and resveratrol supplementation groups.
Maternal milk composition and pup milk intake at 21 dL
The milk water content and maternal milk production were lower in MO compared with C and MORes compared with CRes (Figure 6a and e), with no effect of Res supplementation (C v. CRes and MO v. MORes). There was an interaction between maternal diet and Res supplementation only in the water content (P < 0·02); The protein/fat ratio was lower in MO groups compared with C and Res supplementation partially restored the ratio towards control values (Figure 6b). There was no significant difference in the percentage of milk protein content between the maternal diet and Res supplementation. However, the offspring protein milk intake was lower in the MO group compared with the C, and Res supplementation significantly improved offspring protein intake, comparable to control levels (Figure 6c and g). Additionally, the percentage fat content was higher in the MO groups compared with the C groups. Res supplementation significantly reduced the percentage of fat in the MO milk, but not to control levels (Figure 6d). Offspring fat intake was significantly increased in the obese groups with no apparent effect of Res supplementation (Figure 6h). Finally, the milk intake of the offspring was lower in MO compared with C and MORes compared with CRes. Res supplementation increased milk intake in both CRes compared with C and MORes compared with MO (Figure 6f). From day 11 onward, the pup opens its eyes and can access its dam’s food. The offspring intake of its dam’s food (complementary food) was not determined.
Milk composition and milk intake from offspring. (a) Water content in milk, (b) protein/fat content ratio, (c and d) protein and fat content respectively, (e) maternal milk production, (f) offspring milk intake, (g and h) protein and fat offspring milk intake. Female rats were fed with a control diet (C = Lab Rodent Diet 5001, Fort Worth, TX, USA) or with an obesogenic diet (MO = maternal obesity 20 % lard + 5 % vegetal oil) during growth (21–120 days of life) and pregnancy and lactation. At PND 90, females were divided into four groups for Res intervention (Do = 20 mg/kg.day) and identified as C, CRes, MO and MORes (n 5–6). Data are mean ± sem, two-way ANOVA, *P < 0.05 for the effect of diet between C and MO or CRes and MORes; P < 0.05 for the effect of Res, different letters between C and CRes or MO and MORes; I: interaction between maternal diet and Res supplementation; n.s. not significant.

Fatty acid milk content and pup fatty acid intake at 21 dL
The percentage of saturated and MUFA was higher in MO than in C. However, only MUFA were higher in MORes than in CRes. Supplementation with Res decreased both saturated and MUFA in MORes compared with MO (Figure 7a). There was an interaction in saturated (P < 0·02) and MUFA (P < 0·03) between maternal diet and Res supplementation. There was no significant difference in the percentage of n-3, AA, EPA and DHA between the maternal control diet and the obesogenic diet. Res supplementation did not have any effect on these percentages (Figure 7a).
Milk composition. (a) Fatty acid content in the milk, (b) offspring fatty acids intake (b1) AA intake, (b2) EPA intake (b3) DHA intake (b4) AA/EPA+DHA intake. Female rats were fed with a control diet (C = Lab Rodent Diet 5001, Fort Worth, TX, USA) or with an obesogenic diet (MO = maternal obesity 20 % lard + 5 % vegetal oil) during growth (21–120 days of life) and pregnancy and lactation. At PND 90, females were divided in four groups for Res intervention (Do = 20 mg/kg/day) and identified as C, CRes, MO and MORes (n 5–6). Data are mean ± sem, two-way ANOVA, *P < 0.05 for the effect of diet between C and MO or CRes and MORes; P < 0.05 for the effect of Res, different letters between C and CRes or MO and MORes; I: interaction between maternal diet and Res supplementation; n.s. not significant.

Figure 7 Long description
Panel A: A table with seven rows and seven columns comparing the fatty acid content in milk from rats fed different diets. The columns are labeled Fatty acid (%), C, CRes, MO, MORes, and I:p. The rows are labeled Saturates, Monosaturates, OMEGA 3, OMEGA 6, AA, EPA, and DHA. Each cell contains values with standard error of the mean (sem) and p-values indicating statistical significance. Panel B: Four bar graphs showing offspring fatty acid intake. (b1) AA milk intake in mg per hour per 10^-3, (b2) EPA milk intake in mg per hour per 10^-3, (b3) DHA milk intake in mg per hour per 10^-3, and (b4) AA/EPA+DHA milk intake ratio in mg per hour. Each graph compares four groups: C, CRes, MO, and MORes. The y-axes represent the intake values, and the x-axes represent the different diet groups. Notable trends include significant differences in intake values between groups, indicated by asterisks and different letters.
However, the percentage of n-6 was higher in the MO compared with the C group and in the MORes compared with the CRes group. Res supplementation decreased the percentage of n-6 in the MORes compared with the MO group (Figure 7a). There was an interaction between maternal diet and Res supplementation (P < 0·05).
There were no differences in the milk intake of AA and EPA between the maternal diet and Res supplementation groups (Figure 7b1 and b2). However, DHA milk intake was lower in the MO compared with the C group, and Res supplementation significantly increased DHA intake towards control values. DHA milk intake was similar between the CRes and MORes groups (Figure 7b3). Finally, the AA/EPA + DHA ratio was higher in the MO compared with the C group and in the MORes compared with the CRes group, with no changes observed with Res supplementation (Figure 7b4).
Offspring results at PND 36
Offspring body weight and total fat at PND 36
At PND 36, male and female offspring had similar body weights among groups (Figure 2c and 2e). Nevertheless, both male and female offspring had higher total fat in the MO compared with the C and MORes groups and in the MORes group compared with the CRes group (Figure 2d and 2f). There was an interaction between maternal diet and Res supplementation only in male pups (P < 0·01).
Offspring metabolic parameters at PND 36
Glucose levels in offspring at PND36 were similar between groups and sexes. However, TAG and cholesterol levels were higher in the MO compared with the C group for both sexes. Insulin and HOMA-IR were higher in female MO compared with C group. In male offspring, TAG and leptin serum concentrations were higher in the MO compared with the MORes group. Interestingly, Res supplementation lowered male offspring insulin levels in both the MO and control groups. There was an interaction between maternal diet and Res supplementation for male TAG (P = 0·04) and male leptin (P < 0·01) in male pups (Table 2). In females from MORes, TAG, insulin and HOMA-IR were lower compared with the MO group (Table 2). There was an interaction between maternal diet and Res supplementation for female insulin (P = 0·001) and females HOMA-IR (P = 0·001).
Discussion
During gestation and lactation, the mammary gland must undergo proliferation and differentiation to produce sufficient milk of high quality for the normal growth and development of the offspring. Previously, our group reported that consumption of high-fat diets impair maternal liver and mammary gland development and function, negatively regulating PUFA metabolism(Reference Bautista, Montaño and Ramirez3). This has severe consequences on milk production and composition, which negatively affect the offspring brain development and adipose index(Reference Bautista, Montaño and Ramirez3), as well as metabolism(Reference Vega, Reyes-Castro and Rodríguez-González30), hormonal(Reference Bautista, Rodriguez-Gonzalez and Morales41), reproductive(Reference Rodríguez-González, Vega and Boeck42) and behavioural complications(Reference Rodriguez, Rodriguez-Gonzalez and Reyes-Castro43) from early life and reduced longevity in both male and female rats(Reference Rodríguez-González, Reyes-Castro and Bautista9). Therefore, there is a need to implement opportune interventions in the mother to prevent the adverse effects of metabolic programming. Recent studies of interventions in maternal obesity have shown improvement in maternal and offspring metabolic health(Reference Rodríguez-González, Vargas-Hernández and Reyes-Castro26,Reference Zambrano, Rodríguez-González and Reyes-Castro36,Reference Daher-Abdi, Olvera Hernández and Reyes Castro44) .
Res is a natural polyphenolic compound used as an antioxidant to improve metabolic dysregulation(Reference Zheng, Feng and Cheng18). Different authors have demonstrated the benefits of maternal Res supplementation in rats during pregnancy and lactation over cardio-metabolic disorders in the offspring(Reference Agarwal, Morriseau and Kereliuk45,Reference Lacerda, Costa and de Oliveira46) . In our previous study, Res supplementation to obese rat dams ameliorated the morphological changes in the small intestine offspring of aged rats in a sex-dependent manner(Reference Castro-Rodríguez, Reyes-Castro and Vargas-Hernández29).
Although body weight was similar between dams and offspring of both sexes in the MO group with respect to C, body fat was higher in MO for both dams and offspring; Maternal Res supplementation decreased adiposity in the obese dams at the end of lactation and also in offspring born to obese dams at PND 36. This finding shows the same tendency as our previously published data during gestation(Reference Rodríguez-González, Vargas-Hernández and Reyes-Castro26). It is important to note that although the maternal intervention with Res was only prior to and during pregnancy and not during lactation, the positive metabolic effects continue at the end of lactation such as decreased body fat. Maternal metabolism is of great importance for the proper metabolic programming of the offspring. In another maternal obese model, female mice C57BL/6J fed an obesogenic diet for 4 weeks before mating and during pregnancy and lactation showed increase concentrations of glucose, cholesterol and insulin(Reference Saengnipanthkul, Noh and Friedline47). In our model with Wistar rats, similar data are shown except for insulin, which was not different between MO and C. Res supplementation had a benefical effects in these parameters. Similar benefits were shown in the protein restricted maternal model(Reference Vega, Reyes-Castro and Rodríguez-González30).
The data presented at the end of lactation build on previous work demonstrating the benefits of Res supplementation in obese dams prior to and during gestation(Reference Rodríguez-González, Vargas-Hernández and Reyes-Castro26). Res supplementation in the obese dam reduced body weight and fat accumulation, improving metabolic parameters during lactation. In agreement with our results, Res supplementation in control mice during pregnancy and lactation at different concentrations (20 mg kg−1 and 40 mg kg−1) has positive effects at weaning on mammary gland cell proliferation and modulates antioxidant function by increasing the expression of genes involved in mitophagy(Reference Zha, Xiao and Song48); meanwhile, we observed that Res supplementation did not cause any changes in MG weight compared with MO. However, it resulted in better preservation of the cellular parenchymal tissue and a lower percentage of fat area. Maternal Res supplementation restored the cytoplasmic area and nuclear size to levels similar to the C group. At the end of lactation, during the involution process of the MG, smaller cell sizes are found by apoptosis and tissue regeneration. The parenchymal site begins to invade the stromal cells and adipose tissue, resulting in cell loss and tissue replacement. In the MO group, the decrease in nucleus and cytoplasm is evident and associated with premature involution, which we corroborated by quantifying IL-6. IL-6 induces MG replacement by involution(Reference Zhao, Melenhorst and Hennighausen49). In the CRes group, this process was prevented due to lower IL-6 expression, which likely improves maternal milk production and composition.
Breast milk contains a variety of macro and micro-molecules, hormones, antibodies and bioactive compounds that benefit the development of pups. One crucial macro-molecule is protein, essential for muscle growth, adequate development, blood pressure control and immune system maturation(Reference Lönnerdal50). This study showed that the MO and MORes groups had lower breast milk production and offspring intake compared with the C and CRes groups. However, the offspring from both Res supplementation groups (CRes and MORes) consumed more milk.
As previously reported milk protein concentration was similar among groups, but MO offspring had lower milk intake, resulting in lower protein intake(Reference Bautista, Montaño and Ramirez3), while the offspring protein milk intake in MORes was similar to C. The fat content decreased and the protein:fat ratio increased in MORes compared with MO, without any benefit of offspring fat milk intake by maternal Res supplementation. Different experimental models aim to demonstrate the potential benefits of various dietary interventions on milk composition, since breast milk varies with diverse maternal factors including diet(Reference Zambrano, Rodríguez-González and Reyes-Castro36) and also confers health benefits to the neonate; studies by Dana E. Lowry et al(Reference Lowry, Paul and Reimer51) demonstrated the benefits of prebiotic oligofructose in a maternal high-fat/sucrose rat model, showing improvements in milk composition and differential expression of 6 miRNAs (miR-222, miR-203a, miR-200a, miR-26a, miR-27a and miR-103). This had benefits on offspring body composition, and gut microbiota at the end of lactation, in a sex dependent manner. However, they found lower protein concentration in the milk of the high-fat/sucrose group, contrary to our findings that milk protein concentration was similar among experimental groups. It is important to recognise the fact that consuming more milk is not nesessarily optimal and that it is the milk composition, which is critical as the primary source of nutrients for offspring development(Reference Bautista, Bautista and Montaño39). It is important to note that offspring intake of dam’s food (complementary feeding) was not determined, which may affect developmental programming of the pups, not only because the difference in amount, but also because the maternal diet. Few studies have investigated the positive effects of maternal supplementation with Res on the levels of long-chain PUFA in breast milk(Reference Bautista, Montaño and Ramirez3,Reference Ros, Argente and Chowen19) . The benefits of Res supplementation on maternal metabolism are likely reflected in increased milk production and DHA content. Neonates cannot synthesise these fatty acids themselves and must therefore obtain them through breast milk. In particular, the adequate ratio of arachidonic acid (AA), EPA and DHA is important for the maturation of the retina and brain, as well as for immune system function, anti-inflammatory processes and neurological development(Reference Lien52). A high or low proportion of AA/EPA + DHA in the milk consumed has a detrimental effect on the proper formation of neural connections and the nervous system. In this study, the levels of saturated, monounsaturated and n-6 fatty acids in milk were higher in MO than in C; however, MORes reduced all of them.
We observed the positive benefits of maternal Res supplementation not only on milk composition and offspring milk intake but also the progressive benefits, 2 weeks after weaning (PND 36). In male offspring of obese dams, Res had a beneficial effect on fat accumulation, TAG and leptin levels, whilst in female pups, the positive effects were found on the reduce fat accumulation, TAG, leptin and HOMA-IR suggested a sexual dimorphism in the developmental programming effects of Res(Reference Rodríguez-González, Reyes-Castro and Bautista9).
In summary, these findings in combination with our previous publication related to MO effects on offspring ageing and sexual dimorphism are important. Male offspring from the MO group have not only more body weight, fat accumulation, hormone and metabolic parameters and oxidative stress biomarkers but also liver fat accumulation(Reference Rodríguez-González, Reyes-Castro and Bautista9). These negative effects occur earlier compared with offspring from the C group, and interestingly, in a sex-specific manner. This provides compelling evidence for programming–ageing interactions. In this study, the young offspring (PND 36) show that maternal Res supplementation has different positive metabolic effects that are sex-dependent (Figure 8); in addition, maternal Res supplementation in pregnancy prevents offspring dysmetabolism during the ageing process(Reference Castro-Rodríguez, Reyes-Castro and Vargas-Hernández29). Maternal supplementation during the critical development window is a potential mechanism for changing mammary gland function and milk composition.
Maternal and offspring Res supplementation prior and during pregnancy on the maternal obesity model. Improve: MORes ≠ to MO; Restore MORes = C.

Conclusion
Maternal high-fat diet negatively affects maternal MG function during lactation. Res is an anti-inflammatory and antioxidant compound. Its supplementation in obese dams was effective in enhancing MG maturation and differentiation and reducing apoptotic cells. This benefits milk nutrient composition and offspring adiposity. These results are encouraging because they demonstrate the importance of designing effective maternal interventions to prevent adverse outcomes for mothers and their offspring.
Acknowledgements
We thanks PhD Carlos A. Ibáñez (Facultad de Química UNAM) for his technical support.
This work was supported by the Newton Fund RCUK-CONACyT (Research Councils UK—Consejo Nacional de Ciencia y Tecnología). I000/726/2016 FONCICYT/49/2016.
C.J.B., L.A.R.-C., S.M., V.R. and E.Z. researched data and data analysis. E.Z. funding acquisition. C.J.B., L.A.R.-C., V.R. study design. C.J.B. preparation of the manuscript. C.J.B. L.A.R.-C., V.R., P.D.T. and E.Z. review of the manuscript. E.Z. final approval of the manuscript. All authors have read and agreed to the published version of the manuscript.
The authors declare no conflict of interest. The funders had no role in the design of the study; in the collection, analyses or interpretation of data; in the writing of the manuscript or in the decision to publish the results.
The study was approved by the Animal Experimentation Ethics Committee of the Instituto Nacional de Ciencias Médicas y Nutrición Salvador Zubirán (INCMNSZ), Mexico City, Mexico (ethical approval code, BRE-1868).
Not applicable.
Data are contained within the article.