







1. Introduction
The Fe K
 $\alpha$
line (
 $\sim$
6.4 keV) is produced when X-ray photons or electrons with energies above the Fe K-edge (7.11 keV) irradiate cold matter, ionizing iron atoms and leading to X-ray emission from transitions into the K-shell. The Fe K
 $\alpha$
fluorescence line has been detected in flares from pre-main-sequence stars (e.g., Tsujimoto et al. Reference Tsujimoto, Feigelson, Grosso, Micela, Tsuboi, Favata, Shang and Kastner2005), the Sun (e.g., Tanaka et al. Reference Tanaka, Watanabe and Nitta1984), and active late-type stars (e.g., Osten et al. Reference Osten2010). In pre-main-sequence stars, this phenomenon is generally attributed to disk irradiation, whereas in late-type stars, it is thought to arise from photospheric iron ionized by coronal X-rays. In both cases, the dominant process is assumed to be photoionization, although collisions with nonthermal electrons may also contribute.
The question of whether Fe K
 $\alpha$
emission in solar flares is dominated by photoionization or by nonthermal electron collisions was actively debated in the 1980s, when numerous Fe K
 $\alpha$
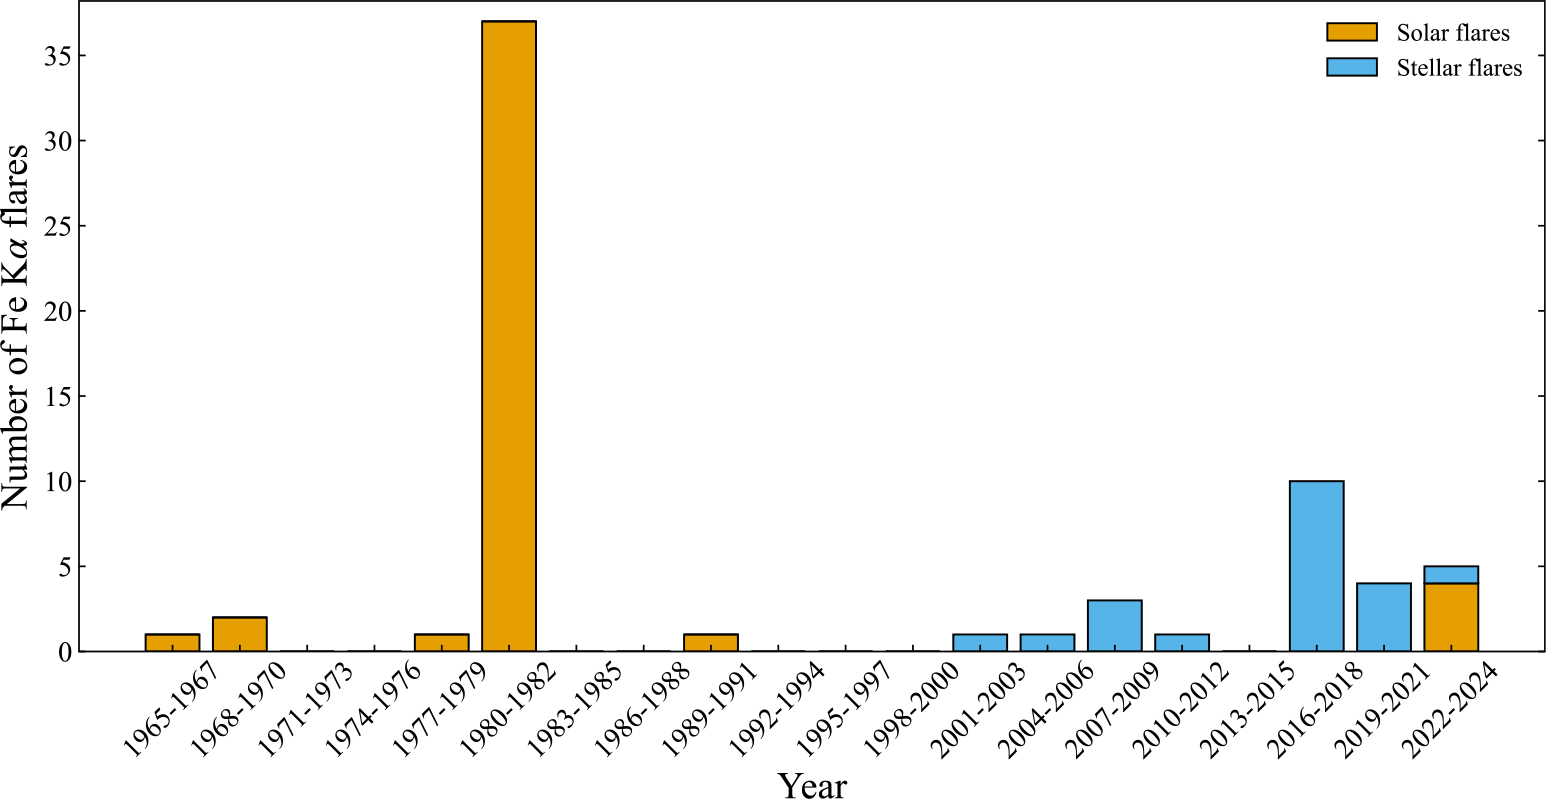
detections were made by Hinotori (Tanaka et al. Reference Tanaka, Watanabe, Nishi and Akita1982, Reference Tanaka, Nitta, Akita and Watanabe1983, Reference Tanaka, Watanabe and Nitta1984) and the Solar Maximum Mission (SMM) (Parmar et al. Reference Parmar, Culhane, Rapley, Phillips, Wolfson, Acton and Dennis1982, Reference Parmar, Culhane, Rapley, Wolfson, Acton, Phillips and Dennis1984). Figure 1 summarizes the history of Fe K
 $\alpha$
observations in solar and stellar flares. Since the termination of SMM in 1989, however, no X-ray spectroscopic observations covering the Fe K
 $\alpha$
band have been performed for the Sun for more than 30 years, except for the recent indirect observations by XRISM (Suzuki et al. Reference Suzuki2025), leaving the origin of the line an unresolved question. In contrast, several stellar flares with Fe K
 $\alpha$
emission have been reported in the 21st century using Chandra and Swift (e.g., Osten et al. Reference Osten, Drake, Tueller, Cummings, Perri, Moretti and Covino2007, Reference Osten2010). In the stellar case, if the line originates from photoionization, it can be used to estimate the latitude and size of spatially unresolved flare loops (Testa et al. Reference Testa, Drake, Ercolano, Reale, Huenemoerder, Affer, Micela and Garcia-Alvarez2008). Thus, identifying the emission mechanism is of critical importance.
Histogram showing the number of solar (orange) and stellar (blue) flares in which the Fe K
 $\alpha$
line has been detected. Solar flare samples are taken from Neupert et al. (Reference Neupert, Gates, Swartz and Young1967); Neupert (Reference Neupert1971); Doschek et al. (Reference Doschek, Meekins, Kreplin, Chubb and Friedman1971); Bai (Reference Bai1979); Feldman et al. (Reference Feldman, Doschek and Kreplin1980); Culhane et al. (Reference Culhane1981); Parmar et al. (Reference Parmar, Culhane, Rapley, Phillips, Wolfson, Acton and Dennis1982); Tanaka et al. (Reference Tanaka, Watanabe, Nishi and Akita1982, Reference Tanaka, Nitta, Akita and Watanabe1983); Parmar et al. (Reference Parmar, Culhane, Rapley, Wolfson, Acton, Phillips and Dennis1984); Tanaka et al. (Reference Tanaka, Watanabe and Nitta1984); Tanaka & Zirin (Reference Tanaka and Zirin1985); Emslie et al. (Reference Emslie, Phillips and Dennis1986); Zarro et al. (Reference Zarro, Dennis and Slater1992); Phillips et al. (Reference Phillips, Pike, Lang, Zarro, Fludra, Watanabe and Takahashi1995); Phillips (Reference Phillips2012); Suzuki et al. (Reference Suzuki2025), and stellar flare samples from Osten et al. (Reference Osten, Drake, Tueller, Cummings, Perri, Moretti and Covino2007); Testa et al. (Reference Testa, Drake, Ercolano, Reale, Huenemoerder, Affer, Micela and Garcia-Alvarez2008); Osten et al. (Reference Osten2010); Huenemoerder et al. (Reference Huenemoerder, Schulz, Testa, Drake, Osten and Reale2010); Karmakar et al. (Reference Karmakar, Pandey, Airapetian and Misra2017); Inoue et al. (Reference Inoue, Enoto, Notsu, Uchida, Iwakiri, Namekata and Gendreau2025). Note that pre-main-sequence stars are excluded, as their Fe K
 $\alpha$
lines originate from disk irradiation and are distinct in nature from those observed in solar and late-type stellar flares.

The Neutron Star Interior Composition Explorer (NICER; Gendreau et al. Reference Gendreau2016) has observed many superflares on RS CVn-type stars since 2017, benefiting from its large effective area of
 $\sim600\ \mathrm{cm}^{2}$
around 6 keV (Gendreau et al. Reference Gendreau, Arzoumanian and Okajima2012; Arzoumanian et al. Reference Arzoumanian and Takahashi2014). RS CVn-type stars are magnetically active binaries that provide X-ray spectra of large superflares with high photon statistics (e.g., Kurihara et al. Reference Kurihara2024; Inoue et al. Reference Inoue2024). Despite this, no Fe K
 $\alpha$
detections from RS CVn-type stellar flares with NICER have been reported to date. Motivated by this, we hypothesized that many unreported Fe K
 $\alpha$
events remain in the NICER stellar flare archive, and we carried out a systematic analysis. In this work, we present the data analysis, results, and implications of our study.
2. Data Reduction & Analyses
We analyzed all NICER archival data of RS CVn-type stars (UX Ari, GT Mus,
 $\sigma$
Gem, HD 251108, HR 1099, VY Ari, and DS Tuc), totaling 255 ObsIDs and
 $\sim$
700 ks of exposure. The data were processed with <monospace>nicerl2</monospace> (HEASoft 6.32.1, CALDB xti20240206), applying overshoot rate and rigidity filters. Source and background spectra were generated with <monospace>nicerl3-spect</monospace> and the 3C50 model, and GTI-resolved spectra were also extracted using our automated Python pipeline.Footnote
1
Quiescent phases were defined from the lowest non-variable observations. Using 0.3–4 keV light curves, we calculated median count rates
 $C_{\mathrm{q}}$
and standard deviation
 $\sigma_{\mathrm{q}}$
to set flare thresholds at
 $C_{\mathrm{q}}+1.65\sigma_{\mathrm{q}}$
, corresponding to a 90% confidence excess above quiescent variability.
Spectral fitting was carried out in 5–8 keV using <monospace>Xspec</monospace> and <monospace>PyXspec</monospace>. Models included <monospace>apec</monospace> and <monospace>apec+gauss</monospace>, with the Gaussian line fixed at zero width since rotational and Doppler broadening are negligible compared with NICER’s energy resolution (137 eV at 6 keV). The line center energy (
 $E_{l}$
) and normalization (
 $F_{\mathrm{K\alpha}}$
) of Gaussian were free parameters, and a detection of the Fe K
 $\alpha$
line was claimed when
 $E_{l} = 6.4$
–6.7 keV with a positive 90% lower limit of
 $F_{\mathrm{K\alpha}}$
. We measured equivalent widths of the Fe K
 $\alpha$
line with <monospace>eqwidth</monospace> command and calculated the 7.11–20 keV thermal plasma luminosity (
 $L_{\mathrm{HXR}}$
) using the <monospace>flux</monospace> command.
3. Results & Discussion
Using the criteria described in Section 2, we identified 24 cases of Fe K
 $\alpha$
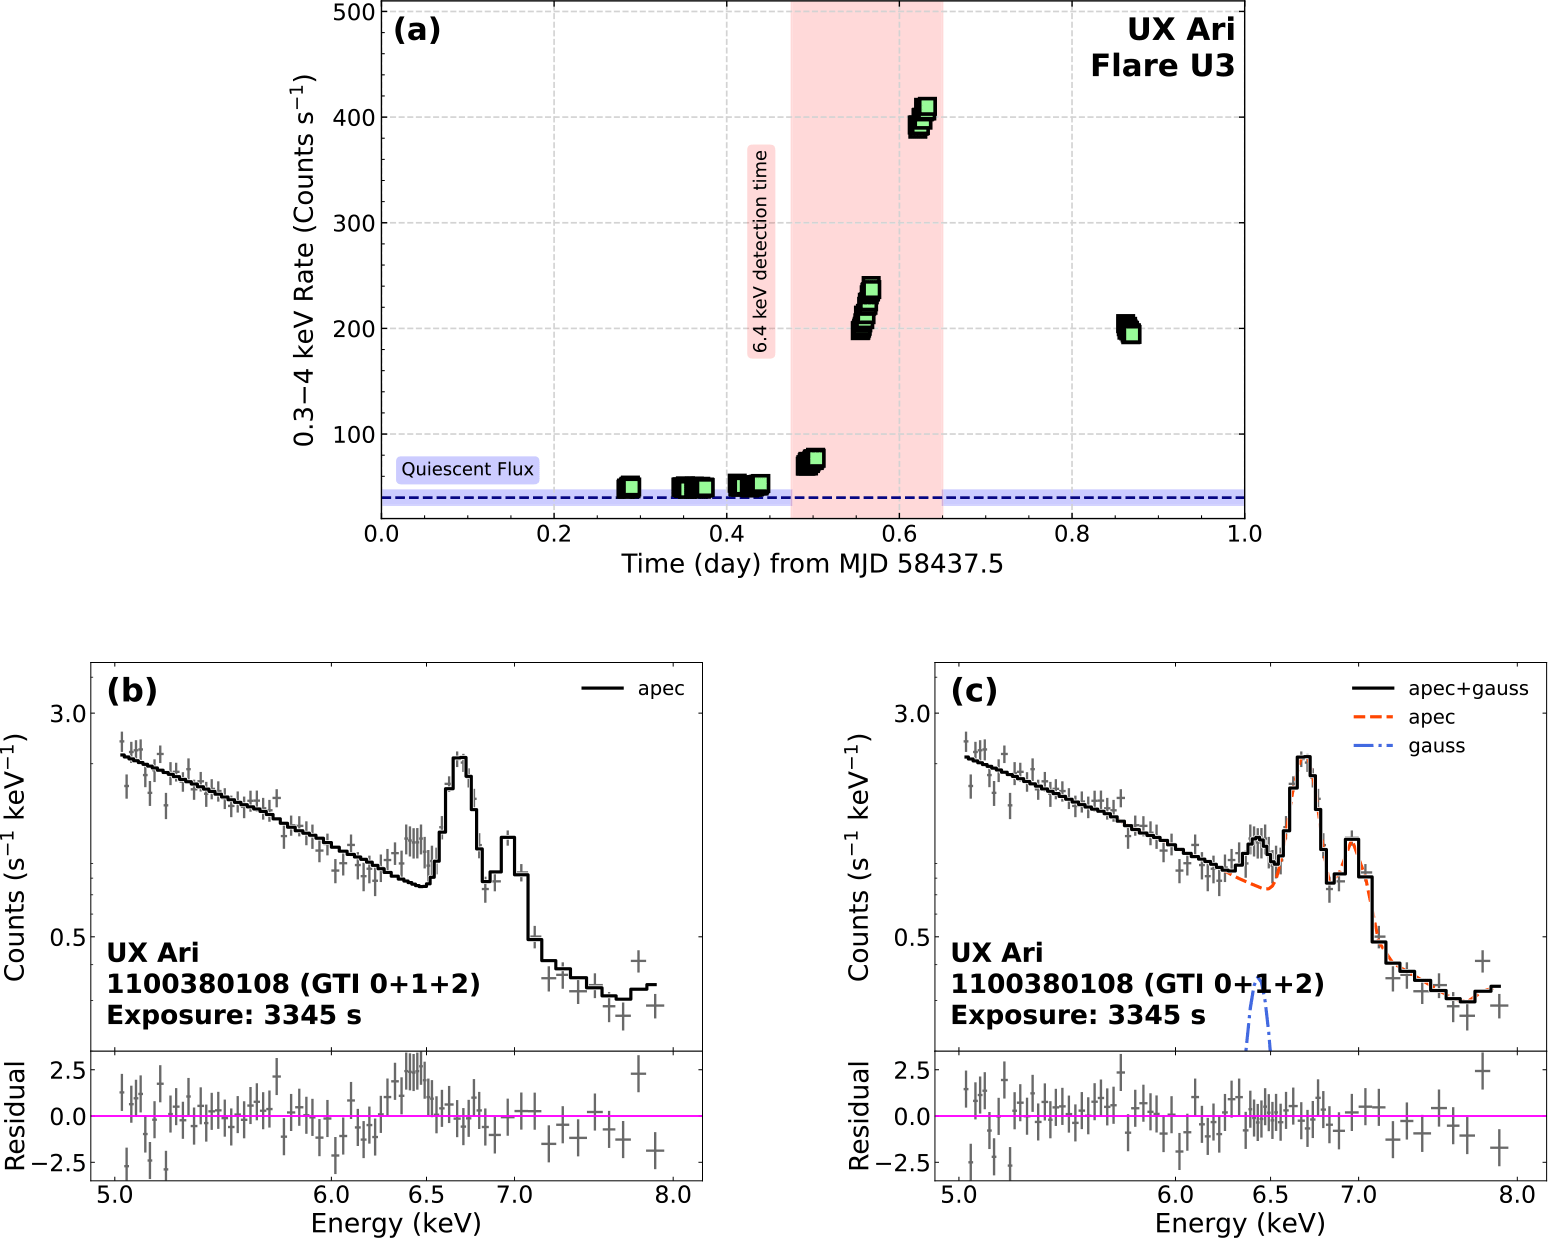
emission during flare phases and one detection during a quiescent phase. Figure 2 presents the light curve and spectrum of a superflare observed in November 2018 on UX Ari as a representative example, in which the Fe K
 $\alpha$
line was clearly detected.
Light curves and X-ray spectrum of UX Ari during the superflare in November 2018 taken from Inoue et al. (Reference Inoue, Enoto, Notsu, Uchida, Iwakiri, Namekata and Gendreau2025). (a) 64 s binned 0.3
 $-$
4 keV light curve. The vertical is count rate (cps; counts s^-1). The one standard deviation statistical error bars are smaller than the symbol size. The red shaded area indicates the time when the low-ionized Fe emission line is detected. (b)(c) Background-subtracted 5
 $-$
8 keV NICER spectra of UX Ari duing the time shown as the red-shaded area in panel a fitted with a CIE model (<monospace>apec</monospace>; panel b) and additionaly with the Gaussian emission line at
 $\sim 6.4$
keV (<monospace>apec+gauss</monospace>; panel c).

From these newly identified samples, we obtained the following results:
-
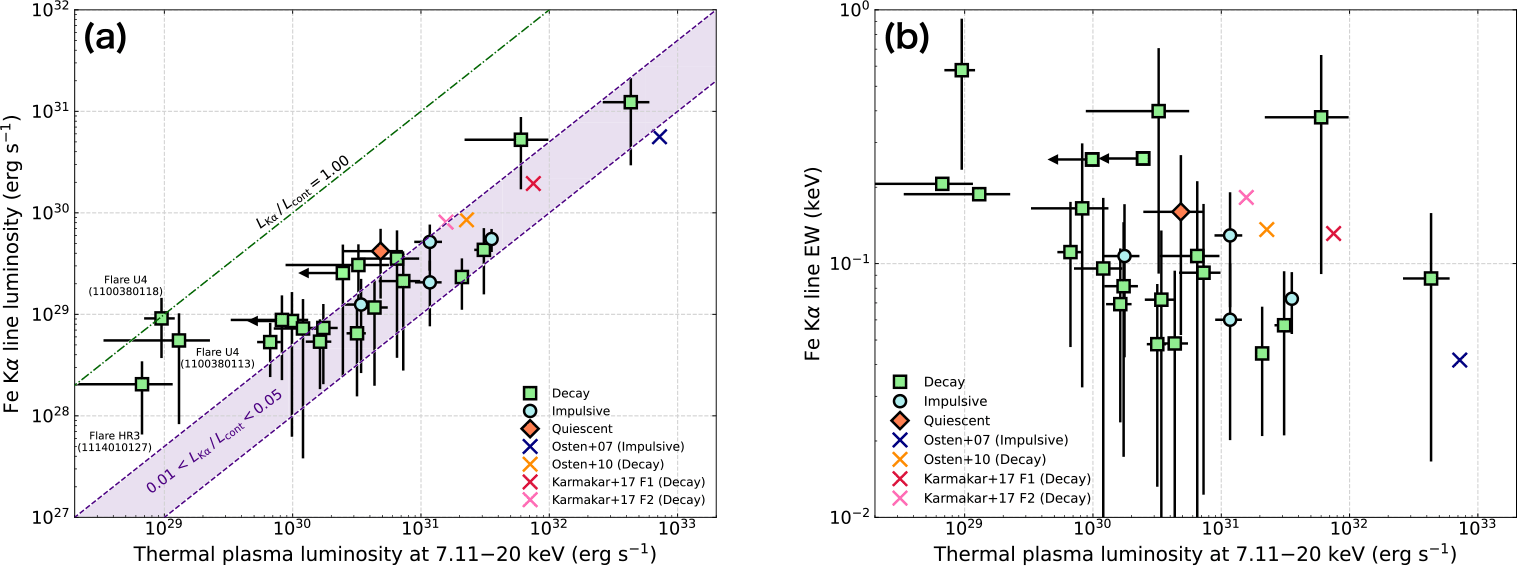
(1) As shown in Figure 3a, we find a positive correlation between the Fe K
 $\alpha$
line photon intensity and the 7.11–20 keV thermal plasma luminosity, with a Spearman rank correlation coefficient of
$0.74 \pm 0.08$
and a power-law index of
$L_{\mathrm{K \alpha}} \propto L_{\mathrm{HXR}}^{0.86 \pm 0.46}$
(
$1\sigma$
error).Figure 3.
Correlation obtained by our systematic analysis taken from Inoue et al. (Reference Inoue, Enoto, Notsu, Uchida, Iwakiri, Namekata and Gendreau2025). (a) The Fe K
$\alpha$
line luminosity vs. the 7.11
$-$
20 keV luminosity of the thermal plasma. The purple shaded area shows the range of
$L_{\mathrm{K \alpha}} / L_{\mathrm{HXR}}$
from
$0.01$
to
$0.05$
. The green dashdot line shows the slope
$L_{\mathrm{K \alpha}} / L_{\mathrm{HXR}} = 1$
. Green square, blue circle, and orange diamond symbols are the data obtained by NICER during the impulsive phase of a flare, the decay phase of a flare, and the quiescent phase, respectively. The crosses represent observations of the stellar flares reported by Osten et al. (Reference Osten, Drake, Tueller, Cummings, Perri, Moretti and Covino2007, Reference Osten2010) and Karmakar et al. (Reference Karmakar, Pandey, Airapetian and Misra2017). (b) The equivalent width of the Fe K
$\alpha$
line vs. the 7.11
$-$
20 keV luminosity of the thermal plasma. The same symbols as in panel a are used.Figure 3 Long description
Panel A: A scatter plot shows the Fe Kα line luminosity (erg s^-1) on the vertical axis and the thermal plasma luminosity at 7.11-20 keV (erg s^-1) on the horizontal axis. The purple shaded area indicates the range of L_Kα/L_HXR from 0.01 to 0.05. The green dashdot line represents the slope L_Kα/L_HXR = 1. Data points are marked with green squares, blue circles, and orange diamonds, representing observations during the impulsive phase, decay phase, and quiescent phase, respectively. Crosses represent observations from previous studies. Panel B: Another scatter plot shows the equivalent width of the Fe Kα line (keV) on the vertical axis and the thermal plasma luminosity at 7.11-20 keV (erg s^-1) on the horizontal axis. The same symbols as in Panel A are used to mark the data points.
-
(2) As shown in Figure 3b, we also find a negative correlation between the equivalent width of the Fe K
$\alpha$
line and the 7.11–20 keV thermal plasma luminosity, with a Spearman rank correlation coefficient of
$-0.44 \pm 0.12$
and a power-law index of
$\mathrm{EW}_{\mathrm{K \alpha}} \propto L_{\mathrm{HXR}}^{-0.27 \pm 0.10}$
(
$1\sigma$
error).


Both of these results support the photoionization origin of the Fe K
 $\alpha$
line. First, result (1) is consistent with Bai (Reference Bai1979), who showed that the photoionizing flux of the Fe K
 $\alpha$
emission line,
 $F_{\mathrm{K \alpha}}$
, can be expressed as
 \begin{equation}F_{\mathrm{K \alpha}} = \frac{\Gamma (T, h) f (\theta)}{4 \pi d^{2}} \int_{7.11 \mathrm{keV}}^{\infty} L (\varepsilon) d\varepsilon,\end{equation}
where
 $\Gamma (T, h)$
is the fluorescence efficiency, which depends on the plasma temperature T and flare loop height h;
 $f (\theta)$
describes the angular dependence of fluorescence; d is the distance to the observer (e.g., Sun-Earth distance); and the integral term represents the total luminosity above the Fe K-edge at
 $\sim$
7.11 keV. This formulation naturally explains the positive correlation between the Fe K
 $\alpha$
photon intensity and the 7.11–20 keV thermal plasma luminosity.
Second, result (2) reflects the decline of the fluorescence efficiency,
 $\varepsilon = 2 L_{\mathrm{K\alpha}} / L_{\mathrm{HXR}}$
, and the equivalent width
 $\mathrm{EW}_{\mathrm{K\alpha}}$
with increasing loop height h, due to the
 $1/h^{2}$
dilution of the irradiating flux at the stellar surface (Testa et al. Reference Testa, Drake, Ercolano, Reale, Huenemoerder, Affer, Micela and Garcia-Alvarez2008; Ercolano et al. Reference Ercolano, Drake, Reale, Testa and Miller2008).
4. Summary
We systematically searched the NICER archival data of RS CVn-type stars and identified 25 detections of the Fe K
 $\alpha$
emission line, along with a positive correlation between the Fe K
 $\alpha$
line intensity and the 7.11-20 keV thermal plasma luminosity. This indicates that many stellar flares exhibit Fe K
 $\alpha$
emission and that its dominant production mechanism is photoionization by thermal plasma.
In addition, although the details are not included in this proceeding, simultaneous far-ultraviolet and X-ray observations (Inoue et al., submitted) also support photoionization as the primary mechanism of the Fe K
 $\alpha$
line, providing an independent perspective complementary to this systematic analysis. Together, these results offer a resolution to the long-standing question dating back to solar X-ray observations in the 1980s.
 α
 α
 −
 −
 ∼6.4
 α
 −
 LKα/LHXR
 0.01
 0.05
 LKα/LHXR=1
 α
 −


