
I. INTRODUCTION
The energy crisis and environmental pollution have propelled a strong interest in the development of alternative and renewable energy sources. In contrast to the centralized energy supply manners, distributed generation systems generate the small-scale energy located near the customers or in remote areas. Conventional distributed generation methods cover various energy storage and conversion techniques, such as heat engines, fuel cells (FCs), capacitors, batteries, and solar cells. The benefits of such distributed energy sources are eliminating the losses from long-distance transmission and capital cost from accessory devices. Among those, FCs offer us a promising avenue toward chemical energy conversion and green electricity generation. The operating principle of FCs is similar to metal-air batteries which combine fuel (e.g., hydrogen) with an oxidant (oxygen from the air) through electrodes and an ion conducting electrolyte. But it allows devices to operate for a satisfactory length time compared with batteries and capacitors without plugging into an electricity input.Reference Meyers and Maynard1–Reference Winter and Brodd3 A fuel cell runs as long as reactants are sufficiently supplied to the working chambers, and the typical byproducts are water and heat. Yet, noble metal catalysts are required to trigger the oxygen reduction reaction (ORR) occurring at the cathode (i.e., the electrode that consumes electrons). So far, the most efficient catalyst for ORR has been still considered as platinum nanoparticles and Pt-based metal alloys. On one side, 0.25 g of Pt as a catalyst is typically needed to deliver a unit kilowatt of power for current FC techniques.Reference Rismani-Yazdi, Carver, Christy and Tuovinen4–Reference Tymen, Undisz, Rettenmayr and Ignaszak7 Fewer than 10 million FC-powered vehicles could be manufactured if the annual production of platinum was devoted to these vehicles.Reference Kongkanand and Mathias5 In general, platinum suffers from the naturally existing resource constraint. On the other side, the use of platinum brings high cost and always suffers from a time-dependent drift and sulfur/CO deactivation.Reference Yu and Ye8,Reference Zhang, Sasaki, Sutter and Adzic9 Pt-based catalysts show poor durability against fuels like methanol and carbon dioxide especially in an alkaline media. Mechanisms that contribute to the Pt/C cathode catalytic degradation include catalyst particle sintering, dissolution, and cathode-support corrosion.Reference Yu and Ye8 Therefore, it is highly desirable to seek low-cost, stable, and antideactivation catalysts to compete with conventional Pt catalysts.
Enormous efforts have been devoted to circumvent the limited proliferation of Pt-based catalysts such as nonnoble metal oxides, heteroatom-doped carbon materials, enzymatic bio-systems, and transition metals.Reference Bezerra, Zhang, Lee, Liu, Zhang, Shi, Marques, Marques, Wu and Zhang10–Reference Zhang, Wu, Fu, Shen, Zeng and Ding14 Recently, carbonaceous materials, such as activated carbon or activated charcoal (AC), activated carbon nanofibers, carbon nanotubes, and polypyrrole/carbon black composites have attracted a lot of attention.Reference Ghasemi, Shahgaldi, Ismail, Kim, Yaakob and Daud15–Reference Yuan, Zhou and Zhuang18 Carbon in these different electro-conductive modifications has been seen as the most versatile material for catalyzing the oxygen reduction reaction. AC-based catalysts are particularly promising with the advantages of their outstanding electrochemical stability, abundant reserve resources, and cost effectiveness (2.6 $/kg).Reference Maruyama, Sumino, Kawaguchi and Abe19,Reference Li, Wang, Ren, Ren, Qiu and Yu20 The capital cost of previously assembled AC-based air-cathode was estimated to 30–60 $/m2, which was substantially lower than that of commonly used Pt/C-Nafion-carbon electrodes (1400 $/m2). Besides the low capital cost, AC exhibits a very stable catalytic performance during the long term operation. Some AC-catalyzed FCs even show superior power generation properties than those made with a commercial Pt/C catalyst. For example, the power-generation property of microbial FCs of using microorganisms as a bio-catalyst and activated-carbon as ORR catalyst was explored. 300 mg AC was cold pressed with diffusion layers, a stainless steel mesh, and the textile to serve as the cathode. The microbial fuel cell delivered a power density of 1.56 W/m2 compared to 1.46 W/m2 equipped with the Pt catalyst (mass loading: 0.5 mg/cm2) and Nafion binder. After 3.5 months of operation in a batch mode, the power output of the microbial fuel cell with the Pt cathode had a 55% reduction in the maximum power density to 0.65 W/m2. After running the device for 5 months, the microbial fuel cell with the AC-based cathode produced a maximum power density of 1.45 W/m2, which was only decreased by 7.05%. Correspondingly, the power density of Pt-equipped FCs decreased by 60.9% to 0.57 W/m2.Reference Zhang, Xia, Ivanov, Huang and Logan21 Therefore, in the case of microbial FCs, AC-based catalysts exhibited a much excellent durability than that of commercial Pt during a long-term operation.
However, the catalytic performance of AC is still limited by its poor electrical conductivity and relatively small number of ORR catalytic sites in most applications.Reference Zhang, Xia, Ivanov, Huang and Logan21 The catalytic performance of commercial AC particles still could not compete with emerging carbon nanostructured materials (e.g., carbon nanotubes, graphene). A number of approaches have been demonstrated to improve the catalytic performance of AC, such as adding nitrogen-containing functional groups, pyrolyzing AC by iron ethylenediaminetetraacetic acid,Reference Zhang, Wen, Ci, Mao, Chen and He22–Reference Xia, Zhang, Zhang, Liang, Huang and Logan24 tailoring the electrical conductivity by blending carbon black,Reference Zhang, Xia, Ivanov, Huang and Logan21 and using metal meshes as current collectors.Reference Cheng and Wu25 These methods have been primarily focused on increasing the area of ORR active sites by adding other functional groups and improving the electrical conductivity. Nevertheless, the catalytic performance of the previously reported AC catalysts still has not satisfied the need for various-typed FCs. More importantly, to achieve a similar catalytic performance to platinum, the mass loading of AC is usually several folds and even much higher than that of Pt/C. For example, Zhang and co-workers optimized the AC loading of 43 mg/cm2 as the ORR catalyst in microbial FCs (tested range from 7 to 171 mg/cm2), which was 80-folds higher than the controlled Pt/C sample (5 mg/cm2 10% Pt on Vulcan XC-72 and Nafion binder) in the cathode for acceptable power density.Reference Zhang, Xia, Ivanov, Huang and Logan21 This heavy load of catalyst has to sacrifice the permeability of oxygen and water in the electrodes, and lower the mass-transfer efficiency to the reaction site. Meanwhile, the procedure of air-cathode fabrication may become complicated. The AC catalyst has to been repeatedly brushed or pressed on the support material to reach a desired loading capacity. It is unfavorable to build the FCs or metal-air batteries as niche electronics and portable power resources. Therefore, developing a new method for improving the AC catalytic performance per unit mass and lowering the electrode weight is still a big challenge hitherto.
Here, we reported a mesoporous graphene/activated carbon aerogel (GA/AC) to take advantage of utltralight aerogle-structure to boost the catalytic property toward ORR process. The mass density of our synthesized graphene/activated carbon aerogel was 20-times lighter than that of commercial AC in the air-cathode. Significantly, the incorporation of graphene sheets enlarged the electrode surface area and provided more active areas. A positively 0.2 V onset potential shifted, and 16% enhancement in the number of electron transfers during catalysis was observed at the premium weight ratios.
II. EXPERIMENTAL
A. Preparation of catalysts
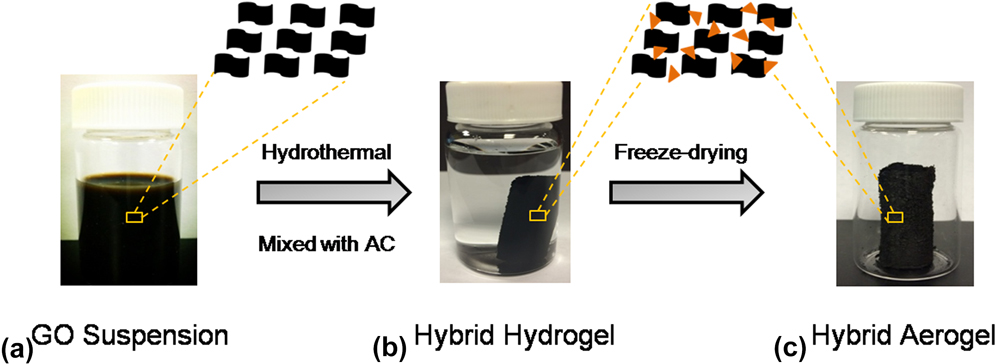
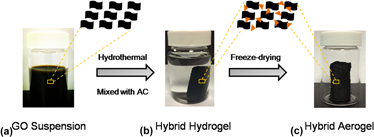
The GA/AC composite was synthesized by a one-step hydrothermal method.Reference Wu, Yang, Sun, Parvez, Feng and Müllen26,Reference Yang, Liu, Zhu, Zhang, Ye, Liao and Li27 As showed in Fig. 1, a graphene oxide (GO) solution served as the precursor of the GA/AC composite and was primitively prepared by oxidation and exfoliation of graphite (Fisher Science Education Inc., Asheville, North Carolina) using a modified Hummer’s method.Reference Hummers and Offeman28,Reference Wang, Wang, Ling, Qian, Song, Lu, Chen, Tong and Li29 2.5 g of graphite powder was mixed with concentrated sulfuric acid (98 wt%) and 10 mL concentrated nitric acid (65 wt%) in a container at 0 °C. Continually, 3 g potassium permanganate was slowly added to the solution at 35 °C, stirred for 3 h, and then diluted with 40 mL of deionized water. After stirring for 12 h, the mixture was further diluted by adding 200 mL of deionized water. Then, 3.0 mL of hydrogen peroxide aqueous solution (30% v/v) was added dropwise until the color of the mixture turned from brown to bright yellow. Once the solution temperature dropped to room temperature, the precipitate of graphite oxide was centrifuged at 1500 rpm for 30 min and washed with ample amount of water until the pH value was at nearly 7. Finally, the GO solution was dispersed in deionized water and vigorously sonicated to form a uniform suspension with a concentration of 5 mg/mL. 20 mL of the obtained GO dispersion was mixed with 1 mL ammonium hydroxide (Fisher Scientific Inc., Asheville, North Carolina) and amorphous activated carbon powder (Fisher Scientific Inc., Asheville, North Carolina). The weight ratios between graphene and activated carbon were controlled by varying the mass content of AC. Then, the GO-AC suspension was transferred into a Teflon liner and heated at 180 °C for 12 h to form the carbon-composite hydrogel, and preliminary reduce of GO to reduced graphene oxide (rGO) [Fig. 1(b)]. The as-prepared GA/AC composite hydrogel was immersed in deionized water overnight to remove the impurities. Finally, the hydrogel was lyophilized for 12 h to form the composite aerogel [Fig. 1(c)]. The densities of synthesized GA/AC composites were calculated to be 50–96 mg/cm3, which were significantly lower than that of the activated carbon alone (1900 mg/cm3).
Fabrication process of the GA/AC composites. (a) Stable suspension of GO in a vial. (b) GO solution mixed with activated carbon at different ratios to form the hybrid hydrogel, which was prepared by hydrothermal method. (c) Graphene-activated carbon hybrid aerogel obtained after the standard freeze-drying procedure. The black quadrangle in figure represented the graphene oxide nanosheets, and the orange triangle represented the activated carbon.

B. Material characterizations
The morphologies of synthesized catalysts were probed by a field-emission scanning electron microscopy (SEM; Hitachi S4800II, Hitachi, Tokyo, Japan). The composition of GA–AC was characterized by X-ray diffraction (XRD; Rigaku Americas Miniflex Plus powder diffractometer, Rigaku Inc., The Woodlands, Texas) and Raman spectroscopy (Renishaw inVia, Gloucestershire, United Kingdom). The XRD spectra were collected with a Rigaku Americas Miniflex Plus powder diffractometer. Diffraction spectra were recorded from a 2θ angle of 10–60° with a step size of 0.02° at a rate of 1°/min. Raman spectroscopy measurements were carried out by using a 632.8 nm wave length laser.
The specific surface areas and pore structures of plain AC and GA/AC composites were identified by the surface area and pore-structure analyzer (ASAP 2020, Micromeritics Inc., Norcross, Georgia). The Brunauer–Emmett–Teller (BET) analyses were performed using N2 adsorption/desorption isotherms at 77.3 K. The N2-physisorption relative pressure (P/P 0) was applied between 0.0 and 0.9, and the sample mass lied in the range of 0.03–0.06 g. Pore diameter-incremental volume plots were analyzed according to the Barrett–Joyner–Halenda (BJH) desorption model. Pore area and cumulative volume were expressed based on the BJH desorption and Density Functional Theory (DFT) models.
C. Electrochemical characterizations
Electrochemical characterizations were carried out in a standard electrolytic cell connected to an electrochemical station (CHI 660D, CH Instrument, Shanghai, China) including chronoamperometry, Tafel, and rotating ring disk electrode (RRDE) tests. All the experiments were carried out with a 50 mM phosphate buffer solution (PBS, K2HPO4 9.1 g/L, KH2PO4 1.28 g/L) as the electrolyte in a three-electrode system, where the Ag/AgCl electrode [saturated KCl +0.197 V versus standard hydrogen electrode (SHE)] and Pt plate (1 cm2) were used as a reference and as a counter electrode, respectively. In air-breathing electrode performance measurements, bare AC was mixed with a Nafion binder to form a paste and was brushed onto one side of a carbon paper (Toray Industries Inc., Tokyo, Japan) that served as the support and current collector. Besides acting as a binder, the Nafion binder was also used to facilitate the transfer of protons in the catalytic-layer. The mass loading of bare AC on the electrode reached an optimal value of 40 mg/cm2.Reference Zhang, Xia, Ivanov, Huang and Logan21 For the GA/AC cases, they were hot pressed on the carbon paper since the GA/AC composites were not readily soluble in the solution. The total mass loading of the catalyst was nearly 0.5 mg/cm2, which was equal to the commonly-used loading of the Pt/C catalyst in FCs.Reference Zhang, Xia, Ivanov, Huang and Logan21 A diffusion layer of polytetrafluoroethylene (PTFE) was added to the other side of the carbon paper to help the oxygen diffuse into the catalytic layer (70% porosity, 0.13 kg/m2) in both cases. The diffusion layer faced the ambient air. The “sandwich-type” assemble was performed like the air-cathode in real application and served as the working electrode. The home-assembled electrolytic cell was simulated to an FC device and was composed of an air-breathing electrode, a Pt plate, and an Ag/AgCl electrode. Two working chambers and a physical separator were tightly pressed by four bolts. In the RRDE test, rotating (Pt) and ring-(glassy-carbon) disk electrodes were selected as the working electrode to characterize the catalytic kinetics of the powders. 15 μL of the catalyst inks were prepared by mixing 0.4 mg catalyst powder and 1.6 mg carbon black (XC-72) with 4 µL Nafion solutions. Catalyst inks were slowly dropped via a 5 μL syringe onto the glassy-carbon disk (i.e., working electrode) and dried under nitrogen atmosphere. 3 µL 2 wt% Nafion solutions were added to the samples as extra binders before being immersed into the electrolyte solution for the RRDE test. Detailed procedure could be also found in the previous reports.Reference Liu, Song and Chen30,Reference Yang, Liu, Liao, Ye, Zhu, Li, Zhang, Peng, Chen and Li31
III. RESULTS AND DISCUSSION
A. Physical characterization of the GA/AC composites
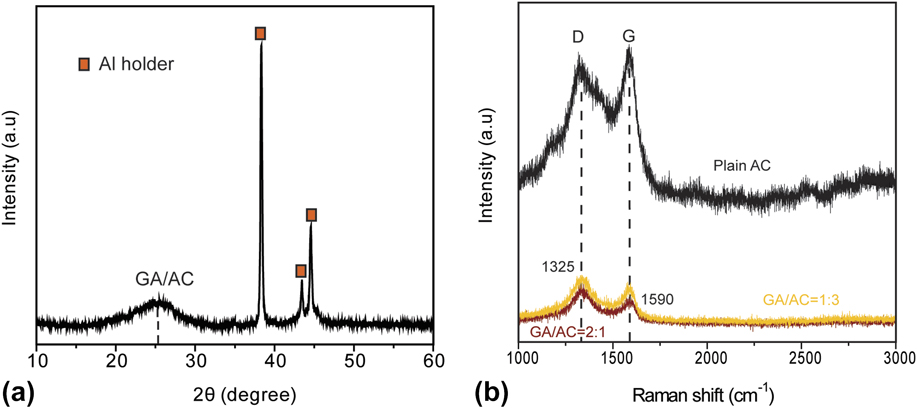
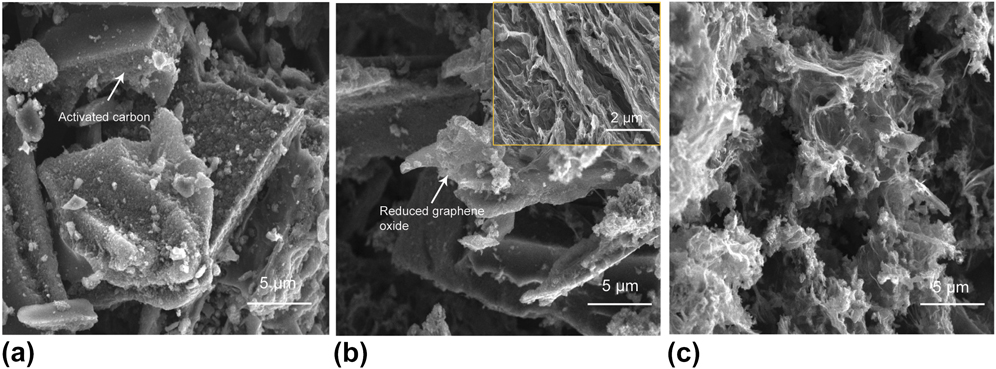
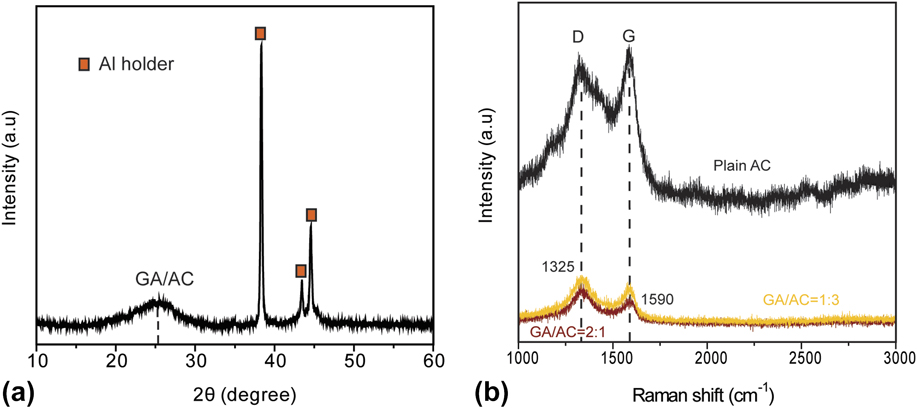
To determine the crystal structure and degree of graphitization of the synthesized GA/AC composite, X-ray diffraction and Raman spectroscopy tests were firstly carried out. As shown in Fig. 2(a), GA/AC exhibited a broad diffraction peak centered at 25° in the XRD spectrum, which was consistent with the previous graphene aerogel synthesized by the same freeze-drying method.Reference Zhang, Sui, Xu, Yue, Luo, Zhan and Liu32 The broad XRD peak suggested that the framework of the GA/AC composite was only composed of several-layer graphene sheets. These graphene sheets were poorly ordered along their stacking direction. To analyze the disordered and defect structures of the synthesized GA/AC composite, Raman spectrum was also collected. As shown in Fig. 2(b), two obvious peaks centered at 1325 and 1590 cm−1 were observed corresponding to the D and G band, which were consistent with that of plain AC [black curve in Fig. 2(b)]. The D band is related to elastic backscattering associated with structural defects and imperfections. The G band corresponds to the Raman active E2g photon from the sp 2 carbon domains (in-plane optical mode). I D/I G represents the ratio of D to G peak intensity and measures the relative concentration of sp 3 hybridized defects to the hybridized graphene domains. In general, it is often used as a tool to estimate the degree of disorder in graphitic materials. The larger the I D/I G indicates the lower the degree of graphitization. It can be seen that the D/G line intensity and intensity ratio were totally different for the plain AC and GA/AC composite. The intensity ratio decreased from 1.30 (GA/AC = 2:1) and 1.17 (GA/AC = 1:3) to 0.97 for plain AC due to the existence of the oxygen-containing functional groups. These functional groups caused an incomplete recovery of the conjunction domain of sp 2-dominated two-dimensional graphene crystals. Thus, the GA/AC composite shows a high degree of structural defects and edge planes. Figure 3 showed the SEM images collected for activated carbon alone and GA/AC composites at different weight ratios. The bulky and disordered AC particles could be observed in Fig. 3(a). Individual particles were intensely convoluted and displayed roughness on their surfaces. After mixing with reduced graphene oxide sheets and forming the GA/AC composite, it was clear that the surface of AC particles was covered with rGO sheets, as showed in Figs. 3(b) and 3(c). The SEM images depict typical morphological observations of the graphene-based aerogels with freeze-drying method and reveal an interconnected, porous 3D framework with continuous macro pores (pore size of larger than 50 nm) in the micrometer size to tens of micrometer range.Reference Wu, Yang, Sun, Parvez, Feng and Müllen26,Reference Zhang, Sui, Xu, Yue, Luo, Zhan and Liu32,Reference Li, Li, Meng, Xie, Zhang, Li, Ma, Zhang and Yu33 A closer observation from the inset of Fig. 3(b) showed that the surface of activated carbon was covered by the randomly intertwisted sheet-like graphene. The unfavorable restacking of graphene monolayers is successfully prevented during the hydrothermal process through the π–π interactions. The connection between graphene monolayers favors the graphene aerogel to form a porous structure and creates a high surface area. Abundant mesopores (pore size of 2–50 nm) and even micropores (pore size of less than 2 nm) were produced in these sheet-like structures. With further decreasing of the mass loading of activated carbon (GA/AC = 2:1), rGO monolayers stacked densely and covered most of the surface area of the AC particles, as showed in Fig. 3(c). Individual activated carbon was hardly observed compared to those of bare AC and GA/AC (1:3). These material spectra and microscopic observations help us recognize the structural differences of bare AC and GA/AC composites. Meanwhile, the morphological and structural differences between plain AC and GA/AC composites at different weight ratios may determine the electro-catalytic performance to the oxygen reduction reaction.
Schematic illustration showing the (a) XRD pattern of the GA–AC composite and (b) Raman spectrum of plain AC and the GA–AC composite. Squares in (a) represent the diffraction peaks corresponding to the Al sample holder. These diffraction peaks, respectively, are 38.3°, 43.4°, and 44.6°. In (b), two characteristic peaks (D and G) from the Raman spectrum are labeled.
SEM images showing the surface morphology of (a) plain AC; (b) GA/AC (1:3); and (c) GA/AC (2:1). Scale bars are 5 μm. Arrow in (a) is highlighted as the activated carbon particle. The arrow in (b) is highlighted as the reduced graphene oxide, and the inset shows the magnification of graphene monolayers on the surface of the activated carbon. The scale bar is 2 μm.

B. Catalytic activity and kinetics
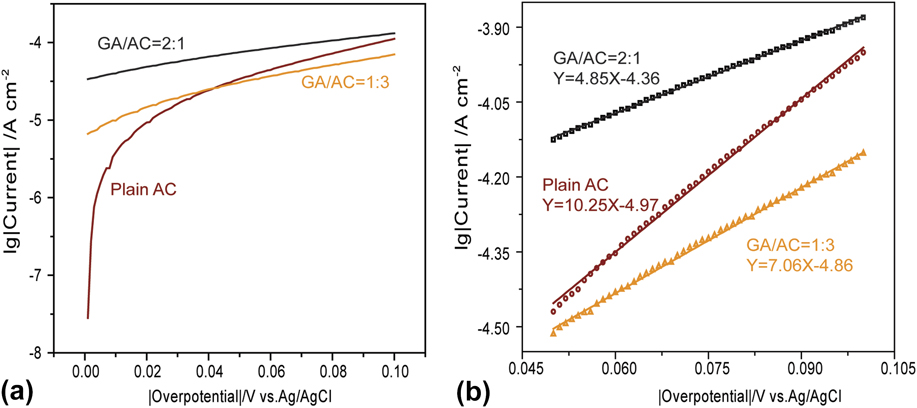
To evaluate the reaction rate and activation energy for the ORR process, further electrochemical measurements were carried out in the neutral solution. As showed in Fig. 4(a), the Tafel test described the dependence of the current density generated through an electrochemical reaction on the applied overpotential. The linear Tafel regression existed in the overpotential interval of 50–100 mV (R 2 > 99%). Based on the Tafel equation and intercept of linear range [Fig. 4(b)], the exchange current density (i.e., the current density in the absence of net electrolysis at zero overpotential) could be specifically calculated.Reference Lv, Li, Wang, Mei, Feng, Chen and Chen34 GA/AC at the ratio of 2:1 showed the highest exchange current density of 4.37 × 10⁻⁵ A/cm2, which was four times higher than that of plain AC (1.07 × 10⁻⁵ A/cm2). The value of current densities is always used to estimate the intrinsic rates of electron transfer at the interface of electrolytes and electrodes, and provide insights into the electrode structure and reaction dynamics.Reference Marcus35,Reference Fang and Liu36 A high value of exchange current density suggests that a large number of electrons are generated and transferred on the surface of the GA/AC catalyst at a zero overpotential. Although the graphitization of the synthesized GA/AC composite is not much higher than that of plain AC [Fig. 2(b)], profiles of the Tafel test surprisingly indicate that the GA/AC catalyst favors the ORR process.
(a) Tafel plots of the different electrodes obtained in 50 mM PBS (pH ≈ 6.8) at a scan rate of 1 mV/s; (b) the linear fit for the Tafel plots at the overpotential from 0.05 to 0.1 V. Symbols in (b) are the experimental data, and the lines are fitting plots. Fitting formulas are drawn near the fitting plots.

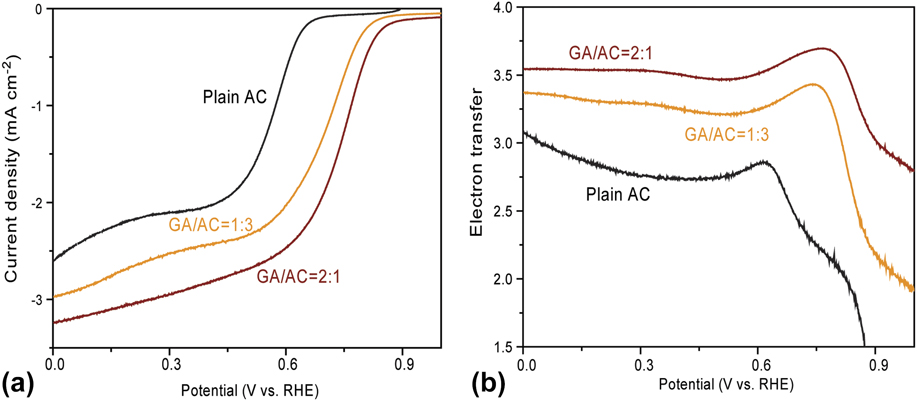
To quantify the ORR catalytic process, the RRDE technique was then used in a 50 mM O2-saturated PBS. Figure 5 showed the disk current and the number of transferred electrons as a function of the electrode potential at a rotation speed of 1600 rpm. For all three cases, significant reduction currents can be observed at sufficiently high potentials indicating an efficient electro-catalytic activity toward the ORR process. However, the potential to trigger the generation of the reduction current was totally different. For a pure AC catalyst, the onset potential was identified at around +0.68 V versus RHE in the O2-saturated phosphate buffer solution, and for the GA/AC composite, it was more positive at +0.83 V (1:3) and +0.88 V (2:1). The mass loading of AC in GA/AC composites had little influence on the onset potential in our study. In addition, the limiting current densities (i.e., the current density at zero potential) were significantly increased from −2.6 to −3.25 mA/cm2, as compared to bare AC. Both a more positive onset potential and a higher limiting current density demonstrate that the catalytic activity of the GA/AC composite outperforms those of AC alone.Reference Yang, Li, Ye, Zhu and Liao37,Reference Lefèvre, Proietti, Jaouen and Dodelet38 The pronounced current and the positively shifted onset potential illustrate that a low potential bias is needed to trigger the ORR for the sample of the GA/AC composite. Meanwhile, the GA/AC composites deliver a much higher current at the zero bias than that of bare AC. These properties can contribute to the improvement of the overall catalytic efficiency.
(a) Current–potential curves of catalyst inks of plain AC, GA/AC (1:3), and GA/AC (2:1) at 1600 rpm in an oxygen-saturated 50 mM solution; (b) Plots of the number of transferred electrons calculated from the RRDE voltammograms. All applied potentials were referred to the reversible hydrogen electrode (RHE). A high rotation speed of 1600 rpm was chosen to avoid the issue of oxygen diffusion-limitation to the electrode.

During the ORR process, oxygen can be catalyzed to HO2− or H2O2 in a two-electron pathway and H2O in a four-electron pathway. The two-electron pathway is more unfavorable due to its high over potential to hydrogen peroxide production. A good non-Pt ORR catalyst should follow the four-electron pathway as closely as possible.
The four-electron electro-reduction of the oxygen pathway is showed as follows:
 $${{\rm{O}}_2} + 4{{\rm{H}}^ + } + 4{{\rm{e}}^ - } \to {{\rm{H}}_2}{\rm{O}}\quad {\rm{.}}$$
The two-electron electro-reduction of the oxygen pathway is showed as follows:
 $${{\rm{O}}_2} + 2{{\rm{H}}^ + } + 2{{\rm{e}}^ - } \to {{\rm{H}}_2}{{\rm{O}}_2}\quad .$$
The number of transferred electrons during electro-catalysis could be estimated based on the deformation Tafel equation, given as follows:
 $$\lg \left| j \right| = \lg {j_0} + \left( {{{\beta nF} \mathord{\left/ {\vphantom {{\beta nF} {2.303RT}}} \right. \kern-\nulldelimiterspace} {2.303RT}}} \right)\left| \eta \right|\quad ,$$
Where j is the logarithm current density, η is the overpotential, T is the absolute temperature, R is the universal gas constant, F is the Faraday constant, β is the symmetry factor, and n is the number of transferred electrons. Corresponding to the Tafel plot [Fig. 4(a)], the slope is βnF/2.303RT, and the number of transferred electrons can be calculated from the slope. But the factor β is pH-dependent and variable, and usually causes a large calculative deviation of the electron transfer number.Reference Zhang, Xia, Ivanov, Huang and Logan21 To accurately explore the process of the oxygen reduction reaction, the number of transferred electrons and the yield of peroxide (%HO2−) at a rotating speed of 1600 rpm were estimated based on the ratio of the ring current (I R) and disk current (I D).Reference Yang, Liu, Liao, Ye, Zhu, Li, Zhang, Peng, Chen and Li31 The number of transferred electrons was calculated by the following equation:
 $$n = {{4{I_{\rm{D}}}} \over {\left( {{I_{\rm{D}}} + {{{I_{\rm{R}}}} \over N}} \right)}}\quad .$$
The yield of peroxide (%HO2−) was calculated by the following equation:
 $$\% \left( {{\rm{H}}{{\rm{O}}_{\rm{2}}}^ - } \right) = 200 \times {{{{{I_{\rm{R}}}} \mathord{\left/ {\vphantom {{{I_{\rm{R}}}} N}} \right. \kern-\nulldelimiterspace} N}} \over {\left( {{{{I_{\rm{D}}} + {I_{\rm{R}}}} \mathord{\left/ {\vphantom {{{I_{\rm{D}}} + {I_{\rm{R}}}} N}} \right. \kern-\nulldelimiterspace} N}} \right)}}\quad ,$$
Where I R is the faradic ring current, I D is the faradic disk current, and N is the collection efficiency of the testing system (37%).Reference Liu, Song and Chen30,Reference Yang, Liu, Liao, Ye, Zhu, Li, Zhang, Peng, Chen and Li31
It was notable that for plain AC, n increased from 1.50 to 2.85 with the applied potential swept from +0.87 to +0.6 V and finally reached 3.09 at 0 V, as showed in Fig. 5(b). While for GA/AC composites, n increased much more drastically and reached 3.25 and 3.52 at the weight ratio of 3:1 and 1:2, respectively. Based on the ratio of I R and I D, the fractions of peroxide species were calculated to be 31.4 and 22.5% at the weight ratio of 3:1 and 1:2, which were below AC alone (38.9%). It means at the GA/AC composite, the oxygen could be effectively reduced to OH− (n = 4) rather than H2O2 (n = 2). These results are clearly in accordance with the previous Tafel test which states that the GA/AC catalyst has a much greater exchange current density than that of AC alone. It is also consistent with the tendency of the onset potential and limiting currents from Fig. 5(a). Associated with the morphological difference between the GA/AC composite and plain AC, the boosted catalytic properties may be related to the optimized microstructure.
C. Pore-structure analysis of the carbon powders
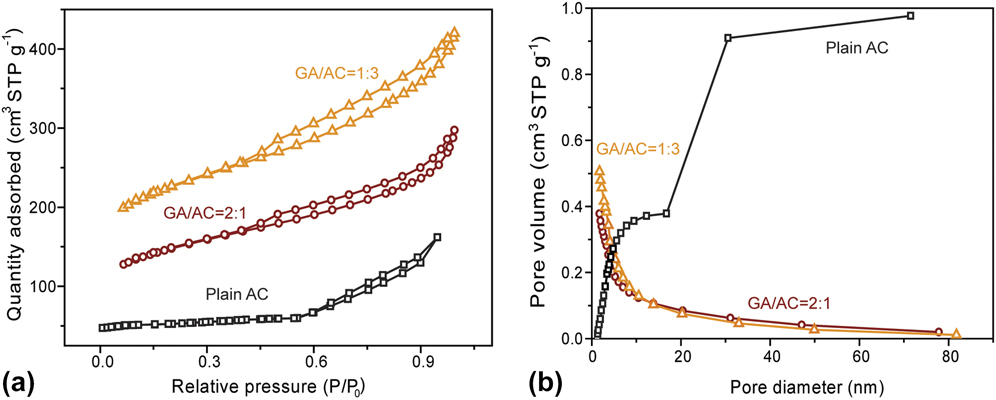
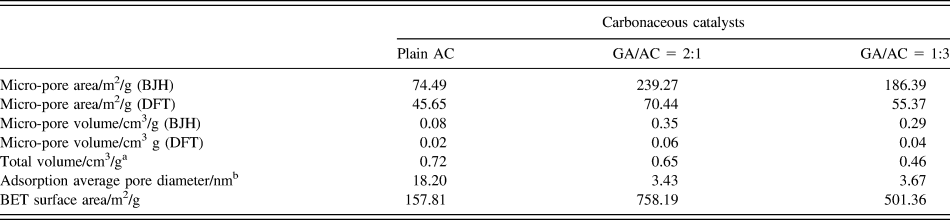
The 3D structure of the GA/AC composites was previously confirmed by scanning electron microscopes. It depicts that the porosity of GA/AC and bare AC is totally different. To prove the hypothesis that the optimized microscopic structure benefits the boosted ORR catalytic properties in the GA/AC composite, nitrogen physisorption measurements were performed to analyze the pore structure and specific surface area. As showed in Fig. 6(a), type-IV isotherms were collected for three samples and all of them were implied to the amorphous carbon and mesoporous structure.Reference Puthiaraj and Pitchumani39 In the samples of the GA/AC composites, a steep increase could be observed in the N2 absorption/desorption curves at both P/P 0 < 0.2 and higher P/P 0 (0.3–0.6). For bare AC, no obvious increase at low P/P 0 was collected from the profile of the nitrogen physisorption isotherm. It indicates the existence of a large number of micropores and mesopores in the aerogel composites.Reference Zhao, Lai, Lyu, Jiang, Xie, Wang, Wu, Yang, Jin and Ma40,Reference Zhang, Liu, Li, Yu, Luo, Tong and Li41 The pore-size distribution was plotted according to the desorption model as a function of the cumulative pore-volume and was showed in Fig. 6(b). The shape in the curves of plain AC and GA/AC composites was totally different. The cumulative-pore volume increased with increasing of the pore diameter for the case of plain AC. Since the pore diameter–volume curve was totally determined by the physical properties of carbonaceous catalysts, it demonstrated that the large-sized pores dominated the pore distribution in the plain AC case. For GA/AC composites, most of the pore diameters lie in the range less than 20 nm, and only a small number of macro-sized pores could be detected by this technique. Table I specifically summarized the pore-structural parameters of the plain AC and GA/AC composites calculated from the N2 absorption/desorption isotherms. The micropore volume and area were computationally simulated based on the BJH and DFT models. Plain AC had the highest total pore volume of 0.72 cm3/g, which was higher than that of the GA/AC composites (0.65 cm3/g at 2:1 and 0.46 cm3/g at 1:3). With the respect to pore-size distribution, much larger pores dominated the bare AC than the GA/AC composites. The adsorption average pore diameter for bare AC was 18.20 nm, which was 5.31-folds and 4.96-folds higher than that of GA/AC aerogels (3.43 nm at 2:1 and 3.67 nm at 1:3). In the case of the BJH desorption simulation model, only 0.08 cm3/g of micropores could be detected for plain AC. Correspondingly, much more small-sized pores were apparently founded in the graphene/activated carbon aerogels. The volume of micropores was 0.29 cm3/g at the weight ratio of 1:3 and was increased to 0.35 cm3/g when high mass of graphene was blended on the surface of the activated carbon (2:1). Meanwhile, the BJH micropore area of 239.27 m2/g for GA/AC (2:1) was 1.28-folds higher than that of the less graphene-blended area. It illustrates that the micropores are mainly stemming from the graphene monolayers. Therefore, the pore-size distribution is totally different for the plain AC and GA/AC composite although both catalysts show a mesoporous structure. The type of pores and the distance between the two pores have a crucial impact on the number of formed catalytic sites and reactants transportation. Previous reports suggest that micro pores hosted most of the catalytic sites,Reference Lefèvre, Proietti, Jaouen and Dodelet38,Reference Jaouen, Lefèvre, Dodelet and Cai42 and the catalytic activity could be boosted with increasing of the micro-pore area and number of micro pores.Reference Jaouen, Marcotte, Dodelet and Lindbergh43 For these small-diameter pores, they could serve as the active sites of the reaction and accommodate the molecular reactants (e.g., protons). The distance between the two neighboring pores should have an exact value for the formation of active sites. For the large-sized open pores, they supply interconnected channels to transfer the dissolved oxygen and water. A reasonable distribution of various sized pores was established in the GA/AC composite and could effectively facilitate the ORR process.Reference Guo, Shibuya, Akiba, Saji, Kondo and Nakamura44,Reference Lai, Potts, Zhan, Wang, Poh, Tang, Gong, Shen, Lin and Ruoff45 Besides the well pore-size distribution, the GA/AC composites also exhibited an ultrahigh BET surface area of 500–750 m2/g, which was considerably larger than that of plain AC (∼150 m2/g). The highest surface area of 758.19 m2/g is even more larger than that of the reported porous carbon, such as 190 m2/g for ordered mesoporous carbon nitrides,Reference Wang, Blechert and Antonietti46 510 m2/g for nitrogen-doped graphitic arrays,Reference Liu, Wu, Feng and Müllen47 and 597 m2/g for g-C3N4/C.Reference Liang, Zheng, Chen, Liu, Hulicova-Jurcakova, Jaroniec and Qiao48 Both the large surface areas and well-distributed anchoring sites for oxygen reactants are offered by the unique 3D structure from aerogel and graphene characteristics. It enables the full use of the catalyst particles on the whole contact area of the GA/AC composites.Reference Matter, Zhang and Ozkan49,Reference Mao, Wen, Huang, Hou and Chen50 All these porous structures and surface areas led to a much enhanced ORR activity of the GA/AC composites as compared to that of bare AC.
(a) N2 adsorption/desorption isotherms collected at 77.3 K; (b) Plots of pore diameter as a function of the incremental pore volume calculated based on the BJH desorption model. The detection range of pore-diameters lied in 0–90 nm.

Pore-structural characteristics of different carbonaceous catalysts.

a The total pore volume referred to the pore with the width less than 365.5 nm at P/P 0 = 0.99.
b The adsorption average pore width was calculated by 4V/A by BET. V was the pore volume and A was the pore surface area.
D. Electrodes performance
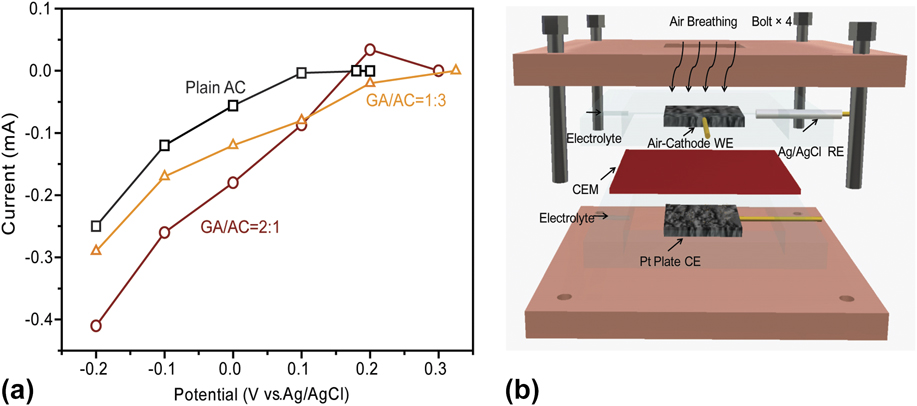
To evaluate the performance of GA/AC composites, the properties of catalysts were further investigated through constructing home-assembled air-breathing cathodes. The concentration of oxygen in the air is 10 mM compared to the typical values in the aqueous media of 2–4 mM. A high saturation and diffusivity of the oxygen in the air favors the mass transfer at the cathode side. Furthermore, the air-breathing electrodes with a gas diffusion layer avoid the need of an external oxidant reservoir and substantially simplify the device construction. Therefore, compared with the aqueous oxygen, the development practices for the FC technology prefer to tap the gaseous oxygen in the air to form the air-breathing cathodes.Reference Bidault, Brett, Middleton and Brandon51,Reference Neburchilov, Wang, Martin and Qu52 The carbon paper was served as the support and current collector. Carbon fiber in the carbon paper has a proper size in microstructure, which is favorable for oxygen transfer and the supporting catalyst.Reference Li, Cheng and Thomas53 A diffusion layer treated by the PTFE solution was added to the other side of the carbon paper to facilitate the oxygen diffusion and prevent leakage.Reference Zhang, Xia, Ivanov, Huang and Logan21 All electrodes were measured using the same electrolytic device [Fig. 7(b)] to eliminate the possible discrepancy due to the device assemble. The air-cathode was firstly operated in an open circuit mode to reach a stable state and then applied by different voltages (0.2, 0.1, 0, −0.1, and −0.2 V) in a stepwise manner. As showed in Fig. 7(a), the value of open circuit potential (OCP) was 0.195 V in the case of plain AC, which was close to the first point of the stepwise applied potential (0.2 V). The output current at 0.2 V is nearly equal to zero. The GA/AC electrodes showed an OCP value of 0.3 V, which was 50% higher than that of plain AC. Considering with the same counter electrode, the difference in OCP is believed to be caused by the air-cathode (i.e., working electrode). A higher OCP illustrated that the GA/AC catalysts had a much greater electrochemical activity toward the ORR.Reference Liu, Li, Zhang, Ge and Pu54 The output current varied continually with changing the applied potentials in the working electrodes. At each potential step, GA/AC electrodes delivered a substantially higher current than that of air-cathode equipped with bare AC. It was in the same order as in the collected disk current density in the RRDE tests. At a potential of −0.2 V, the GA/AC (2:1) air-cathode delivered a maximum current of −0.41 mA, and adding more AC (1:3) induced the deterioration in performance (−0.29 mA). The results agreed with the observation of the RRDE analyses in dissolved oxygen, which emphasize the crucial role of abundant micropores from graphene monolayers on the ORR process. It indicates that the catalysts are suitable for oxygen transfer in both gaseous and aqueous media.
(a) Current–potential curves of plain AC, GA/AC (1:3), and GA/AC (2:1) assembled electrodes collected in 50 mM PBS solution; (b) The home-assembled testing device. Abbreviations in (b): WE, working electrode; RE, reference electrode; CEM, cation exchange membrane; CE, counter electrode.

Significantly, the mass density of GA/AC with high porosity is measured to be 20-times lighter than that of plain AC in the air-cathode. It means that the weight of the electrodes could be largely reduced at the same working area. On one hand, the low-mass density catalyst and its 3D porous structure can favor the permeability of oxygen and water in the electrodes and boost the performance of air-cathodes. On the other hand, the complexity of fuel cell fabrication will be lowered by using the lightweight electrode. These properties are particularly important for fuel cell applications in aerospace, spacecraft power systems, wearable electronics, and portable devices.
IV. CONCLUSIONS
In summary, we successfully synthesized a new GA/AC composite via a facile one-step hydrothermal method. The 3D graphene network emerged in this work to lower the mass loading of AC and facilitate the electron transfer in the interior area of the catalyst. At the same mass loading, the GA/AC composite outperformed bare AC in terms of onset potential, current density, and number of transferred electrons. The onset potential shifted positively from 0.68 to 0.83 V, and the number of electrons transferred was increased from 2.85 to 3.52, indicating that the four-electron pathway dominated the ORR process. The limiting current densities at zero potential increased significantly from −2.6 to −3.25 mA/cm2 compared to bare AC. In general, the high specific surface area, reasonably porous structure, and size of catalysts were considered to be responsible for the improved ORR activity.
More importantly, the mass density of our synthesized GA/AC is obviously lighter than that of plain AC. The present synthesis process can be easily scaled up for mass production especially when graphene is now commercially available in massive amounts. As a result of the excellent integrated properties, the aligned porous GA/AC aerogel offers promising applications in lightweight catalysts. Based on this type of catalysts, it may help pave the way to design fully carbonaceous ORR catalysts and fabricate ultralight air-cathodes in FCs and even in metal-air batteries. It is highly desirable to develop these lightweight energy storage/conversion systems that have an excellent electrochemical performance to meet the needs of the development of multifunctional portable or even flexible electronics. The future direction is to synthesize a heteroatom (N, B, P, S)-doped fully with graphene aerogel to further boost the catalytic properties per unit mass along with a fast reduction in the cost of graphene.
ACKNOWLEDGMENTS
This work is supported by the National Natural Science Foundation of China (No. 51706184, No. 51506046), Shaanxi Science and Technology Co-ordination and Innovation Project (2016KTCQ01-48), and the Fundamental Research Funds for the Central Universities (3102017OQD011). Y.Y. thanks the China Scholarship Council for financial support. We thank Dr. Tianyu Liu from UC Santa Cruz for guide of graphene aerogel synthesis and Yi Peng for kindly discussing the RRDE measurements. We acknowledge Mingyang Li from Sun-Yat Sen University for the help of N2 adsorption/desorption measurement and acknowledge Jesse Hauser and Jorge Jimenez from UC Santa Cruz for their kind assistance in XRD measurements (supported by the U.S. NSF MRI grant, MRI-1126845). We also thank Dr. Tom Yuzvinsky from UC Santa Cruz for SEM images acquisition and acknowledge the W.M. Keck Center for Nanoscale Optofluidics for use of the FEI Quanta 3D Dual-beam scanning electron microscope.