Among the many factors that fuel inequalities in US social welfare policies, American federalism looms large (Campbell Reference Campbell2014; Kettl Reference Kettl2020; Mettler Reference Mettler1998; Michener Reference Michener2018; Soss, Fording, and Schram Reference Soss, Fording and Schram2008). This is not unique to the United States: global critiques of federalism document its ineffective and unequal service delivery (Beramendi, Rogers, and Diaz-Cayeros Reference Beramendi, Rogers and Diaz-Cayeros2017). Centralization offers a potential antidote to subnational inequalities endemic in federalism, notably when it strives to bolster public bureaucracies’ capacities to address social problems. Centralization, however, also poses risks: keeping the central government in check constitutes a key purpose of federalism’s structural safeguards (Bednar Reference Bednar2009) and has been a durable part of debates in the United States over the balance of power (Kettl Reference Kettl2020). Centralization, moreover, risks eroding subnational organizational capacity, which combines resources, reach, technical expertise, and administrative coherence.Footnote 1 Subnational organizational capacity is important both to the formation of federalist systems (Ziblatt Reference Ziblatt2004) and to their operation (Manna Reference Manna2006). Expanding the reach of the central government to remedy subnational inequalities continues to fuel debate over whether such expansion is zero-sum: Does centralization erode or instead augment subnational organizational capacity (Cohen Reference Cohen1982)?Footnote 2
In this article, we put this enduring puzzle to a novel empirical test and offer three contributions to this ongoing debate. First, we focus our analysis on the implications of centralization for the “quality of bureaucracy” (Centeno, Kohli, and Yashar Reference Centeno, Kohli and Yashar2017, 5–6), with particular emphasis on investments in public bureaucracy. To do so, we distinguish between two key forms of organizational capacity: technical capacity and administrative capacity (Moffitt et al. Reference Moffitt, Lyddon, Morel, O’Neill, Smith, Willse and Cohen2018). Technical capacity includes the knowledge and know-how to perform core tasks. Administrative capacity entails coordination and oversight mechanisms. Although these two forms of organizational capacity are integral to state-building (Skowronek Reference Skowronek1982), assessing them separately allows us to discern whether and how the implications of centralization depend on prior investments in subnational capacity.
Second, we examine the implications of centralization on high-resourced and underresourced areas to assess the persistence of subnational inequalities. Remedying subnational inequalities constitutes a chief justification for greater centralization. Yet, some centralizing policies can exacerbate underlying resource disparities (Howell and Magazinnik Reference Howell and Magazinnik2020). Third, we assess the durability of centralization’s implications for subnational capacity by considering the repercussions of the 2008 recession’s economic shock and the potential for serious economic upheaval to undermine capacity. Examining both geographic variation and the post-recession period reveals the extent of the central government’s reach and offers insights on disruptions posed by COVID-19 and the 2020 economic recession.
We argue that the implications of centralization depend on two aspects of path dependence. One aspect focuses on the prior development of subnational organizational capacity. If centralization is zero-sum, we expect it to manifest in dimensions of organizational capacity that subnational entities had previously developed. We find that greater centralization coincided with disruptions to established subnational capacity (administrative capacity). A second aspect of path dependence focuses on prior privilege. If centralization augments subnational capacity, better-resourced areas might be better positioned to capitalize on new capacity. We find that centralization does augment capacity in areas of prior subnational weakness (technical capacity). Centralization, however, continues path-dependent processes of privilege: the development of new subnational capacity appears concentrated in low-poverty counties, even in the context of a major US federal policy that was designed with explicit antipoverty purposes.
We assess this argument through the lens of the No Child Left Behind Act (NCLB), which was well known for extending the reach of the federal government into US public schools, and consider its implications for investments in subnational organizational capacity and inequality in public education. We begin with an historical analysis that draws on archival material from the Department of Education in the State of New York. We then use interrupted time series analysis (ITSA)—commonly used to explore temporal discontinuities when randomization is not possible—to assess the implications of centralization on investments in subnational administrative and technical bureaucratic capacity following NCLB. Because durability is essential to federalist systems’ operations, this approach allows us to test the fragility of subnational capacity in the wake of national volatility arising from the recession of 2008. We marshal a novel dataset drawn from the Common Core of Data’s Local Education Agency Universe Survey Data from 1997 to 2015 for all 50 states. For each of our models, we compare high- and low-poverty counties to explore variation in capacity across socioeconomic status.
We examine our argument on centralization and investments in subnational bureaucracy in federalist systems in the context of NCLB for several reasons. We focus on public education, in part, because education is an enduring and central component of the US welfare state (Katznelson and Weir Reference Katznelson and Weir1985). Public education stands as a prime example of an unenumerated power in the Constitution—and thus under states’ jurisdictions—and was one of the first areas in which states’ power began to develop in the United States. It constitutes a significant sector for states’ and localities’ expenditures, and its experiences are salient to a broad array of social policies, including health and income support. We focus on NCLB as a form of centralization, both because it inserted the US federal government into public schooling in forceful ways and because it followed earlier reforms, which allows us to examine whether implications of centralization depend on prior investments. In contrast to prior scholarship that assessed NCLB’s problems improving student achievement, we focus on its implications for organizational capacity. Examining investment in subnational bureaucracy in US public education provides perspective on the challenges that federalist systems face from shocks like COVID-19 and economic recession, given the long-standing neglect of subnational public infrastructure and enduring structural inequality. Greater centralization offers one path forward, but lessons from NCLB underscore the importance of policy design in overcoming path-dependent privilege.
Organizational Capacity: Doing the Work of Federalism
At the heart of Federalist Paper No. 45 resides an argument over the allocation of power and Madison’s assertion that states’ power would not be subsumed by that of the federal government:
“The powers delegated by the proposed Constitution to the federal government are few and defined. Those which are to remain in the State governments are numerous and infinite” (Madison Reference Madison and Rossiter1788).
Concerns about central government overreach and the balance of power between governments are as old as the structure of federalism and remain active across federalist systems and policy domains.Footnote 3 Underlying these debates are concerns about different levels of government engaging in strategic behavior that may exceed their authority or shift cost burdens onto other levels of government, shirk responsibilities, or engage in other forms of intergovernmental opportunism (Bednar Reference Bednar2009; Derthick Reference Derthick1975; Filippov, Ordeshook, and Shvetsova Reference Filippov, Ordeshook and Shvetsova2004; Luigjes and Vandenbroucke Reference Luigjes and Vandenbroucke2020; Posner Reference Posner1998). Opportunism can arise both from the central government and from subnational governments.
Opportunism clearly matters. Yet, focusing exclusively on opportunism risks obscuring the importance of capacity. Rather than opportunism, fundamental problems of bureaucratic overload—insufficient capacity to perform core tasks—impair subnational governments’ abilities to deliver services (Dasgupta and Kapur Reference Dasgupta and Kapur2020). The absence of bureaucratic capacity, moreover, can interfere with efforts to engage in effective oversight (Huber and McCarty Reference Huber and McCarty2004). Lacking basic bureaucratic capacity reduces the likely effectiveness of laws and procedures designed to mitigate opportunism.
Capacity problems loom large in federalist systems. Although geographically prevalent and celebrated for their normative potential (Levy Reference Levy2007), federalist systems struggle to deliver on their promise of greater efficiency and democratic responsiveness (Beramendi Reference Beramendi, Boix and Stokes2007). Not only do subnational governments struggle to deliver services to citizens and to do so equitably (Beramendi, Rogers, and Diaz-Cayeros Reference Beramendi, Rogers and Diaz-Cayeros2017) but subnational fiscal ineptitude can also yield reverberating consequences that threaten a country’s financial health. Subnational overspending and reliance on the central government for bailouts constitute key considerations in fiscal federalism (Rodden Reference Rodden2005; Wibbels Reference Wibbels2012). Capacity problems can also emerge through the economic and administrative burdens that central governments impose on subnational governments via unfunded mandates (Imazeki and Reschovsky Reference Imazeki and Reschovsky2004; Posner Reference Posner1998).
Centralization manifests as a common proposal to discourage subnational overspending (Rodden Reference Rodden2005; Wibbels Reference Wibbels2012) and to redress inequalities in subnational service delivery (Campbell Reference Campbell2014; Kettl Reference Kettl2020; Mettler Reference Mettler1998). Yet, centralization evokes debate over when such expansion is zero-sum—when the growth of the central government diminishes subnational capacity (Derthick Reference Derthick, Wittes and Nivola2015; Leach Reference Leach1970, 2)—and when central government growth can instead be positive-sum and expand capacity in multiple venues and levels of government simultaneously (Cohen Reference Cohen1982, 477).
Calls for greater centralization typically assume that it will yield “infrastructural power,” meaning “the capacity of the state to actually penetrate civil society, and to implement logistically political decisions throughout the realm” (Mann Reference Mann1984, 189). Yet, infrastructural power is not just a matter of a strong central government: infrastructural capacity is also about doing the work of governance. In federations, the central government depends on the capacity of subnational governments. As Ziblatt (Reference Ziblatt2004, 96) reminds us, “The key challenge to creating federalism is not simply constraining the power of a political center; instead, what’s important is the task of building up infrastructural capacity of subunits to do the work of governance in a federation.”Footnote 4
What does it take for subunits to have the capacity to do the work of governance in a federation? We focus here on organizational capacity, with its roots in classic public bureaucracy (Weber Reference Weber, Gerth and Mills1946, 196). Specifically, we address two aspects of organizational capacity: technical capacity and administrative capacity. Technical capacity includes knowledge and know-how, along with the responsibility to put ideas into practice. To do the work of governance, component parts need technical know-how, such as the scientific knowledge to understand how infectious disease spreads through communities.Footnote 5 Administrative capacity includes connections and oversight between constituent and collaborative units needed to put ideas into practice, such as distributing relief funds to eligible organizations.Footnote 6 To do the work of governance, component parts in a federation need ways to coordinate, collaborate, and oversee governance operations. We focus on investments in these two forms of capacity both because of their distinct conceptual contribution to organizational capacity and because they have the potential to develop along separate trajectories.Footnote 7
What are the implications of centralization for the capacity of subnational units to do the work of governance? They depend, we argue, on what was in place before. Conditional on prior development, centralization dynamics could be zero-sum, redistributive positive-sum, or path-dependent positive-sum, each of which yields different expected implications for subnational organizational capacity. When centralization is zero-sum, it would erode previously established capacity, particularly in areas where subnational capacity is strong.Footnote 8 Centralization, however, could yield positive-sum returns for subnational capacity and could do so in at least two ways (López-Santana Reference López-Santana2015). The central government might expand in domains where subnational capacity has not developed or is underdeveloped. Proponents of expanding the US federal government in the 1960s in policy domains such as health (through Medicaid) or early childhood development (through Head Start), for instance, sought to remedy weak subnational capacity (Cohen et al. Reference Cohen, Colby, Walloo and Zelizar2015; Karch Reference Karch2013). This form of positive-sum centralization could thus be redistributive: building subnational capacity in domains where it did not previously exist, especially in underresourced areas.
A second form of positive-sum centralization, however, could build on underlying path dependence. Instead of a strong central government redressing the weaknesses of subnational units, a weak central government can “borrow” the strength of subnational units to accomplish national goals (Manna Reference Manna2006). Thus, also consistent with increasing returns, an expanding central government could further augment previously established subnational capacity.Footnote 9 Table 1 summarizes our expectations of the implications that centralization might have on subnational capacity, depending on the extent of previously established subnational organizational capacity.
Implications of Centralization

Our approach flips the conventional inquiry from models of decentralization (Falleti Reference Falleti2005; Hooghe and Marks Reference Hooghe and Marks2003) to a model of centralization, though we expect a core insight from theories of decentralization to extend to our analysis of centralization: centralization in federalist systems is neither unidimensional nor linear (López-Santana Reference López-Santana2015).Footnote 10 The implications of centralization depend on prior development in organizational capacity. Moreover, centralizing policy designs can yield both zero-sum and positive-sum implications for organizational capacity.Footnote 11
We examine the implications of centralization for organizational capacity and investments in subnational bureaucracy in the context of early twenty-first-century public education in the United States.Footnote 12 US public education resides solidly within states’ jurisdictions and vividly embodies decentralization.Footnote 13 However, twenty-first-century US public education also reflects prior efforts to expand the federal role in education, and it provides variation in previously developed and weakly developed subnational capacity. The experiences from public education offer lessons for other components of the welfare state, especially in the COVID-19 era as the United States and other countries take stock of how to strengthen subnational organizational capacity across unequal contexts.
US Public Education, Subnational Organizational Capacity, and Centralization
Decentralization has long defined American public education. Schooling was highly decentralized throughout the nineteenth century and was built on prior private schools and local initiatives (Kaestle Reference Kaestle1983). This decentralization manifested clearly in systems of financing public education. At the end of the nineteenth and beginning of the twentieth century, local sources such as property taxes accounted for fully 80% of public school revenues, with states providing the remaining 20%.Footnote 14 As public schooling expanded throughout the nineteenth and twentieth centuries, its decentralized form persisted both through ideas and organizational structures (Timar Reference Timar1997). States had formal authority over local school operations, but they typically delegated operational decisions to districts. Even states like New York, which were more hierarchical and oversaw districts more closely than other states, embodied organizational decentralization:
It is not believed that the good of the school system is to be promoted by too much inspection; on the other hand, it is felt that local officers and teachers will grow in capacity for school work by doing it independently. It is believed that substantial improvement must come through freedom of local initiative and administration, rather than through too much direction on the part of the state (State of New York 1905, 36).Footnote 15
Although American states and localities have, for centuries, held formal authority over public education, subnational capacity to deliver public instruction has followed distinct trajectories. Notably, administrative capacity (procedural oversight) developed separately from technical capacity (profession-based know-how) to support instruction. As US public education expanded during the early twentieth century, it accumulated layers of school administration and new responsibilities, including requirements for student attendance (Steffes Reference Steffes2012). These administrative developments focused primarily on taxation, revenue disbursement, constructing schools, expanding access to students, and setting required courses of study. They focused much less on the practice of teaching, teacher education, assessing students’ learning (Rice Reference Rice1893), or overseeing the quality of classroom teaching and learning (Murphy Reference Murphy1974).
The evolution of the New York State Department of Education during the early twentieth century helps illuminate how the administrative capacity for public education (i.e., collecting and distributing taxes, building schools, etc.) developed separately from the technical capacity of public education (i.e., ensuring that teachers learned the content they were expected to teach and learned how to teach that content well). New York State had one of the most-developed state departments of education in this era of public schools. If state-level technical capacity to support instruction appeared in any state, it would have likely appeared in New York.Footnote 16
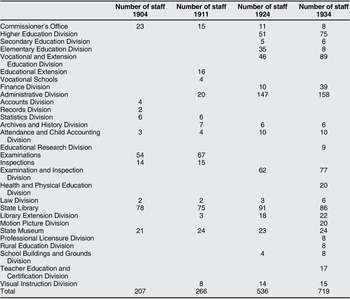
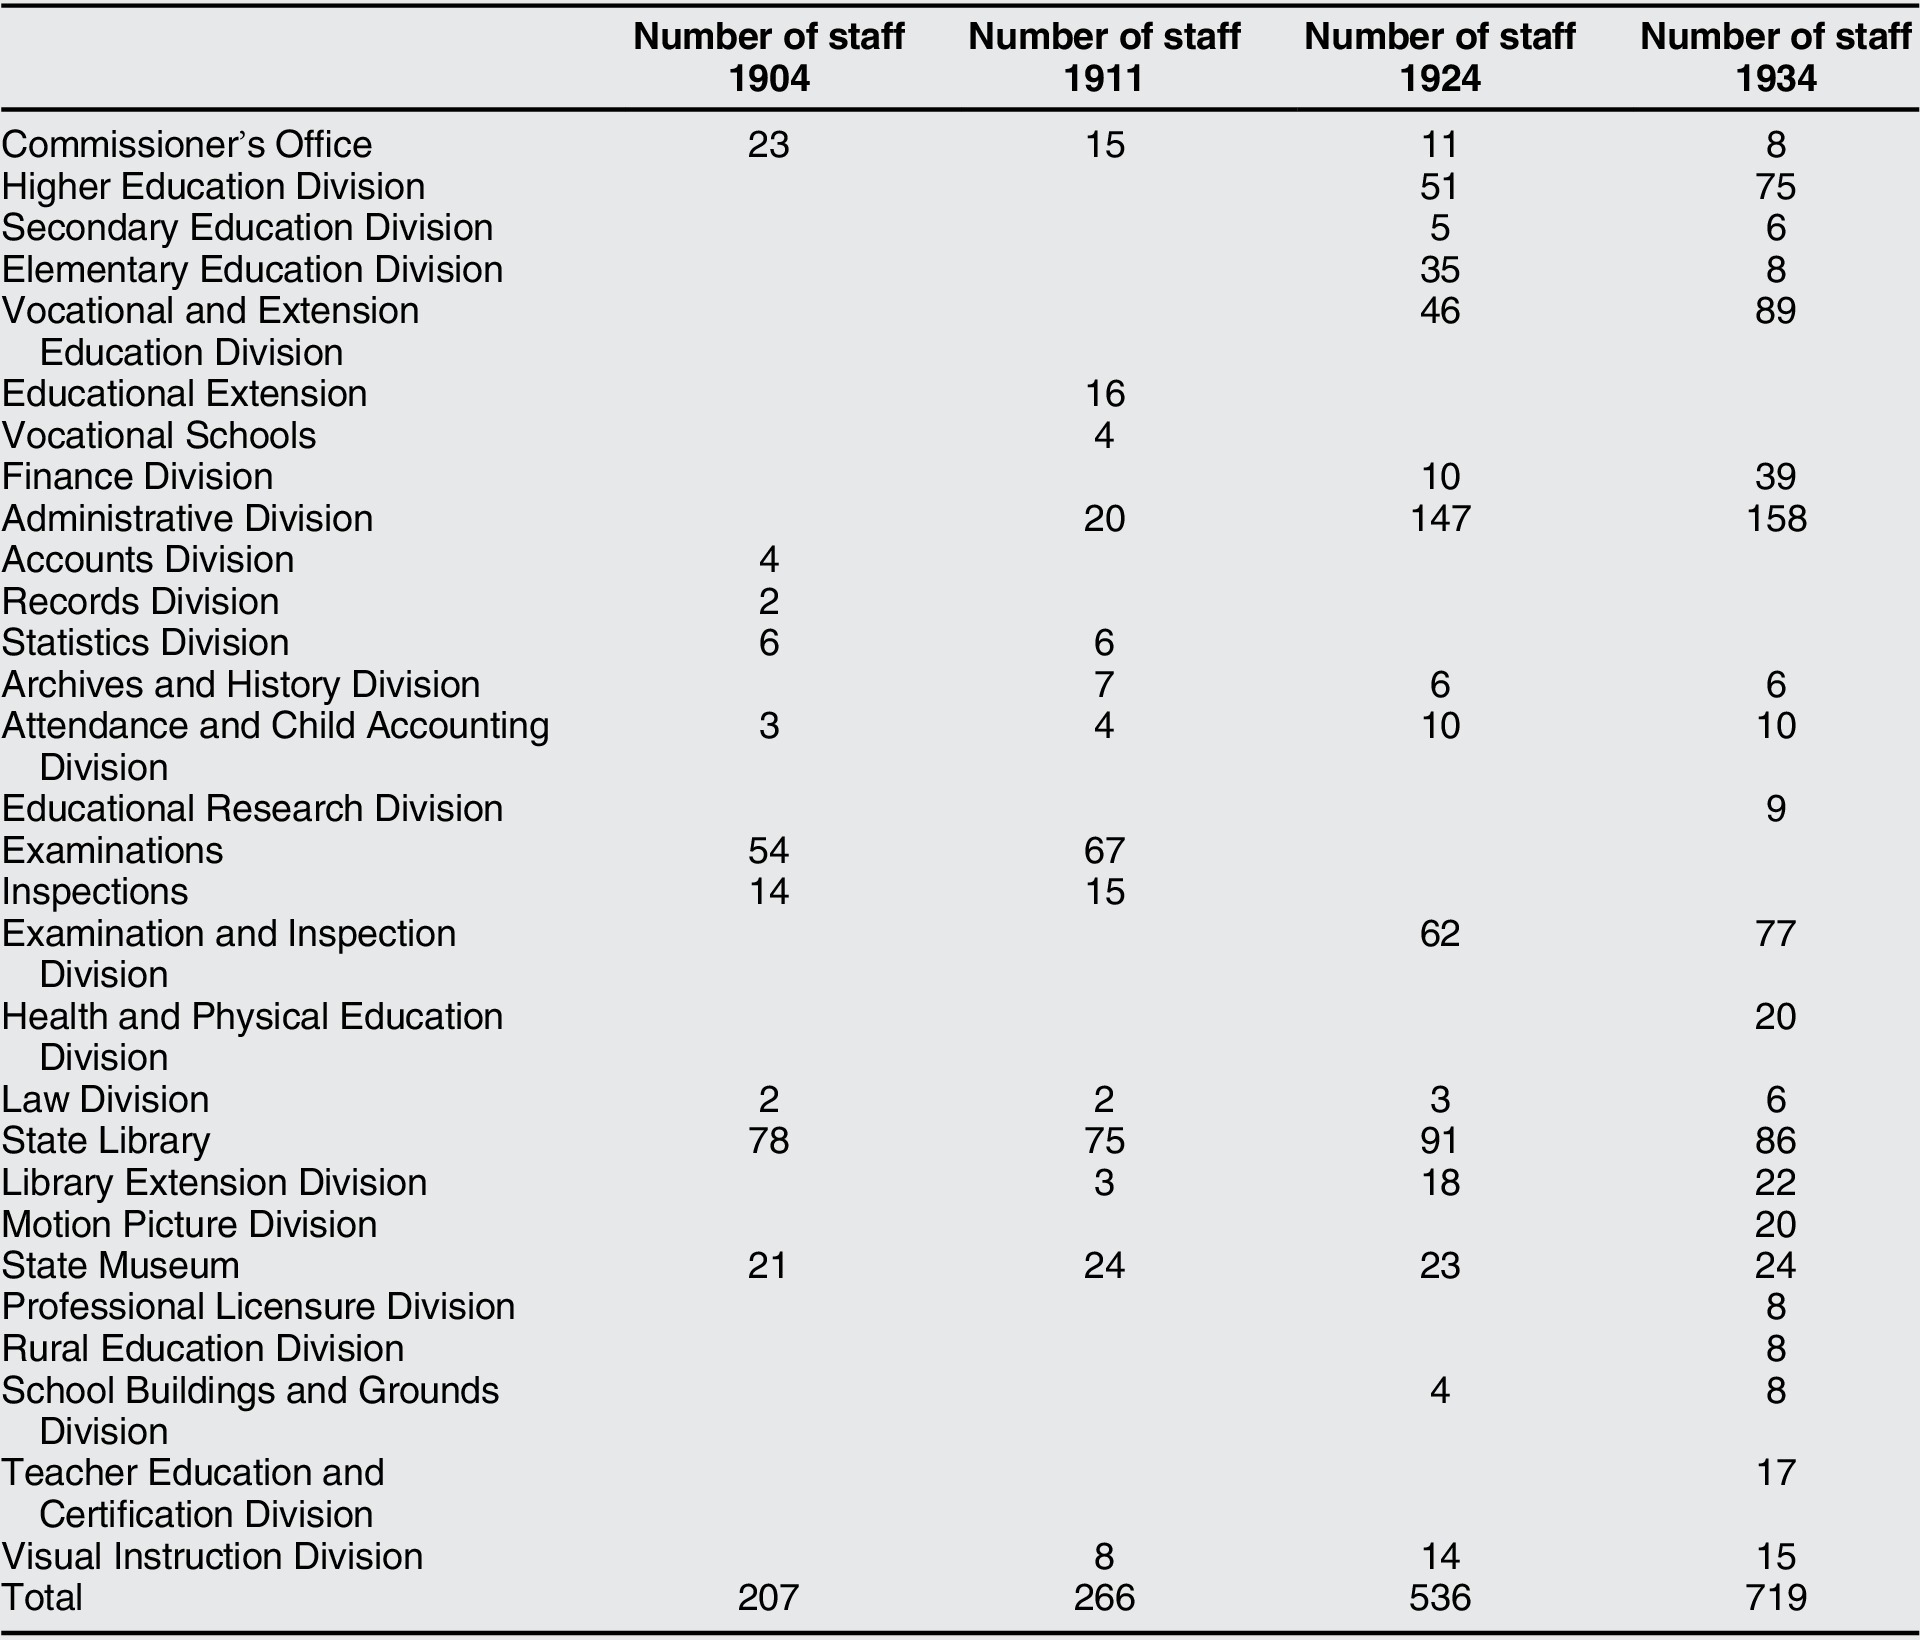
Our archival material depicted in table 2 illustrates the impressive growth of subnational government agencies in the early part of the twentieth century. Footnote 17 Overall, the New York State agency grew from 207 staff members to 719 over the course of 30 years. A significant proportion of this growth involved the development of administrative capacity. We estimate that, in 1934, more than one-quarter of the staff of New York State’s Department of Education focused on administration and finance. In contrast, New York funded only 17 positions—approximately 2% of its staff—during this time period that specifically supported instructional matters such as teacher education and certification.Footnote 18 Although US subnational education agencies looked little like the Weberian ideal, administrative capacity developed more fully than and separately from technical capacity related to teaching and learning.
Subnational control over public education has persisted, but the passage of the 1965 Elementary and Secondary Education Act (ESEA) signaled a notable expansion of federal government involvement in US public education (Bailey and Mosher Reference Bailey and Mosher1968; Cohen and Moffitt Reference Cohen and Moffitt2009; Derthick Reference Derthick, Wittes and Nivola2015; Peterson, Rabe, and Wong Reference Peterson, Rabe and Wong1986). The federal government’s expansion into public education appeared alongside a suite of federal programs aimed at redressing perceived weaknesses and inequities in state and local service delivery during the decade between 1965 and 1975, including health (Cohen et al. Reference Cohen, Colby, Walloo and Zelizar2015), early childhood education (Karch Reference Karch2013), housing (Peterson, Rabe, and Wong Reference Peterson, Rabe and Wong1986), and community development (Derthick Reference Derthick1972). The policies of the Great Society bundled together fiscal inducements with administrative procedures to promote national policy objectives.
In the domain of public education, Title I of the ESEA ushered in new financial resources, imposed a host of requirements on how those resources could be spent, and helped put the disparities in educational resources in US public schools on the national agenda. As one part of the Great Society’s suite of policies, ESEA Title I’s antipoverty purposes helped justify the extension of the federal government into local- and state-controlled schooling.Footnote 19 The 1965 law, however, explicitly prohibited the federal government from specifying curriculum or guiding instruction. The federal, state, and local administrative architecture that developed around ESEA focused on disbursing federal funds and monitoring that they were being used in accordance with federal policy.
Throughout the last half of the twentieth century, however, the ideas guiding the federal role began to move beyond distributing financial resources and toward eliminating the achievement gap that manifests in the United States along socioeconomic, racial, and ethnic lines (McDonnell Reference McDonnell2005). Part of this shift in ideas emerged from backlash to the rigid fiscal accounting procedures developed in the early years of ESEA (Peterson, Rabe, and Wong Reference Peterson, Rabe and Wong1986). These fiscal procedures had instructional implications, including pulling students out of conventional classrooms to receive supplemental instruction to create a clean audit trail (Kimbrough and Hill Reference Kimbrough and Hill1981; Peterson, Rabe, and Wong Reference Peterson, Rabe and Wong1986, 141–43). Changes in fiscal compliance procedures to help districts both satisfy auditors and have more pedagogical flexibility began in the 1970s and continued during reauthorizations in the 1980s (Cohen and Moffitt Reference Cohen and Moffitt2009, 77–78, 118–21).
Underlying these programmatic shifts were different ideas about connections between fiscal resources, effective instruction, and school improvement. These ideas pivoted away from expecting federal fiscal transfers to yield achievement gains and toward expectations that different arrangements in instructional practices would be necessary to reduce inequality in student achievement (Purkey and Smith Reference Purkey and Smith1983). With this shift in goals, federal policy began to reach more deeply into school operations and to move closer to instructional content (McDonnell Reference McDonnell2005). To this end, the 1994 Improving America’s Schools Act (IASA) began to press state and local education agencies to measure and hold schools accountable for students’ performance, to take steps to improve student achievement, and to reduce inequality between subgroups of students. It required states and localities to establish academic standards, conduct student assessments consistent with standards, and use the results from those assessments to hold schools accountable for students’ performance (Manna Reference Manna2006; Moffitt and Cohen Reference Moffitt and Cohen2015). IASA, however, lacked meaningful incentives, consequences, and supports, thereby yielding few substantive changes in frontlines educational practice. The regulatory infrastructure, financed through federal funds but conducted by state and district administrators, remained focused on compliance with fiscal protocols.
Substantive inducements for change emerged in the 2002 No Child Left Behind Act (NCLB), President George W. Bush’s reform bill. For this reason, NCLB (and not IASA) is typically portrayed as the watershed federal policy, expanding federal reach into subnational terrains in new ways (Manna Reference Manna2010), with different implications for the core technology of teaching and learning. As McGuinn (Reference McGuinn2005, 66) argues, “No Child Left Behind signaled the beginning of a new era of federal education policy and significantly transformed and expanded the national role in our country’s schools.”Footnote 20 To a greater degree than its predecessors, it focused more explicitly on holding schools accountable for reducing inequality between subgroups of students.
NCLB was able to push in these new directions at least partly because of prior federal investments in subnational capacity and of states’ prior investments in elements of standards-based reforms (McDonnell Reference McDonnell2005, Reference McDonnell2015). Federal categorical grants played notable roles in augmenting the administrative capacities not only of state departments of education but also of nonprofit organizations to provide technical assistance to school districts (Bulkley and Burch Reference Bulkley and Burch2011). The federal government’s expanded reach into public education had been underway for 50 years, and those prior investments mattered to states’ and districts’ responses to NCLB. The implications of centralization on organizational capacities, this suggests, depend on the terrain in which centralization occurs.
Yet, this “new era” of American public education provoked a chorus of critics who portrayed it as usurping state and local control over schools (Derthick Reference Derthick, Wittes and Nivola2015; Ravitch Reference Ravitch2010); others documented subnational resistance (Shelly Reference Shelly2008). Despite the backlash it sparked after implementation, NCLB enjoyed impressive bipartisan support in Congress during an era marked with increasing partisan acrimony and polarization (Manna Reference Manna2010). Indeed, many states had been moving toward implementing elements of NCLB’s standards-based reform approach during the decade that preceded NCLB. Federal policy expansion was possible, in part, because it “borrowed strength” from the states, thanks to policy entrepreneurs who capitalized on subnational capacity and legitimacy (Manna Reference Manna2006). Despite its conceptual shift—toward more regulation of instruction—NCLB did not embody a significant shift in its fiscal design: it remained a categorical grant, with a formula that distributed funds widely across congressional districts. Thus, it did not reflect a significant shift in politics or finances. NCLB did, however, represent a significant shift in organization, albeit one that built on previous investments.
Whereas other scholars have examined NCLB’s problems improving student achievement, we focus on its implications for the “quality of bureaucracy”: whether and where the expansion of federal government through NCLB yielded zero-sum, redistributive positive-sum, and/or path- dependent positive-sum implications for subnational technical and administrative capacity, depending on prior development, as depicted in table 3.Footnote 21 Considering US public education in terms of organizational capacity, administrative capacity embodies a subnational domain that had been well developed before the passage of NCLB. In contrast, subnational governments had not developed technical capacity for instructional support.Footnote 22 Moreover, NCLB’s proponents argued that centralization was crucial to remedy inequalities that local- and state-controlled schooling had created, allowed, and perpetuated. We thus examine the development of capacity in high- and low-poverty counties following the enactment of NCLB.
Implications of Centralization for Subnational Education Capacity

Because durability is a fundamental feature of a robust federation (Bednar Reference Bednar2009), we also examine the implications of the 2008 recession on organizational capacity: economic instability threatened the ambitious education goals of NCLB and other standards-based education reforms. Even if capacity increased after NCLB, that capacity might be vulnerable to economic volatility.
Empirical Strategy and Measures
What are the implications of centralization for investments in and the durability of subnational organizational capacity? To address these questions, we leverage a dataset of subnational administrative and technical capacity for all counties in the United States from 1997 to 2015.Footnote 23 We examine the implications of centralization—the rollout of NCLB—and the implications of volatility from the 2008 recession.
Measures
We measure organizational capacity in two primary ways: subnational administrative capacity and subnational technical capacity for instructional support. Because these two forms of capacity experienced different historical trajectories and different degrees of prior development, centralization through NCLB may bear on them differently.
Both technical and administrative capacity require individuals (i.e., staff) to do the work of governance. Therefore, we operationalize capacity using measures of staffing levels for both administrative capacity and technical capacity, as reported by schools and local education agencies (LEAs). Organizational capacity is partly a matter of connective tissue (administration), partly a matter of know-how (technical capacity), and partly a matter of resources. The size of the staff, as a reflection of resource investment, allows us to assess relative investment in administration or the technical core of agency work by providing a common unit of measurement across the two categories. It also provides a way of mitigating the risk of conflating organizational capacity (infrastructure) with implementation or outcomes (Centeno, Kohli, and Yashar Reference Centeno, Kohli and Yashar2017, 4–6).Footnote 24 To contribute to debates over whether and when centralization remedies or exacerbates subnational inequalities, we also assess variation in subnational capacity development and erosion across high- and low-poverty counties. Our data for both forms of organizational capacity come from the Common Core of Data Local Education Agency Universe Staff Survey Data.
Our measure of subnational administrative capacity includes the following classifications: school administrative support staff, LEA administrative support staff, school administrators, and LEA administrators. These positions align with fiscal and oversight roles and responsibilities, consistent with administrative capacity. This variable measures FTE staff members responsible for coordinating finances within districts and within states—critical components of inter- and intra-institutional oversight. Our measure of subnational administrative capacity also includes the staff responsible for enforcing and overseeing implementation of federal policy and adherence to federal mandates within and across schools. Administrative capacity, thus, connects component parts both vertically and horizontally.
Our measure of subnational technical capacity includes instructional coordinators and supervisors. These positions are typically connected to classroom teaching and learning and provide the technical expertise required for supporting teachers’ instructional practice. This includes support for teachers’ professional learning opportunities, support with materials selection and use, and support with instructional strategies. Each measure is aggregated to the county level and weighted by the number of students, yielding the total number of administrative and instructional employees per 100 students by county.
Organizational capacity and effective governance, however, depend on more than staff: they also depend on bureaucratic competence (Centeno, Kohli, and Yashar Reference Centeno, Kohli and Yashar2017; Evans and Rauch Reference Evans and Rauch1999). Although publicly available data do not allow us to measure the competence of the public bureaucrats who hold administrative and technical positions, investments in those positions constitute first-order conditions for organizational capacity. Administrative and technical investments reflect core components of bureaucratic development, crucial for subnational units to do the work of governance.
Models
We analyze two discontinuities—NCLB and the 2008 recession—to assess the implications of centralization on subnational capacity and the durability of subnational capacity in the context of economic volatility. To do so, we use interrupted time series analysis (ITSA). ITSA is commonly used in the social and medical sciences to explore temporal discontinuities when randomization is not possible (Bloom Reference Bloom2003; Dee and Jacob Reference Dee and Jacob2011; Goldstein and Pevehouse Reference Goldstein and Pevehouse1997; Kontopantelis et al. Reference Kontopantelis, Doran, Springate, Buchan and Reeves2015; Penfold and Zhang Reference Penfold and Zhang2013). In our study, we use ITSA to model subnational capacity before and after NCLB and the 2008 recession. ITSA performs interrupted time series analysis using two ordinary least-squares (OLS) regressions, estimating the effect of an intervention when the outcome variable is ordered as a time series. The basic equation (for one “interruption”) is as follows:
 $$ {Y}_t={\unicode{x03B2}}_0+{\unicode{x03B2}}_1(T)+{\unicode{x03B2}}_2\left({X}_t\right)+{\unicode{x03B2}}_3\left({TX}_t\right), $$
where
 $ {Y}_t $
is the aggregated outcome variable measured at year (t),
 $ (T) $
is the time since the intervention,
 $ \left({X}_t\right) $
is a dummy (indicator) variable representing the intervention (pre-NCLB or pre-recession periods 0; otherwise 1), and
 $ \left({TX}_t\right) $
is an interaction between the intervention and time.
 $ {\unicode{x03B2}}_0 $
represents the intercept, and
 $ {\unicode{x03B2}}_1 $
is the slope or trajectory of the outcome variable until the introduction of the intervention (NCLB or the 2008 recession).
 $ {\unicode{x03B2}}_2 $
represents the change in the level of the outcome that occurs in the period immediately following the introduction of the intervention.
 $ {\unicode{x03B2}}_3 $
represents the difference between pre-intervention and post-intervention. In sum, significant p values for
 $ {\unicode{x03B2}}_2 $
indicate an immediate treatment effect and, for
 $ {\unicode{x03B2}}_{3,} $
indicate a treatment effect over time (Linden and Adams Reference Linden and Adams2011).
First, we examine national trends over time where the unit of analysis is the weighted average of administrative and technical capacity by year. Next, we examine variation in capacity in high- and low-poverty counties, where the unit of analysis is county-average by year. The ITSA design aggregates our large N data into a weighted annual average. It allows us to estimate separate linear regression lines for multiple periods to examine the effect of multiple interventions on the outcome variable of interest. In the subsequent analysis highlighted in figures 1–6 and summarized in tables 4–6, the model estimates three OLS regression lines for each intervention period: pre-NCLB (the 1997–2002 school year), post-NCLB (the 2003–2009 school year), and post-recession (the 2010–2015 school year).Footnote 25
Administrative Capacity ITSA, 1997–2015

Technical Capacity ITSA, 1997–2015

Administrative Capacity ITSA in Low-Poverty Counties

Administrative Capacity ITSA in High-Poverty Counties

Technical Capacity ITSA in Low-Poverty Counties

Technical Capacity ITSA in High-Poverty Counties

Administrative and Technical Capacity ITSA, 1997–2015

Note: Standard errors in parentheses.
*** p < 0.001; ** p < 0.01. * p < 0.05.
Administrative Capacity in Low-Poverty and High-Poverty Counties ITSA, 1997–2015

Note: Standard errors in parentheses.
*** p < 0.001; **p < 0.01; * p < 0.05.
Technical Capacity in Low-Poverty and High-Poverty Counties ITSA, 1997–2015

Note: Standard errors in parentheses.
*** p < 0.001; ** p < 0.01. * p < 0.05.
Results
Our results reveal the importance of distinguishing between administrative and technical capacity and between high- and low-poverty counties, as well as the importance of both discerning the impact of initial shocks and longer-term trends. The findings suggest that subnational capacity both erodes and expands following NCLB, depending on prior development. They also suggest limits to centralization’s ability to remedy fundamental aspects of structural inequality.
Implications of Centralization for Subnational Capacity
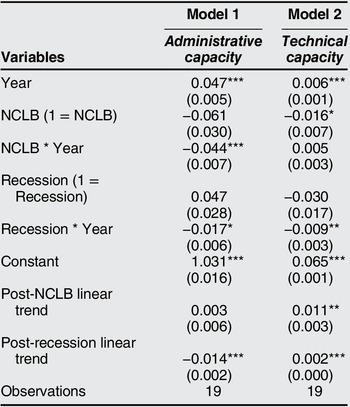
Our results suggest that the implications of the landmark No Child Left Behind Act depend on the type of subnational organizational capacity: administrative or technical. Administrative capacity, Model (1), reflects the more developed form of organizational capacity in US public education, involving the collection, allocation, and oversight of funds, as well as oversight of school operations. Should significant zero-sum erosion occur, administrative capacity is where we would expect such erosion to manifest.
Results from Model (1) in table 4 show evidence of zero-sum erosion. Although the initial, negative impact of NCLB does not obtain conventional levels of statistical significance (p = 0.06), the negative impact of NCLB on administrative capacity is significant over time. After NCLB, there is a significant decrease (-0.04) in the number of administrators per 100 students, relative to the pre-NCLB trend. In other words, subnational administrative capacity decreases in the wake of NCLB, compared to the period of rapid growth pre-NCLB.
Figure 1 helps visualize this trend. The period of 1997–2002 is marked by a steep slope, indicating consistent growth in administrative capacity during this time period. We then observe the NCLB disruption, followed by a slower rate of growth after NCLB, although administrative capacity continues to grow in absolute terms. This portrait implies zero-sum implications of centralization in the most-developed domain of subnational capacity.
A different portrait appears for technical capacity. Recall that NCLB ushered in significant new demands for US public schools’ teaching and learning—the heart of classroom practice—to help remedy gaps in achievement that persist across socioeconomic, racial, and ethnic lines. These demands move beyond administrative capacity (overseeing fund use) to include technical demands: expecting teachers to teach more ambitious content to more students than before. Historically, subnational investment in the technical capacity of US public educators has been notably weak. The results from Model (2) in table 4 suggest an initial dip in subnational technical capacity immediately following NCLB, followed by an increase in the growth rate for subnational technical capacity post-NCLB. The post-NCLB linear trend estimate shows a statistically significant and positive linear trend in the years following the expansion of federal capacity: the number of technical coordinators and supervisors grew at a rate of 0.01 per 100 students.
Figure 2 renders these results more vividly. This trend is consistent with positive-sum implications: federal policy “building up” subnational capacity, in a domain that had previously been weak and was essential to “do the work of governance in a federation” (Ziblatt Reference Ziblatt2004, 96).
Durability of Subnational Capacity
Durability is a key element of a robust federation (Bednar Reference Bednar2009). Considering capacity as an important structural safeguard to federations invites us to assess the durability of both embedded capacity (administrative capacity, in the case of public education) and nascent capacity (technical capacity, in the case of public education). The 2008 recession provides us with an opportunity to assess the durability of NCLB’s positive-sum and zero-sum implications in the wake of state fiscal constraints and changing fiscal federal relations.
Returning to table 4, the negative association between the 2008 recession and technical capacity does not obtain conventional levels of statistical significance in the school year immediately following the recession. This is not surprising in the case of US public education. Given union contracts, public education staff positions are difficult to eliminate abruptly. Over time, however, administrative and technical capacity, measured by the weighted number of instructional support and administrative support staff, declines after the 2008 recession: the number of administrators per 100 students declines by 0.02 per year, and the number of technical coordinators and supervisors per 100 students declines by 0.01, relative to the positive pre-recession time trend.
Scholarship on decentralization reminds us that administrative decentralization without the provision of sufficient funds to support those administrative efforts does not reflect a shift of power from the center to the subnational units (Faletti Reference Falleti2005). Considering NCLB as centralizing (rather than decentralizing), a parallel logic might cast doubt on whether it did, indeed, shift power to the central state if its fingerprint on organizational capacity proved ephemeral. Our results do not suggest that federalism is the chief contributor to unstable organizational capacity. Rather, they suggest that centralization alone may be insufficient to combat declining subnational budgets in the wake of the 2008 recession.Footnote 26 We consider this point and its implications for policy design later.
Although one justification for centralization points to its potential to help manage crises (like economic recessions), another one points to its potential to remedy subnational inequalities. Looking at administrative and technical capacity overall can mask the subnational inequalities that are hallmarks of federated systems. In what ways have the implications of centralization coupled with the 2008 recession varied by poverty level? We focus on variation in poverty level in the analysis that follows, given its historic and enduring importance in US public education (Owens, Reardon, and Jencks Reference Owens, Reardon and Jencks2016).
Subnational Capacity by Poverty Rate
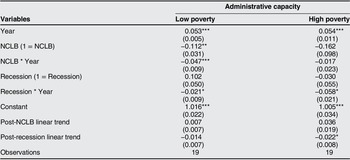
Given NCLB’s ostensible antipoverty ambitions, we assess centralization and economic volatility’s implications for county-level capacity, looking specifically at variation in high- and low-poverty counties. To measure variation by poverty level, we match the dataset to county-level Small Area Income and Poverty Estimates (SAIPE) from 1997 to 2015. We then divide counties into quintiles by childhood poverty levels (percent of the population aged 5–17 living in poverty). The average poverty level for low-poverty counties is 9.3% percent versus 32.8% for high-poverty counties. Focusing on administrative capacity, table 5 shows that NCLB is associated with a decline in administrative capacity in the lowest-poverty counties both immediately following the passage of the legislation and over time. This suggests that the extent to which erosion manifested, it did so in low-poverty counties.
Results from table 5 and figure 3 suggest that centralization can be zero-sum. In low-poverty counties, NCLB depresses the growth of administrative capacity, which is significant at conventional levels; it does not yield discernible implications for administrative capacity in high-poverty counties. Low-poverty counties have more administrative support staff on average than high-poverty counties, suggesting differences in baseline administrative capacity by income. Administrative capacity in both low- and high-poverty counties, however, appears to diminish in the wake of the 2008 recession at a rate of administrators per students at -0.02 and -0.06 per year in low-poverty and high-poverty counties, respectively.
As with administrative capacity, the implications of NCLB for technical capacity appear in low-poverty counties, albeit in the opposite direction (table 6). The portrait for technical capacity suggests some positive-sum implications of centralization, but in ways that continue path-dependent processes of privilege rather than in ways that mitigate the structural inequalities that often manifest in federalism.
Variation in the allocation of punitive measures resulting from NCLB could shed additional light on these results. Investing in instructional support staff members represents an asset-building approach to school improvement, in contrast to more punitive approaches to intervention like school takeovers or school restructuring. Scholarship finds that the racial composition of districts, along with poverty rates, significantly predicts whether districts would face either more punitive or more lenient NCLB interventions (Manna and Moffitt Reference Manna and Moffitt2021; Morel Reference Moffitt, Lyddon, Morel, O’Neill, Smith, Willse and Cohen2018). The growth of technical capacity (an asset-building, less punitive approach) in low-poverty areas is consistent with these findings (figure 5).
Robustness Checks and Puzzles for Future Research
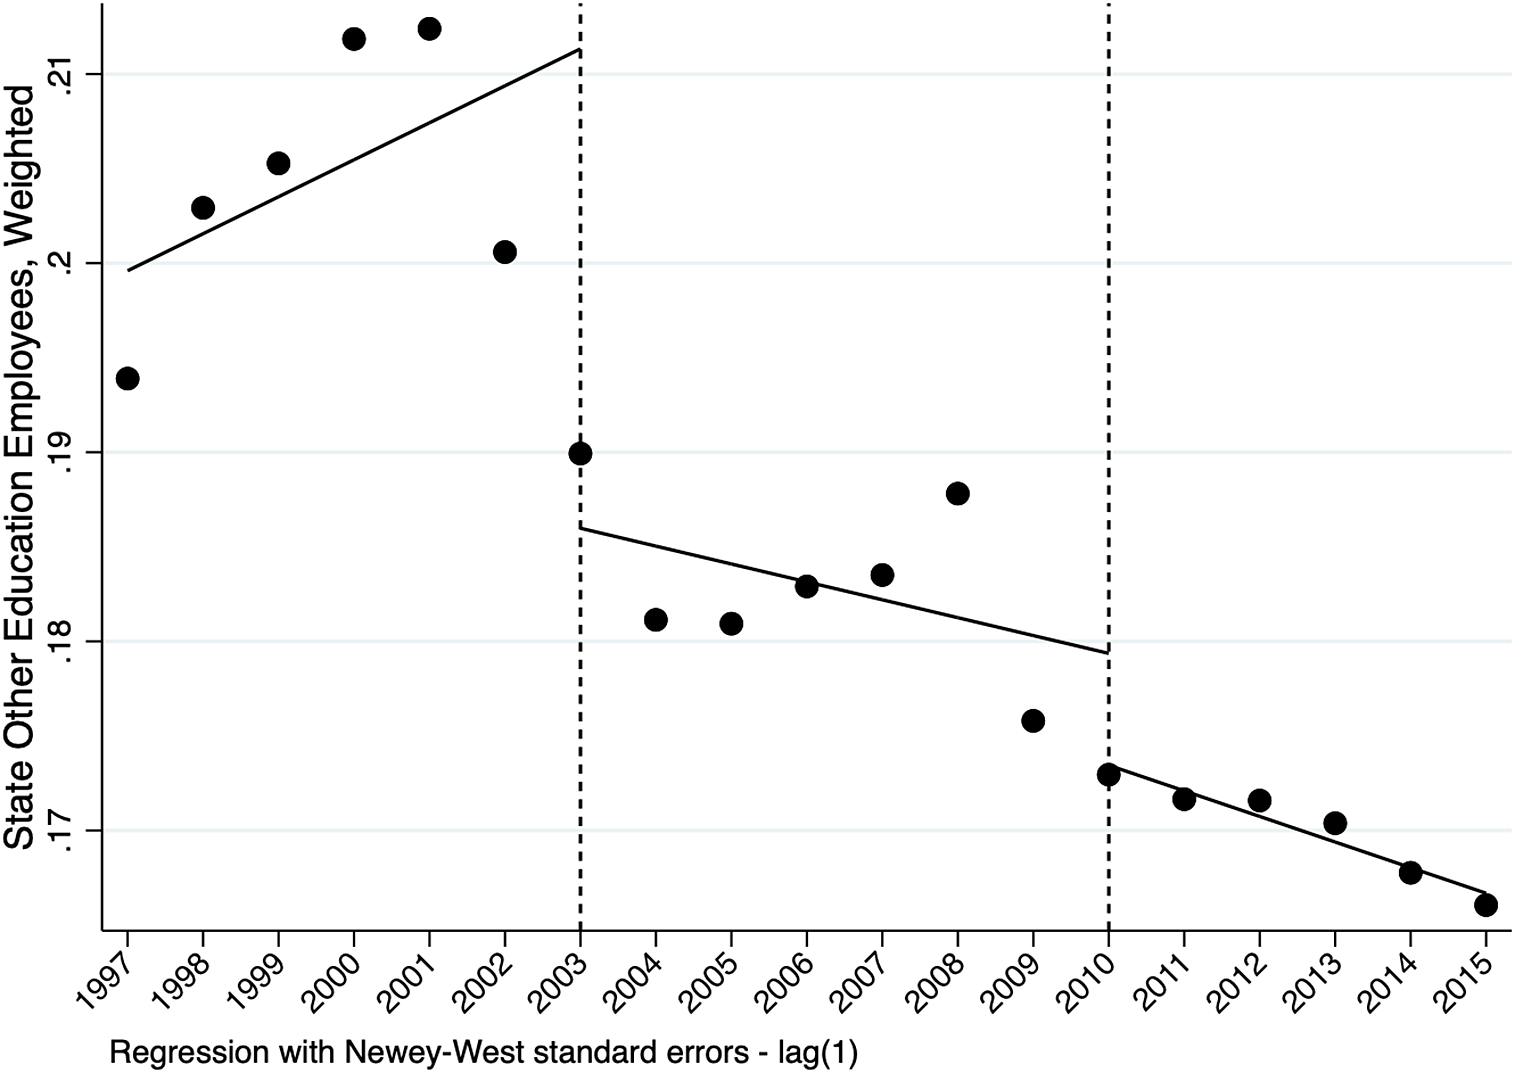
Are our results model dependent? To assess this possibility, we deployed an alternative source of data to measure administrative capacity: the US Census Annual Survey of Public Employees and Payroll Tables, which measures education employees staffing levels from 1997 to 2015.Footnote 27 We combined these data with the Common Core of Data Local Education Survey to create a measure of state administrative capacity weighted by state student population. The results, highlighted in figure 7, are similar to those of our county-level administrative capacity models. There is a small, immediate decline in capacity following NCLB. After the recession, there is a continued decrease in capacity, which is both statistically and substantively significant. These results suggest that our findings on administrative capacity measured at the local education agency level (aggregated to the county level) manifest at the state education agency level as well. Our state-level and district-level administrative results both reveal post-NCLB declines. Future research on policy design could help discern ways in which centralization yields similar or different organizational implications for different levels of subnational capacity (state, county, local).
State Administrative Capacity ITSA, 1997–2015

As a second robustness check, we examined the development of nongovernmental capacity throughout this time period. Organizational capacity is not restricted to governmental agencies but can include nongovernmental agencies that help do the work of governance (Cammett and MacLean Reference Cammett and MacLean2014; Cohen Reference Cohen1982). One possibility is that centralization leads to a significant expansion of nongovernmental capacity, instead of subnational governmental capacity. Alternatively, increasing reliance on markets through private or nonprofit service providers instead of on governments has been a hallmark of decentralized welfare reforms. Expanded reliance on nongovernmental sources of capacity could suggest decentralization, rather than centralization. Though nongovernmental education service providers have always been part of the Title I landscape, encouraging school districts to use their Title I funds to purchase their services, NCLB’s call for optional supplemental education services ushered in an additional provision amenable to nongovernmental agency services (Hughes and Hughes Reference Hughes and Hughes1972; Manna Reference Manna2010, 75–80).
To measure nongovernmental capacity, we used a subset of organizations from the National Center for Charitable Statistics (NCSS) Core Trend Public Charities 1989–2015, which relies on information from both the IRS Business Master File and Return Transaction Files. Our analysis includes 794 education service organizations from 1997 to 2015.Footnote 28
Figure 8 presents our results for nongovernmental capacity, measured by the weighted number of education service organizations over time. Results suggest that nongovernmental capacity expands throughout this period but does not appear related to NCLB in a systematic way. Results from figure 8 depict the rapid growth in nonprofit education service provision during this time period, irrespective of policy shocks like NCLB. The stark contrast between subnational governmental agencies and nongovernmental agencies marks another potentially promising venue for future research, because the US system depends heavily on nongovernmental organizations to do the work of governance.
Nongovernmental Capacity ITSA, 1997–2015

Discussion and Conclusion
The COVID-19 pandemic together with a global recession invite renewed attention to centralization, particularly its processes for building capacity and its implications for inequality. Lessons from policies like US Social Security highlight opportunities for greater centralization to protect vulnerable populations from economic volatility and to remedy aspects of inequality that manifest in subnational policies. As we draw lessons from the past to inform paths forward to respond to COVID-19, the bumpy history of expanding the federal government’s role in US public education encourages careful consideration of how the details of centralizing policies bear on bureaucratic quality and underlying inequality.
Assessing the implications of centralization on subnational units’ capacity to “do the work of governance” requires distinguishing components of organizational capacity—including administrative and technical capacities—and their prior development. Experiences from the No Child Left Behind Act suggest simultaneous subnational erosion in administrative capacity and growth in technical capacity following centralization. To the extent that centralization in the case of NCLB had zero-sum implications, those dynamics appear most vividly for the aspect of subnational capacity that was previously more developed: administrative capacity.Footnote 29 Positive-sum implications appear for the aspect of subnational capacity that had been previously weak: technical capacity. These findings suggest that the implications of centralization in our education case depend on a context populated with prior investments: NCLB came nearly 50 years after the original Elementary and Secondary Education Act of 1965. Our story, thus, picks up midstream.
Looking back over a longer expanse of time, the expansion of the US federal government into American public schools since 1965 put the education of children from underresourced communities on national and state agendas. It helped augment the size and responsibility of state departments of education. By some accounts, it has yielded increases in educational achievement, high school completion rates, and a range of other adulthood benefits, especially for children experiencing poverty (Johnson Reference Johnson2015). Yet, NCLB’s version of centralization reflects a policy design unable to build organizational capacity to remedy underlying inequalities. The growth in subnational technical capacity following NCLB appears to be concentrated in low-poverty counties, even though the federal policy was designed with explicit antipoverty purposes. Moreover, the erosion of previously developed capacity (administrative) also appears in low-poverty counties. Taken together, these results suggest that, although centralization has the potential to remedy structural inequalities through investments in subnational capacity, more resourced subnational units may be better positioned to make use of those investments both to dismantle old capacities and to build new ones.
Yet, this discouraging portrait should also be interpreted cautiously and within the context of NCLB’s design. NCLB embodied a particularly punitive form of federal-level policy toward public schools, not one that emphasized building the technical expertise of teachers and administrators. Given its accountability-focused design, any growth in subnational technical expertise during this era could seem remarkable. Considering subnational investments in public education’s organizational capacity over time, Title I’s complicated history does not impugn centralization. Instead, the ways in which centralization has fallen short of remedying underlying inequalities, even for policies with antipoverty purposes, invite greater attentiveness to all four elements of organizational capacity—resources, administration, technical know-how, and reach—both in research and in policy design.
We offer this case to researchers and policy makers in the COVID-19 era to underscore the importance of organizational capacities and investments in public bureaucracy. One lesson from this case study is the importance of context, which is consistent with established work on the ways federalist systems and their evolving dynamics vary significantly across time and across place (Triesman Reference Triesman2007).Footnote 30 A second lesson is the importance of policy design. Policy designs activate different kinds of professions and different kinds of subnational politics (Manna and Moffitt Reference Manna and Moffitt2021), and they matter to the durability of subnational coalitions willing to support and implement central government policies (Karch and Rose Reference Karch and Rose2019). Considering the limitations of our case, future scholarship would benefit from systematically assessing how the implications of centralization for organizational capacities vary by key aspects of policy design: whether centralization reaches directly to local governments or passes through state or provincial governments (Hooghe and Marks Reference Hooghe and Marks2003), whether states have the fiscal capacity to make use of federal-level grants (Howell and Magazinnik Reference Howell and Magazinnik2020), and whether the interests of different types of underresourced geographic spaces (urban, suburban, and rural) are represented in state-level decisions that bear on the development of subnational organizational capacity.
Although we emphasize the importance of organizational capacities, future scholarship would benefit from moving beyond investments in bureaucracy to assessing whether and how those capacities affect policy implementation.Footnote 31 Capacity is ultimately relative to the state’s goals (Enriquez and Centeno Reference Enriquez and Centeno2012; Katzenstein Reference Katzenstein1978; Sikkink Reference Sikkink1991; Skocpol Reference Skocpol, Evans, Rueschemeyer and Skocpol1985; Skowronek Reference Skowronek1982). Technical capacity (the needed knowledge) and administrative capacity (the connective tissue and oversight) depend on the tasks that practitioners are expected to accomplish. To remedy subnational inequalities through centralization, future analysis might discern the “capacity gap”: the gap between the amount of technical and administrative capacity that subnational units have and the amount that is needed to accomplish tasks.
Lessons from US education policy invite caution in the current political and policy terrain, reeling from the reverberating effects of COVID-19 and the 2020 recession. Early work on COVID-19 explicitly implicated federalism in exacerbating the inequities that manifest in both the burden and response to COVID-19, with good reason (Huberfeld, Gordon, and Jones Reference Huberfeld, Gordon and Jones2020). The operation of federalism can, indeed, perpetuate inequality (Kettl Reference Kettl2020). Yet, efforts to centralize through policies like NCLB underscore potential risks. The organizational capacity of subnational governments depends on policy designs and operates on unequal terrains. Although centralization can help remedy underlying subnational inequalities, such expansion also risks diminishing aspects of subnational capacity and reinforcing inequalities. It bears emphasizing that centralization is not, in and of itself, a panacea for subnational inequalities: its potential depends on the quality of the bureaucracy that it produces.
Supplementary Materials
To view supplementary material for this article, please visit http://doi.org/10.1017/S1537592721002012.
Acknowledgements
We are grateful to the Spencer Foundation and the William T. Grant Foundation for generously supporting this research through grant 201700042. We received excellent advice and thought-provoking questions from Stéphane Lavertu, Paul Lewis, Susanna Loeb, Clayton Nall, Kathy Thelen, Margaret Weir, and our reviewers. This research was made possible through the careful work of the Brown University Education Standards Team’s research assistants and programmers, including Victoria Chávez, Ferris Lupino, Antonina Rytwinska, and Michele Winter. We are grateful to our colleagues on the Education Standards team—Carmen Sobczak, Marie Schenk, Michaela O’Neill, Matthew Lyddon, and Kristen Essel—for their constructive feedback. All errors are our responsibility. We dedicate this article to the memory of our coauthor, David K. Cohen, who passed away suddenly in the fall of 2020. His contributions to the field were tremendous, and we will miss the gift of his presence in our lives.