I. INTRODUCTION
Levitation techniques are important to study the rapid solidification of undercooled melts because it removes the crucible wall which is the preferential site of heterogeneous nucleation. Reference Nozaki, Nagashio and Kuribayashi1 In particular, electromagnetic levitation (EML) is one of the suitable techniques for studying the solidification behaviors of metallic or semiconductor systems, Reference Aoyama, Takamura and Kuribayashi2,Reference Aoyama and Kuribayashi3 especially for some materials which react with quartz crucible, such as Al–Si alloys. Accordingly, undercooled solidifications of many alloys have been realized by EML technique. Reference Binder, Galenko and Herlach4,Reference Luo, Wang, Chang, Xia and Wei5 In those reports, the microstructure evolutions are rich, Reference Aoyama, Takamura and Kuribayashi2–Reference Luo, Wang, Chang, Xia and Wei5 but experiment observations of undercooled dendrite growth processes are rarely seen. Most of theories always assumed the behaviors of interface for undercooled solidification similar to that of directional solidification which has been studied deeply. Reference Zhang, Nakajima, Wu, Wang and He6 Jackson and Hunt discovered a group of transparent organic compounds that solidify like metals, which have been used widely to model the growth of metal alloys. Reference Jackson and Hunt7,Reference Somboonsuk, Mason and Trivedi8 With the help of the transparent materials, the solidification picture can be taken by looking through the glass plate, so that the dendrite growth of directional solidification process can be studied thoroughly. Reference Zhang, Nakajima, Wu, Wang and He6–Reference Böyük and Maraşlı10 However, the dendrite growth in undercooled melt cannot be observed directly by transparent materials, so it is not yet understood clearly. Most of the studies consider the growth process similar to the directional solidification, i.e., the velocities of growth interface, the content in solid–liquid interface and the undercooling in solidification process remain constant. Reference Wang, Wang, Liu and Zhai11 Actually, from the present experiment, the pre-existing assumption should not be all right.
The high speed video (HSV) can often be used to in situ observe the solidification interface as well as to measure the growth velocity. Reference Xu, Liu and Zhang12,Reference Xu, Liu and Dang13 Generally, for metallic materials, the thermal diffusion interface (or heat interface) of solidification can be observed by HSV, but the real solid/liquid interface (or phase interface) is hard to be divided. This does not affect the study of solidification rate because thermal diffusion and solid–liquid interface fronts overlap when the undercooling is larger than a certain value, but some information are missing at small undercooling. For Al–Si hypereutectic alloys, the emissivity (ε = 0.58) of solid Si is larger than that of liquid (ε = 0.22), Reference Aoyama, Takamura and Kuribayashi2,Reference Aoyama and Kuribayashi3 thus, the apparent brightness of the solid Si is much higher than that of the liquid during solidification. This makes the solid/liquid interface clear. Accordingly, in solidification of Al–Si alloy, both the thermal interface (due to latent heat release) and the solid/liquid interface can be captured by a HSV camera, so that the nucleation and growth of primary phase (Si) can be investigated from HSV images.
In this work, the growth behavior on recalescence of undercooled Al30Si70 melt was investigated by measuring the nucleation frequency, growth velocities and observing the microstructures in a wide range of undercoolings. The forming process of undercooled Si dendrite will be analyzed by HSV images. Considering the fact that Al–Si alloy cannot be levitated by EML method directly, in the present experiment, the sample was melted by a continuous wave CO2 laser first, and then the liquid sample was levitated by a radio-frequency generator.
II. EXPERIMENTAL
To investigate the undercooled solidification of Al30Si70 alloy, EML method was used to perform the undercooling experiments. Firstly, the sample with a diameter of 3–5 mm was placed on a sintered boron nitride holder, positioned in the center and inside the EML coil. Secondly, the chamber of the EML facility was evacuated to 10−4 Pa and then filled with argon gas. Then, the sample was heated through a window on the top of the chamber by a continuous wave CO2 laser and levitated by a radio-frequency generator. To reveal what actually occurred during the rapid solidification, the HSV camera system, Lightning RDTPlusTM (DRS Technologies, Oakland, New Jersey), capable of operation at rates up to 150,000 frames per second, with the maximum resolution of 1280 × 1024 pixels, was used to observe transformation through a window on the side of the chamber. Thermal history of the sample was monitored by a monochromatic highly sensitive infrared pyrometer with 2 ms response time and 1.55 μm operating wavelengths. Morphologies of sample surfaces of the as-solidified samples were analyzed using optical microscopy and scanning electron microscopy (SEM).
III. RESULTS
A. HSV images
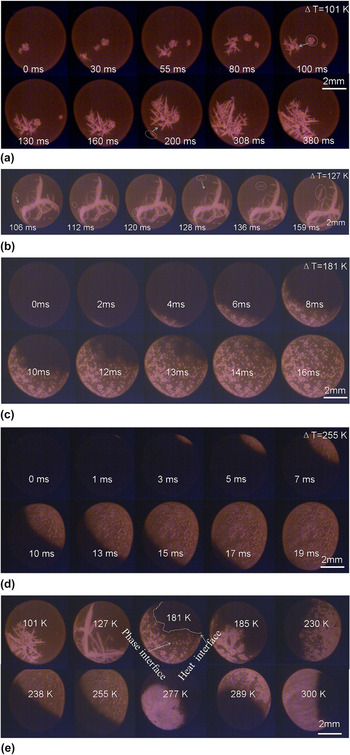
Figure 1 shows the HSV images of solidification process of Al30Si70 melt with different undercoolings. It can be found that all the samples are spherical, and some of them rotate freely during solidification due to the magnetic field as a blender.
HSV images of the samples: (a) ΔT = 101 K, (b) ΔT = 127 K, (c) ΔT = 181 K, and (d) ΔT = 255 K, and (e) the effect of undercooling on the solidification interface.

For the sample with ΔT = 101 K [Fig. 1(a)], the solidification starts from one nucleation point. After that, nucleation does not stop during primary Si growth. The primary silicon grows as several wafers. The Si wafers have a tendency to move to the solid phase region gradually if those form at different sites. For example, at t = 200 ms, we can observe a Si wafer initiated at bottom left, and then moved to the solid region gradually. One possible reason is that the temperature of solid phase is higher than that of the liquid, which leads to lower density for the liquid around the solid region. The other possible reason is due to strong electromagnetic stirring, motion of particles along streamlines. All those may lead the floated Si wafers to agglomerate.
Figure 1(b) shows the HSV images of the sample with ΔT = 127 K, where the interface appears as several Si dendrites. As shown by the arrow in the image with t = 100 and 128 ms, two Si wafers formed from other sites are moving to the solid region, which further confirms the tendency of solid phase agglomerating.
If ΔT = 181 K, however, as shown in Fig. 1(c), the primary Si solidified as many equiaxed grains, instead of larger dendrites. The interface of the solidification front consists of many grains. It is worth to note that the grain density in the solidification interface reduces with time, which indicates that the silicon content in liquid of the solidification interface reduces with time, so that the number of grains in the initial region of solidification is more than that in the ending region.
In further increasing the undercooling, for example, HSV images of the sample with ΔT = 255 K are as shown in Fig. 1(d). The solidification interface consists of many smaller grains. The grains (Si) almost wholly absent the faceted growth characters. Similarly, it can also be found that the Si grain density in the initial region of solidification is higher than that in the ending region.
Figure 1(e) shows the evolution of solidification interface with undercooling in the range of 101–300 K. There are two types of interfaces, i.e., the phase interface (bright) and the heat interface (gray), that can be observed. If the undercooling is small (e.g., ΔT = 101 K), only the phase interface (i.e., solid–liquid interface) can be recorded by HSV, since the phase interface moves much slowly compared to the heat diffusion rate, and the recalescence heat (from latent release) is not sufficiently large. If the undercooling is large enough, e.g., ΔT = 300 K, the phase interface moves with the heat interface in very close proximity. If the undercooling is between 181 and 289 K, the phase interface (bright) moves slower than the heat interface (gray). Accordingly, both of the two interfaces can be distinguished from HSV images. As can be seen, with increase of undercooling, the shape of the heat interface front changes from rough to smooth, but the phase interface (solid–liquid interface) changes from large dendrites (or wafers) to small equiaxed grains, and no smooth interface appears for any undercooling. As a result, the smooth solidification interface observed in many other alloys with a large undercooling, Reference Xu, Liu and Zhang12,Reference Xu, Liu and Dang13 is in fact the heat interface but not the phase interface, such as for Ni–B alloy. However, the velocity of the phase interface can also be approximated by that of the heat interface because the difference reduces with rise of undercooling.
B. Microstructures
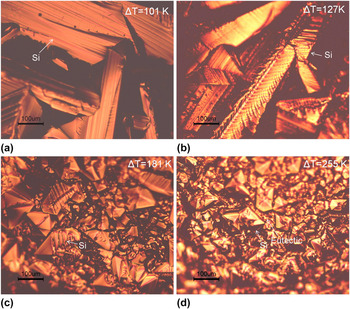
Upon HSV images for the solidification processes of different undercoolings, Fig. 2 shows the surface microstructure of as-solidified samples by optical microscopy, where various morphologies of Si phase can be observed. For the sample with ΔT = 101 K [Figs. 2(a)] and 127 K [Fig. 2(b)], large Si wafers distribute randomly, and many layers can be observed in the Si wafer, which suggests that the primary Si grows layer by layer. However, when the undercooling increases upto ΔT = 181 K and ΔT = 255 K, the primary Si appears as many fragmented bulks. Note that the size of grains for ΔT = 255 K is far smaller than that for ΔT = 181 K.
Macrostructures of samples: (a) ΔT = 101 K, (b) ΔT = 127 K, (c) ΔT = 181 K, and (d) ΔT = 255 K.

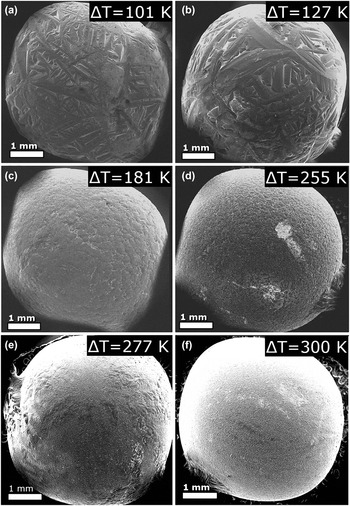
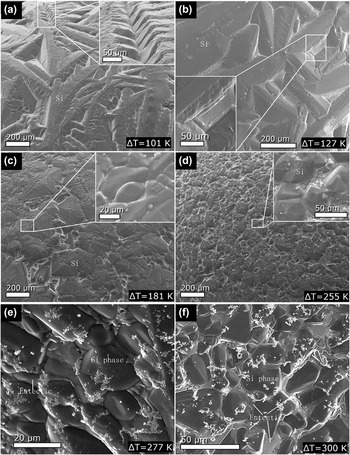
To further clarify the microstructure evolution, Fig. 3 shows the SEM images of sample surfaces with ΔT = 101, 127, 181, 255, 277, and 300 K. As compared to the HSV images in Fig. 1(e), the morphologies in the SEM images are similar to those of the HSV images, and the sizes of Si wafer are also similar. It indicates that the process recorded by HSV is indeed the growth process of primary Si. As can be seen from Fig. 3, at smaller undercoolings (101 and 127 K), primary Si grows as wafers or dendrites. With the undercooling increases (181–300 K), the primary Si shows as equiaxed grain. Figure 4 shows the magnification structures of the samples, which further confirms the microstructure evolution with undercooling. In Figs. 4(a) and 4(b), the primary phase (Si) for small undercooling (101 and 127 K) is jagged structure with pronounced edges and faces. A strong faceted feature is visible in the surface images. Generally, faceted morphology is a consequence of lateral growth (edge-wise growth), so that the lateral growth dominates the growth process of primary Si at lower undercoolings.
SEM analysis with low magnification for samples with ΔT = 101 K (a), 127 K (b), 181 K (c), 255 K (d), 277 K (e) and 300 K (f).

SEM analysis with high magnification for samples with ΔT = 101 K (a), 127 K (b), 181 K (c), 255 K (d), 277 K (e) and 300 K (f).

Surface morphology of the sample with an intermediate undercooling, 181 K, is shown in Fig. 4(c). Mixture of faceted structure and nonfaceted structure [convex patterns, the inset of Fig. 4(c)] can be observed. Special edges and faces, which are typical results of lateral growth, are not as eminent as in the samples with small undercoolings. The mixed structure indicates the growth mode of primary Si at ΔT = 181 K, which includes not only the edge-wise mode, but also the continuous growth mode (generally, the nonfaceted morphology results from the continuous growth Reference Aoyama, Takamura and Kuribayashi2 ).
When the undercooling increases to 255 K, refined surface microstructure can be observed, as shown in Fig. 4(d), and a small amount of faceted morphology, as well as special faces and edges of primary Si can be found. The undercooling has a strong effect on the grain refinement in comparison with the structure in Fig. 4(c). When the undercooling further increases to 277 and 300 K, as shown in Figs. 4(e) and 4(f) respectively, the morphologies of most of the Si grains are shown as nonfaceted characteristics. Thus the morphological change from faceted morphology to nonfaceted morphology with undercooling increase is not abrupt. Comparing with the existing research studies, Reference Aoyama, Takamura and Kuribayashi2 the morphology evolution of Si phase in Al30Si70 alloy is similar to that of pure Si and Ge.
IV. ANALYSIS AND DISCUSSIONS
In the preceding sections, the HSV images of solidification processes and morphologies of sample surface subjected to different undercoolings, have been exhibited. To get more insight into the transformation behavior of Al30Si70 alloy, the nucleation rate and growth velocity of Si phases need to be further discussed.
A. Nucleation rate and grain sizes
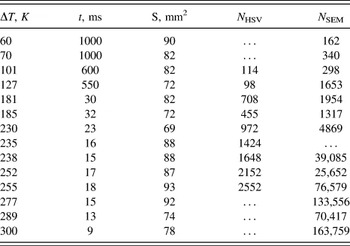
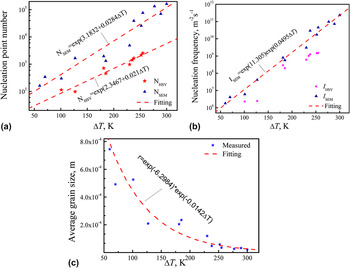
From the HSV images, the nucleation number of the semisurface of sample, N s, can be measured, and thus the total nucleation number on surface can be considered as N HSV = 2N s. With this method, the measured nucleation number (N HSV) as a function of undercooling is shown in Table I and Fig. 5(a). It follows an exponential relationship, N HSV = Exp(2.3467 + 0.021ΔT). With these results, the nucleation frequency on the sample surface can be estimated. For the present experiment, the nucleation process is dominated by heterogeneous nucleation, because the undercooling does not reach the hypercooling limit. The classical heterogeneous nucleation theory considered the nucleation only at catalyst surface, and the nucleation frequency always means the nucleus number per unit area and per unit time. Reference Turnbull14,Reference Jian and Jie15 Since the sample is levitated in the present experiment, the nucleation is assumed to originate mainly from surface impurities and oxides. In that case, the nucleation frequency (I HSV) scales with the surface area of the sample and it can be estimated by
 $${I_{{\rm{HSV}}}} = {{{N_{{\rm{HSV}}}}} \over {S \cdot t}}\quad ,$$
where S is surface area of the sample, t is the time interval from start to end of solidification from the HSV images. From measurement of a dozen samples, the estimated nucleation frequency as a function of undercooling is shown in Fig. 5(b).
Measured data from HSV and SEM images.

Measured nucleation data: (a) nucleation point number; (b) nucleation frequency measured from HSV and SEM results; (c) grain size as a function of undercooling.

The nucleation frequency on the sample surface can also be estimated from the SEM image by measuring the grain numbers. It is assumed that the grain distributed uniformly on the sample surface; the grain number is defined as N s in a SEM image with area of A ss, and the sample surface area as S, then the total grain number of the sample can be estimated by N SEM = N s S/A ss. With this method, the nucleation numbers in the sample surfaces are measured as shown in Table I and Fig. 5(a). Since the nucleation frequency scales with the surface area, it can be estimated by,
 $${I_{{\rm{SEM}}}} = {{{N_{{\rm{SEM}}}}} \over {S \cdot t}} = {{{N_{\rm{s}}}} \over {{A_{{\rm{ss}}}} \cdot t}}\quad .$$
With Eq. (2), the calculated nucleation frequency on the sample surface as a function of undercooling is shown in Fig. 5(b). It can be found that the measured values from SEM analysis are an order of magnitude larger than that from HSV images. The reason is that, by HSV images, in large undercooling, many grains cannot be separated due to lacking of resolution, especially for the sample with very high undercooling. Accordingly, the HSV results may be lower than accurate nucleation points. However, by the SEM measurement, there are many fragmented dendrites that were taken as nucleation points, thus the measured grain numbers are larger than the accurate values, and the accurate number of nucleation points should be between the results of HSV and SEM methods. Here, we accept the result of SEM for the time being, which can be fitted by I SEM = Exp(11.305) Exp(0.0495ΔT) as shown in Fig. 5(b). It is shown that the fitting relationship can describe the experiment results well.
Furthermore, from the measured nucleation number the average grain size for each undercooling can be estimated. Assuming every grain size as r × r, then r can be estimated by
 $$r = \sqrt {{{{A_{{\rm{ss}}}}} \over {{N_{\rm{s}}}}}} = \sqrt {{S \over {{N_{{\rm{SEM}}}}}}} \quad .$$
From the measured data of SEM analysis and Eq. (3), we can calculate the average grain size as a function of ΔT as shown in Fig. 5(c). The calculated result can be fitted by r = Exp(−6.2984) × Exp(−0.0142ΔT p). The exponential relationship can fit the experiment results well except in small undercooling. It may be because of that in small undercooling, the Si phase is shaped as faceted wafer, but in large undercooling, Si is shaped as nonfaceted equiaxed grains.
B. Growth velocities
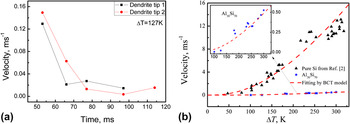
The undercooling has an important effect on the growth velocity. For example, Fig. 6(a) shows the growth velocity of two dendrite tips measured from HSV images with ΔT = 127 K. It can be found that for each dendrite the growth velocity decreases with time. One reason is that the recalescence heating makes the temperature of liquid region rise, i.e., undercooling reduces, which results in reduction of the growth driving force. The other reason may be that during growth of the Si dendrite, the silicon content in liquid, as well as solid–liquid interface is less and less, so the solid–liquid interface moves slower and slower, which can also be verified by the HSV of ΔT = 181 K [Fig. 1(c)], where the grain number of Si at solidification interface obviously reduces with time (it is also attributed to Si content less and less in liquid). Trivedi et al. had also found the decreasing growth velocity with time in Al50Si50 alloy. Reference Trivedi, Jin and Anderson16 They attributed the decreasing solidification front propagates and the velocity to the recalescence heating effect. Nevertheless, for the sample with large undercooling (ΔT ≥ 181 K), the grains are so small that the velocity of dendrite tips cannot be measured. Only the average growth velocity of many the grains can be measured and it shows near a constant for each undercooling. Therefore, for small undercooling, the dendrite tip velocity reduces with time while the nucleation changes are small, but for large undercooling, the nucleation rate decreases with time while the growth velocity is near a constant during transformation (see Fig. 1).
Growth velocity of single dendrite as a function of time for the sample with ΔT = 127 K (a), and average growth velocity as a function of undercooling (b).

The average growth velocity (of Si) due to the primary solidification, as a function of undercooling, is shown in Fig. 6(b), where the velocity of pure Si (Ref. Reference Aoyama, Takamura and Kuribayashi2) is also shown for comparison. It can be found that the growth velocities of Si phases for both pure Si and Al30Si70 alloy increase with undercooling. However, the growth velocity of pure Si is 2–3 orders of magnitude larger than that of primary Si due to solidification of Al30Si70. Therefore, the composition plays a key role in the growth of Si phase. The growth velocity of the primary phase (Si) can be analyzed by applying the Boettinger, Coriell and Trivedi's (BCT) dendrite growth model. Reference Boettinger, Coriell, Trivedi, Mehrabian, Parrish, Mehrabian and Parrish17 Accordingly, the total undercooling at the dendrite tip consists of four contributions.
 $$\Delta {T_{\rm{p}}} = \Delta {T_{\rm{c}}} + \Delta {T_{\rm{t}}} + \Delta {T_{\rm{r}}} + \Delta {T_{\rm{k}}}\quad ,$$
where ΔT c, ΔT t, ΔT r, and ΔT k, i.e., the solutal undercooling, the thermal undercooling, the curvature undercooling, and the kinetic undercooling, respectively, can be given as follows:
 $$\Delta {T_{\rm{C}}} = {m_{\rm{L}}}{C_0}\left[ {1 - {{{{m'} \mathord{\left/ {\vphantom {{m'} {{m_{\rm{L}}}}}} \right. \kern-\nulldelimiterspace} {{m_{\rm{L}}}}}} \over {1 - \left( {1 - k} \right)Iv\left( {{P_{\rm{C}}}} \right)}}} \right],\;<$$><$$>\Delta {T_{\rm{k}}} = {V \over \mu },\;\Delta {T_{\rm{r}}} = {{2\Gamma } \over R},\;\Delta {T_t} = {{\Delta H} \over {{C_{\rm{P}}}}}Iv\left( {{P_{\rm{t}}}} \right)\quad .$$
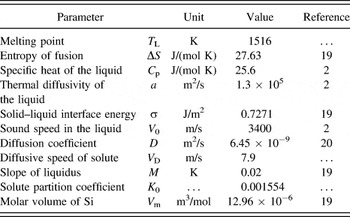
The parameters defined can be found in Ref. Reference Boettinger, Coriell, Trivedi, Mehrabian, Parrish, Mehrabian and Parrish17. μ = fΔHV 0/R g T L 2 is the kinetic growth coefficient with ΔH as the enthalpy of fusion, T L the alloy liquidus temperature, and R g the gas constant. V 0 is the speed of sound in the collision-limited growth for the growth of solid solution, or the atomic diffusion-controlled speed for the growth of intermetallic compound. f is the atomic site factor, for pure metals and their dilute alloys taking f = 1, while for Si, whose transformation is from metallic liquid to covalently bonded diamond structure, it is suggested as 0.02. Reference Liu, Volkmann and Herlach18 The other parameters used for the current calculations are shown in Table II. Reference Aoyama, Takamura and Kuribayashi2,Reference Jian, Yang, Chang and Jie19,Reference Zhang, Nakajima, Wang and He20 The composition C0 for pure Si and Al30Si70 alloy are substituted by 0.0000001 and 0.70, respectively. It can be found that, with f = 0.02, the experimental data agree well with the theoretical calculations for both pure Si and Al30Si70 alloy, although the velocity of former is far larger than that of the latter. This indicates that (i) BCT model can be used in the nonmetallic primary phase; (ii) using the atomic site factor f = 0.02, the average growth velocity of Si phase in pure Si or Al–Si hypereutectic alloys can be predicted well by classical BCT model. This result will supply a foundation to simulate the growth process of primary phase (Si).
Material parameters used in theory calculation.

In the past, due to the observation limit, in the undercooled solidification, researchers always assumed a constant velocity and content with time during solidification, such as in the classical dendrite growth model BCT model. Reference Boettinger, Coriell, Trivedi, Mehrabian, Parrish, Mehrabian and Parrish17,Reference Wang, Liu, Chen, Yang and Zhou21 From the present study, the classical theory assumptions are not accurate, but it is still able to predict the average growth velocity changing with undercooling. Because the growth velocity changes obviously at small undercooling, in that case, only a few dendrites grow with a smaller velocity in the sample, even if the velocities have significant change with time, they are impossible to deviate considerably from the predicted value of BCT model.
V. CONCLUSIONS
Undercooled solidification of Al30Si70 alloy melt has been quantitatively examined by EML technique, in combination with in situ imaging of the solidification front by using high-speed video analysis and microstructural analysis of the as-solidified samples. The results show that:
-
(1) Solidification of undercooled Al30Si70 melt always starts from one point but not multiple points. After that, nucleation of primary phase continues to proceed upon solidification. It is observed that at small undercooling, the growth velocity of Si wafer tip decreases with time while at large undercooling the nucleation rate decreases obviously with time. With increase of undercooling, the phase interface(or solid–liquid interface), similar to the morphology of primary Si, changes from faceted wafers to nonfaceted equiaxed grain, but the heat interface changes from rough to smooth. The grain size of primary Si decreases with undercooling, which can be fitted by r = Exp(−6.2984) × Exp(−0.0142ΔT p).
-
(2) The growing Si wafers will agglomerate with each other if they are initiated at different sites on the surface of sample. It may be attributed to the liquid near the solid phase region that has higher temperature, lower density and lower solute Si content than those far from the solid region. Besides, some other reasons may cause the agglomeration, such as strong electromagnetic stirring and motion of particles along streamlines. The average growth velocity can be predicted by classical BCT model with the atomic site factor of f = 0.02 for primary Si.
Supplementary Material
To view supplementary material for this article, please visit http://dx.doi.org/jmr.2015.401.
ACKNOWLEDGMENTS
The authors are grateful for the financial support of the National Basic Research Program of China (No. 2011CB610403), the Natural Science Foundation of China (Nos. 51401156, 51301125, and 51371133), the Natural Science Basic Research Plan in Shaanxi Province of China (No. 2014JM6225), the Fund of Shaanxi Province Thin Film Technology and Optical Test Open Key Laboratory (No. ZSKJ201403) and the President fund of Xi'an Technological University (No. XAGDXJJ1307). J.F. Xu expresses thanks to M. Gong and X.L. Xu for their help in this work.