Silky windgrass is considered one of the most serious grass weeds in central and northern Europe, infesting primarily winter cereal crops (Hamouzová et al. Reference Hamouzová, Soukup, Jursík, Hamouz, Venclová and TůMová2011; Massa and Gerhards Reference Massa and Gerhards2011; Schulz et al. Reference Schulz, Pallutt and Gerowitt2011). This species has shown resistance to herbicides inhibiting acetolactate synthase (ALS), acetyl-CoA carboxylase (ACCase), and photosystem II (PSII) (Heap Reference Heap2016). Silky windgrass has a suite of traits that enables it to rapidly evolve herbicide resistance: cross-pollination, high seed production, widespread distribution, and a life cycle well adapted to winter-sown crops as well as short life in soil with low primary dormancy (Jasieniuk et al. Reference Jasieniuk, Brûlé-Babel and Morrison1996; Wallgren and Avholm Reference Wallgren and Avholm1978). At a density of 200 plants m−2, silky windgrass reduces the yield of winter cereals up to 30%, and it can cause greater yield losses than blackgrass (Alopecurus myosuroides Huds.) (Melander Reference Melander1995; Melander et al. Reference Melander, Holst, Jensen, Hansen and Olesen2008).
There are two main mechanisms of resistance, viz. target-site resistance (TSR), and non–target site resistance (NTSR). In silky windgrass, seven target-site mutations have so far been described at three positions in the ALS gene (Hamouzová et al. Reference Hamouzová, Košnarová, Salava, Soukup and Hamouz2014; Krysiak et al. Reference Krysiak, Gawroński, Adamczewski and Kierzek2011; Massa et al. Reference Massa, Krenz and Gerhards2011). Target-site mutations have been associated with cross-resistance between herbicide groups inhibiting ALS and active in silky windgrass (Hamouzová et al. Reference Hamouzová, Košnarová, Salava, Soukup and Hamouz2014; Krysiak et al. Reference Krysiak, Gawroński, Adamczewski and Kierzek2011; Massa et al. Reference Massa, Krenz and Gerhards2011). Depending on the resistance mechanism, multiple resistance (between different sites of action) and cross-resistance (between chemical groups with the same site of action) can evolve. Some cases of multiple resistance have been assumed to be caused by NTSR, but this was not confirmed (Hamouzová et al. Reference Hamouzová, Košnarová, Salava, Soukup and Hamouz2014; Petersen et al. Reference Petersen, Naruhn and Raffel2012).
An early identification of the evolution of herbicide resistance in the field can help, if acted upon, to prevent and delay the spread of resistance to neighboring weed populations. Because of gene flow, populations neighboring a resistant silky windgrass population should become resistant. Increased levels of herbicide resistance, either through visual observations or through dose response studies, have been demonstrated in silky windgrass following specific herbicide practices (Adamczewski et al. Reference Adamczewski, Kierzek and Matysiak2009). A scenario of the evolution of a distinct spatial pattern with a resistance epicenter and neighboring populations showing proportionally lower resistance levels would be expected according to current thinking about how resistance spreads in this species.
The spatial structure of herbicide-resistant weeds has explored only TSR modeling by the evolution and spread of resistance alleles based on theoretical gene flow metrics (Cavan et al. Reference Cavan, Cussans and Moss2000; Diggle et al. Reference Diggle, Neve and Smith2003; Maxwell et al. Reference Maxwell, Roush and Radosevich1990; Menchari et al. Reference Menchari, Camilleri, Michel, Brunel, Dessaint, Le Corre and Delye2006; Richter et al. Reference Richter, Zwerger and Böttcher2002). Different models have correlated the spread of TSR alleles with the fitness differential between resistant and susceptible (Maxwell et al. Reference Maxwell, Roush and Radosevich1990; Richter et al. Reference Richter, Zwerger and Böttcher2002); therefore, the spatial structure from such models is species specific (or at least phylogenetically correlated). As many weeds show an aggregated (patchy) structure, it could be assumed that resistance will also show a patchy distribution. However, Menchari et al. (Reference Menchari, Camilleri, Michel, Brunel, Dessaint, Le Corre and Delye2006) found that ACCase herbicide-resistant alleles in blackgrass did not have a spatial structure and that the evolution of TSR resistance occurs at a small scale (field level). Using silky windgrass, Nordmeyer’s (Reference Nordmeyer2009) model estimated the spread of TSR in the field but was unable to model the resistance allele dynamics in the absence of herbicide application. Massa et al. (Reference Massa, Kaiser, Andújar-Sánchez, Carmona-Alférez, Mehrtens and Gerhards2013) demonstrated that the distribution of resistant silky windgrass was also correlated to field-specific management. For both resistance mechanisms, gene flow between neighboring populations via pollen or seed dispersal is a factor in the spread of herbicide resistance, especially in silky windgrass, because the individuals of this species produce a high number (up to 16,000) of wind-dispersed small seeds (0.5 mm) that have been shown to easily travel up to 10 m (Soukup et al. Reference Soukup, Novakova, Hamouz and Namestek2006; Warwick et al. Reference Warwick, Black and Zilkey1985). Gene flow of herbicide resistance alleles through pollen and seed has been identified previously (Dale Reference Dale1992; Knispel et al. Reference Knispel, McLachlan, Van Acker and Friesen2008; Messeguer et al. Reference Messeguer, Fogher, Guiderdoni, Marfa, Catala, Baldi and Mele2001; Rieger Reference Rieger2002). Interestingly, Messeguer et al. (Reference Messeguer, Fogher, Guiderdoni, Marfa, Catala, Baldi and Mele2001) demonstrated that the spread of herbicide resistance in rice was correlated with the dominant wind direction.
Investigations on herbicide resistance patterns in silky windgrass have linked the development of resistance with management strategies (Espeby et al. Reference Espeby, Fogelfors and Milberg2011; Massa et al. Reference Massa, Kaiser, Andújar-Sánchez, Carmona-Alférez, Mehrtens and Gerhards2013; Schulz et al. Reference Schulz, Mathiassen and de Mol2014). The first confirmed case of ALS resistance in silky windgrass in Denmark occurred in 2011 (Mathiassen et al. Reference Mathiassen, Kudsk and Hensen2013) and provides an ideal scenario for this study to investigate early mechanisms and patterns of resistance development and dispersion. The objectives of this study were to (1) assess the levels of ALS herbicide resistance, as well as the occurrence of cross-resistance and multiple resistance, for interfield populations; (2) correlate them to resistance mechanisms; and (3) assess the presence of a spatial structure based on herbicide resistance levels.
According to these data, two hypotheses were tested: (1) that early stages of resistance evolution will rely on NTSR mechanisms and (2) that early herbicide resistance development is spatially structured as a resistance gradient with an epicenter where the level of resistance in the highest. In order to detect any consistent spatial pattern, and not only annual variation, the same populations were sampled over two successive years.
Materials and Methods
Field Selection and Population Sampling
The individual samples are henceforth referred to as populations. Silky windgrass has shown a stable aggregation pattern in time and space (Nordmeyer Reference Nordmeyer2009); therefore, the samples collected in different years at the same location are most likely part of the same population within similar patch sizes. The location was chosen following a targeted survey method, i.e., where unsatisfactory performance of an ALS-inhibiting herbicide on silky windgrass had previously been observed by the farmer. This method was recommended (Beckie et al. Reference Beckie, Heap, Smeda and Hall2000) and has been used to assess the resistance distribution pattern of various grass weeds (Herrmann et al. Reference Herrmann, Hess, Schubel, Strek, Richter and Beffa2014; Hess et al. Reference Hess, Beffa, Kaiser, Laber, Menne and Strek2012; Massa et al. Reference Massa, Krenz and Gerhards2011; Schulz et al. Reference Schulz, Mathiassen and de Mol2014). Within each field, population sampling was based on weed-patch distribution. The distribution of silky windgrass was not homogenous; therefore, populations were sampled where a weed patch was present. In 2013, a total of 19 samples in six neighboring fields—one potato (Solanum tuberosum L.), one red fescue (Festuca rubra L.), one perennial ryegrass (Lolium perenne L.), one tall fescue [Lolium arundinaceae (Schreb.) S. J. Darbyshire], and two winter wheat (Triticum aestivum L.)—were taken at a farm on the island of Funen in Denmark (55.353232°N, 10.531516°E). Following the recommendation of Burgos et al. (Reference Burgos, Tranel, Streibig, Davis, Shaner, Norsworthy and Ritz2013) for outcrossing species, each sample consisted of approximately 10 plants at the seed-shedding stage. From the 19 populations, a subset of eight was selected (see Dose-Response Bioassays section). In 2014, eight samples were collected from the same locations as the subset from 2013. All samples were geocoded, and seeds were threshed, cleaned, and stored at 4 C for a minimum of 3 wk to alleviate dormancy.
Dose–Response Bioassays
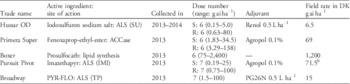
Following a preliminary ALS herbicide resistance screening (one dose of 1.5 g ai ha−1 iodosulfuron), a subset of eight populations was selected for further dose–response experiments. This low dose was selected because plants tend to be more susceptible in greenhouse conditions than in the field, but more importantly, because the aim was to identify a potential high- resistance phenotype and intermediate- to low-resistance phenotypes. This low dose, compared with the field dose, was used to separate the different levels of iodosulfuron-resistant populations from the susceptible populations. Selection of this subset was based on response variations: populations from the same field having a similar biomass reduction to iodosulfuron were eliminated. This method was used to capture the largest variation present in the area. In Denmark, the herbicide active ingredients registered and recommended to control silky windgrass at the 0- to 2-leaf stage in winter wheat belong to three groups of sites of action: the ALS inhibitors flupyrsulfuron, iodosulfuron, mesosulfuron, and pyroxsulam; the ACCase inhibitors fenoxaprop ethyl ester and clodinafop; and the fatty-acid elongation inhibitor prosulfocarb. Therefore, we selected herbicides from each of these modes of action. Dose–response bioassays were performed using five herbicides: the ALS inhibitors iodosulfuron (Hussar® OD, 100 gL−1 iodosulfuron sodium salt+300 gL−1 of mefenpyr-diethyl, Bayer CropScience, Germany), imazethapyr (Pursuit or Pivot, 22.87 gkg−1 imazethapyr ammonium salt, BASF, Germany); pyroxsulam, hereafter referred to as PYR-FLO (Broadway®, 22.8 g/kg florasulam+68.3 gkg−1 pyroxsulam+68.3 gkg−1 cloquintocet-mexyl [safener], Dow AgroSciences, Ziosville, IN); the ACCase inhibitor fenoxaprop ethyl ester (Primera Super®, 69 g L−1 fenoxaprop ethyl ester+75 gL−1 mefenpyr-diethyl [safener], Bayer CropScience, Germany); and the fatty-acid elongation inhibitor prosulfocarb (Boxer® EC, 800 gL−1 prosulfocarb, Syngenta Crop Protection, Denmark). Pyroxsulam is not available as a single product, and we therefore used a coformulation with florasulam that has no activity on monocot weed species (Anonymous 2008), hence the product is referred to as PYR-FLO. The three ALS herbicides were selected to represent different chemical classes in order to assess for cross-resistance, while the ACCase inhibitor and fatty-acid elongation–inhibiting herbicides were used to assess for multiple resistance. Populations collected in 2014 were subjected only to iodosulfuron, while the 2013 populations were subjected to all five herbicides (Table 1). The dose range for each herbicide was selected based on previous experiments, which appropriately covered the dose–response curve (multiple observations on the curve) of susceptible and resistant biotypes. Different dose ranges for susceptible and resistant populations were used because this allows a better fit of the dose–response curve and therefore a more precise estimation of parameters such as ED50.
Herbicide dose ranges used in the dose–response experiment of eight populations of silky windgrass collected in Funen in 2013 and 2014.Footnote a

a Abbreviations: ALS, acetolactate synthase; SU, sulfonylurea; ACCase, acetyl-CoA carboxylase; IMI, imidazolinone; TP, triazolopyrimidine; PYR-FLO, pyroxsulam+florasulam; R, resistant biotype; S, susceptible biotype.
b Imazethapyr is not allowed in Denmark; this rate comes from the rate allowed in other EU countries.
Bioassays were replicated twice for iodosulfuron, fenoxaprop, and prosulfocarb. For the POST herbicides iodosulfuron, fenoxaprop, imazethapyr, and PYR-FLO, seeds were sown in 2-L pots filled with a potting mixture consisting of soil, peat, and sand (2:1:1 w/w) containing all necessary micro- and macronutrients for optimal growth. Plants were treated at the 2- to 3-leaf stage (BBCH 12–13) in a cabinet sprayer with a boom fitted with two Hardi ISO-F-020-nozzles operated at a pressure of 300 kPa and a speed of 5.1 kmh−1, resulting in a spray volume of 150Lha−1. Known susceptible (ID100-2004 and/or ID100-2006) reference populations from Denmark were included in all the experiments. This ID100 population was initially collected in 2004 from Denmark and propagated for seed production in 2006. This population has been used as a susceptible reference in previous experiments of silky windgrass (Mathiassen et al. Reference Mathiassen, Kudsk and Hensen2013). A known ALS-resistant population was also included in all experiments (ID882). The pots were placed in the greenhouse or on an automatic watering table in a semi-field area that was automatically covered with a roof during rainy and windy conditions. We assess that these two conditions (greenhouse and covered semi-field) are similar enough to be compared due to the common automatic-watering table system, covered roof, experiments performed during spring, and absence of full-spectrum light. The experimental design was a complete randomized design with three replications per treatment. Plants were harvested 28 d after treatment, and fresh (FW) and dry weights (DW) were measured. For the PRE herbicide prosulfocarb, 15 seeds were sown in pots filled with field soil (69.3% sand, 13.9% silt, 14% clay, and 2.81% organic matter). Twelve hours after sowing the pots were treated and then immediately watered with 30 ml of deionized water on the soil surface to ensure herbicide activation in the upper soil layer. Subirrigation from individual saucers to pots was done thereafter. Germination differences were not observed between populations based on counting of germinated plants from previous experiments (one-dose and multiple-dose iodosulfuron assays).
Statistical Analysis for Dose–Response Bioassays
All herbicide dose–response data were analyzed with R v. 3.1.0 (R Core Team 2015) using the package ‘drc’ (Ritz and Streibig Reference Ritz and Streibig2005). Both fresh and dry weights were used to analyze the biomass response to the five herbicides using a three-parameter log-logistic model (Equation 1).
 $$f(x)\,{\equals}\,{d \over {1{\plus}{\rm exp}\,\left\{ {\left( {b\left( {{\rm log}\left( x \right)\,{\minus}\,\log \left( e \right)} \right)} \right.} \right\}}}$$
In this equation, e is the ED50, which is the dose producing a response halfway between the upper limit, d, and the lower limit, 0; and b is the slope around e (Ritz and Streibig 2005). The assumption that logistic dose–response curves could be fit was assessed by graphical analysis of the distribution of residuals and a test for lack of fit comparing the residual sum of squares of a two-way analysis of variance and the nonlinear regression in which the variables “population” and “dose” were treated as factors. If the graphical analysis of the residuals was not satisfactory, the biomass was transformed using a Box-Cox transformation, and the model was fit again. Once each population was fit with a satisfactory model, the ED50 was compared between populations using the Bonferroni correction (Benjamini and Hochberg Reference Benjamini and Hochberg1995), an adjustment for multiple comparisons. RIs were calculated by dividing the ED50 of the studied population by the ED50 of the susceptible reference from the same experiment. An RI value of 10 or higher has been acknowledged as the threshold to confirm resistance (Herbicide Resistance Action Committee [HRAC] 2016) but remains under debate (de Mol et al. Reference De Mol, Gerowitt, Kaczmarek, Matysiak, Sønderskov and Mathiassen2015; Paterson et al. Reference Paterson, Shenton and Straszewski2002). Resistance confirmation based on RI values relies heavily on the susceptible reference population, and it is known that susceptible populations of silky windgrass can show large natural variation in ED50 to a new ALS herbicide (de Mol et al. Reference De Mol, Gerowitt, Kaczmarek, Matysiak, Sønderskov and Mathiassen2015; Espeby et al. Reference Espeby, Fogelfors and Milberg2011). It is very difficult to confirm early evolution of resistance in populations with low levels of resistance, which is the aim of this study, using this method. The lack of extensively characterized natural variation in susceptible populations makes this type of identification ever harder. Furthermore, uncertainty in the ED50 of the susceptible reference in the form of a large SE would render RI estimations questionable. The agricultural definition of resistance confers resistance based on weeds that “are not controlled in a field situation” (HRAC 2016). Hence, based on ED50 values, a resistance classification system with six categories was created: S, sr, r, R, RR and RRR (Supplemental Material S1). Each category was based on the percentage of the estimated ED50 dose of the maximum recommended dose, where RRR is equal to 100% of the maximal recommended rate allowed in Denmark. This was done to enable comparison of the resistance levels between different herbicide experiments while acknowledging that the dose required to control silky windgrass grown in pots is significantly lower than the maximum recommended field dose. HRAC recommends using a combination of the scientific (RI) and agricultural (R category) definition to confirm resistance, which is why both measurements were used in this study.
Resistance Mechanism Screening
TSR was investigated for both ALS- and ACCase-inhibiting herbicides for each population used in the dose–response experiments in 2013 and 2014. A total of 0.5 g oven-dried leaves were ground (2010 Geno/Grinder, SPEX Sample Prep, Mölndal, Sweden) for 45 s at 1,500 Hz and then soaked in liquid nitrogen. DNA was extracted using the DNEasy Plant Mini Kit (Qiagen, Germany) following the manufacturer’s protocol, and DNA quantity was assessed by spectrophotometer (NanoDrop-1000 v. 3.1.0). Polymerase chain reaction (PCR) analysis was performed (Table 2) in a total volume of 25 µl 10% PCR reaction buffer (Thermo Fisher Scientific, Denmark), 2.5 mmolL−1 MgCl2 (Thermo Fisher Scientific, Denmark), 200 mmol l−1 dNTPs, 0.4 mmol L−1 of each primer, 2 units of Taq polymerase, and approximately 200 ng of genomic DNA. The ALS gene was sequenced in three fragments (Table 2). Amplicons were visualized on 1.5% agarose gel for 30 min at 100 V. PCR products were sequenced using the forward amplification primer and sent to Eurofins Operon MGW (Germany) for sequencing. Sequences were trimmed and quality checked by eye using UGene (v. 1.17.0) and were then aligned against the silky windgrass ALS reference sequence JN646110 (Hamouzová et al. Reference Hamouzová, Košnarová, Salava, Soukup and Hamouz2014) or the blackgrass ACCase reference sequence AJ310767 (Délye and Michel Reference Délye and Michel2005) using BioEdit (v. 7.2.3; Hall Reference Hall1999). The number and frequency of alleles in ALS and ACCase were identified in the 2013 populations. Two target-site positions (ALS; Pro-197, Trp-574), which are known in many grass weeds to confer ALS resistance, were screened using a minimum of 10 individuals per population instead of three as for the other known mutation positions in ALS (Ala-205, Asp-376, Arg-377, Ser-653, and Gly-654). Target-site mutations in ACCase at position Ile-1781, Trp-2027, Ile-2041, Asp-2078, and Gly-2096, were screened using the same 10 individuals used for ALS screening. For the populations collected in 2014, three individuals were screened for each TSR in the ALS and ACCase genes.
Primer pairs used to amplify ALS and ACCase gene for 19 populations of silky windgrass.

a ALS primers from Hamouzová et al. (2013) and Krysiak et al. (Reference Krysiak, Gawroński, Adamczewski and Kierzek2011). ACCase primers from Délye and Michel (Reference Délye and Michel2005).
NTSR was evaluated in nine populations collected in 2013 and two populations collected in 2014 by the Weed Resistance Group at Bayer CropScience in Germany. Eight individuals per population at stage BBCH 13–14 were incubated for 16 h with the herbicide mesosulfuron (ALS inhibitor) or fenoxaprop (ACCase inhibitor) and the insecticide malathion, which inhibits the cytochrome monooxygenase P450 complex and glutathione S-transferase enzymes postulated to be involved in NTSR in grass weed species, and then the amount of remaining herbicide was assessed by high-performance liquid chromatography. Inhibition of NTSR mechanisms by malathion has been used in other weeds in previous studies (Preston et al. Reference Preston, Tardif, Christopher and Powles1996; Yu and Powles Reference Yu and Powles2014). NTSR level was categorized in three levels depending on the percentage of herbicide active ingredient recovered after incubation for 16 h. A recovery of less than 50% indicated a high level of NTSR, a medium level indicated between 51% and 70%, and a low level was indicated by a recovery of more than 70%. TSR and NTSR were evaluated using the same individuals.
Spatial Structure Analysis
A minimum of 50 to 100 observations are recommended by Fox et al. (Reference Fox, Negrete-Yankelevich and Sosa2015) to perform spatial variograms; however, Nordmeyer et al. (2009) successfully used 16 to 22 observations of silky windgrass to perform a similar analysis. Therefore, to maximize the number of observations, the preliminary data from 2013 containing 19 populations were used. The Cartesian geographic coordinates and the herbicide efficacy (based on iodosulfuron fresh biomass weight [FW] reduction; Supplemental Material S2) were used for the spatial analysis performed in R (R Core Team 2015) following the R script from Fox et al. (Reference Fox, Negrete-Yankelevich and Sosa2015). This analysis was performed as a two-step procedure. First, an analysis of the trend surface was performed to detect large-scale trends in the data. The spatial trend was evaluated by comparing the data with various polynomials that represent trends of different shapes. The explanatory power of each trend was compared by performing a linear regression with the resistance level and then extracting the Akaike information criterion (AIC). Second, after the trend found in the first step was removed from the data (detrended data), a spatial autocorrelation analysis was performed on the residuals to detect small-scale spatial patterns.
Two further factors were evaluated for their potential explanatory power of the resistance pattern: wind direction and crop type. First, wind-mediated spread of resistance was investigated by projecting the location of all samples orthogonally on the dominant wind vector (direction roughly from southwest to northeast). Then a linear regression was performed to predict resistance level from the position on the wind gradient. Second, the crop in which samples were collected was investigated by fitting an ANOVA on the resistance level by crop type.
Results and Discussion
Herbicide Resistance Levels
Dose–Response Curves
The log-logistic regression model with three parameters was fit to all populations for the five herbicides using FW for all herbicides except for iodosulfuron, for which DW was used for one of the two replicates of the 2013 populations and for the 2014 populations (Supplemental Material S3). DW was used because it was not possible to fit the log-logistic model to the FW measurements due to a balance malfunction that was detected after FW measurement for this particular experiment. The full list of parameter values for each experiment can be found in Supplemental Material S3. Both the susceptible (ID100: see Figure 1 and Supplemental Material S3) and resistant (ID882: unpublished data) reference populations showed expected and satisfactory resistance level to iodosulfuron in 2014 with ED50 values of 0.03 (0.1) and 188 (109), respectively. Often the SEs of the parameter estimates were large (typical of experiments that use field populations with a putative high variation in response level within the population; Espeby et al. Reference Espeby, Fogelfors and Milberg2011), despite the fact that this study used different doses for suspected susceptible and resistant populations. Issues with large SEs when fitting dose–response curves have been reported previously for silky windgrass populations from Sweden and Germany (Espeby et al. Reference Espeby, Fogelfors and Milberg2011; Schulz et al. Reference Schulz, Mathiassen and de Mol2014). Similarly, the populations investigated here show a variation in the rate and level of resistance for all herbicides.
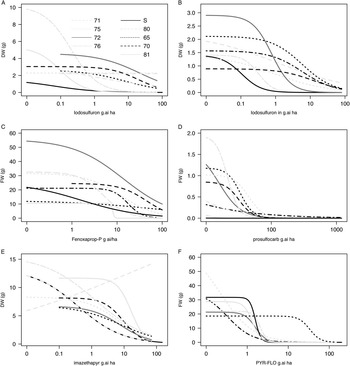
Dose–response curves for five herbicides for the eight populations of silky windgrass collected in Funen in 2013 and 2014. (A) Iodosulfuron populations collected in 2013; (B) iodosulfuron populations collected in 2014; (C) fenoxaprop; (D) prosulfocarb; (E) imazethapyr; (F) PYR-FLO (pyroxsulam+florasulam). FW, fresh weight; DW, dry weight.

Cross- and Multiple Resistances
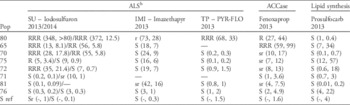
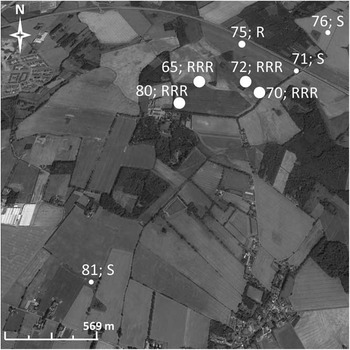
High levels of resistance to iodosulfuron were found in five out of the eight populations tested (Table 3; Figure 1A). Resistant phenotypes RRR were observed in four populations (80, 65, 70, and 72) from 2013, indicating that these have an ED50 value higher than the maximum recommended rate in Denmark (6.5 gaiha−1 for iodosulfuron; Supplemental Material S1). The populations 65, 70, and 72 were classified as S to imazethapyr and PYR-FLO (Table 3; Figure 1E and F, respectively). However, population 80 was resistant to imazethapyr (r) and PYR-FLO (RRR). Large variation among populations was also found for fenoxaprop, showing a similar pattern as the one found for iodosulfuron; populations 80 and 65 were highly resistant to both iodosulfuron (RRR and RRR, respectively) and fenoxaprop (R and RRR, respectively) while populations 70 and 72 were less resistant to fenoxaprop (Table 3). All populations were susceptible to prosulfocarb (Table 3; Figure 1D). We observed a wider range of RIs (0.1 to 372) for the five herbicides than what was reported in Czech populations (RI from 27 to 128) (Hamouzová et al. Reference Hamouzová, Soukup, Jursík, Hamouz, Venclová and TůMová2011). The highest RI values were found in population 80, with 348 and 68 for iodosulfuron and PYR-FLO, respectively. This, along with the flat dose–response curves (Figure 1), suggests that this population was not controlled even with the highest doses used in our experiment. Two of the populations showed a significant difference in ED50 value to the susceptible reference (population 72 for imazethapyr and population 80 for PYR-FLO) despite the large variation in response (Table 3). This result can be attributed to the large SEs of ED50 values, as discussed earlier.
Resistance category, ED50, and RI, for populations of silky windgrass tested with five herbicides.Footnote a

a Resistance indices and herbicide dose reducing the biomass by 50% (RI, ED50) are indicated in parenthesis. Resistance categories were created to reflect field visual assessment of resistance based on ED50 values: S, 0–15%; sr, 15–30%; r, 30–50%; R, 50–80%; RR, 80–100%; RRR, >100%.
b Abbreviations: SU, sulfonylurea; TP, triazolopyrimidine; IMI, imidazolinone; PYR-FLO, pyroxsulam+florasulam.
Based on resistance classification and RI, we found low cross-resistance among ALS herbicides. Population 80 showed high resistance to iodosulfuron, imazethapyr, and PYR-FLO but this pattern was not found in other populations highly resistant to iodosulfuron. This might indicate early stages of the evolution of cross-resistance in the populations sampled. Our results demonstrate multiple resistances to iodosulfuron and fenoxaprop but not extending to prosulfocarb. Our results support findings of multiple resistance to ALS and ACCase in other European populations of silky windgrass (Adamczewski et al. Reference Adamczewski, Kierzek and Matysiak2009; Heap Reference Heap2016).
Resistance Mechanisms
Six populations (Figure 2) collected in 2013 were tested for metabolic activity to ALS and ACCase inhibitors. Resistance to the ALS herbicide iodosulfuron was most likely solely caused by NTSR, as none of the seven ALS mutations were found in the 16 populations tested. Based on 128 sequences from the 2013 populations, we detected 13 different ALS alleles (Supplemental Material S4). These alleles were differentiated by polymorphism at seven positions within the ALS protein sequence. All of the alleles are functional, but the seven positions have not been functionally identified and they are not known herbicide TSR positions. Of the 13 alleles, seven were unique to only one of the 16 populations. None of the alleles were unique only to the most resistant populations (80, 65, 70, and 72). No insertions or deletions were found.
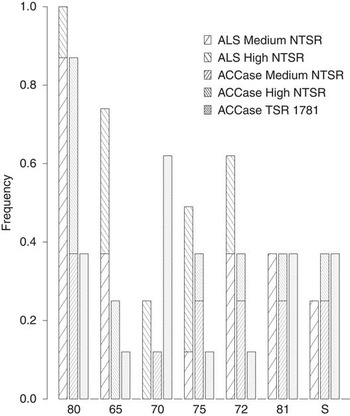
Frequencies of resistance mechanisms to ALS and ACCase. NTSR frequencies based on eight individuals per population. Medium and high levels of NTSR represent a detoxifying rate of the herbicide after 16 h between 31% and 49%, and <50%, respectively.

The overall frequency of ALS NTSR activity (medium+high) mirrored very well the resistant phenotype identified from the dose–response curves (Figure 2; Table 3). For example, population 80, classified as RRR in the dose–response, had a frequency of 1 for ALS NTSR (medium+high). Overall, medium levels of ALS NTSR (detoxification of 31% to 49% of the herbicide compound) were more frequent compared with high detoxification capacity (Figure 2). However, the presence of high detoxification levels, even at a low frequency, appears to be crucial to the level of resistance. For example, population 70 (RRR) had a low frequency of 0.3 but only showed high metabolic level, while population 81 (S) showed a somewhat higher frequency (0.4) but only medium metabolic level (Figure 2).
Resistance to ACCase herbicide fenoxaprop was caused by both resistance mechanisms; two populations with TSR and others with multiple levels of NTSR were found that were not mutually exclusive. Mutations conferring TSR were found at two different positions (Ile-1781-Leu and Ile-2041-Asn). Only three different alleles in the ACCase gene were identified has having mutations, indicating strong sequence conservation. The Ile-1781-Leu mutation was found at varying frequencies (Figure 2) in the 2013 populations but was not identified in any of the 2014 populations. The frequency of this mutation did not seem to affect the level of resistance. For example, population 70 had the highest frequency for this mutation, but overall the population was considered to be susceptible (sr). The Ile-2041-Asn mutation was only found in one out of eight individuals of population 70. The overall NTSR frequency did not correlate well with the resistance level to fenoxaprop. However, as for ALS inhibitors, the frequency of high metabolic resistance level against ACCase inhibitors correlated well with the resistance phenotype classification; population 80 (R) had a frequency of 0.4 for high levels of NTSR, and population 65 (RRR) had a low frequency of 0.3 but only high metabolic activity. Susceptible population 81 and the susceptible reference showed medium levels of resistance to ALS and ACCase inhibitors (Figure 2), indicating a baseline level of natural resistance in the species. The fact that all populations tested showed NTSR activity to ALS- and ACCase-inhibiting herbicides, even the susceptible ones, is not surprising, because most NTSR genes are known to have evolved in the first place to protect the plant against naturally occurring chemical stresses and diseases (Délye Reference Délye2013) and therefore predate herbicide use. The fact that early stages of ACCase resistance evolution show a mixture of mechanisms while only NTSR was identified in ALS resistance evolution could be due to the selection pressure from herbicide use (e.g., higher doses of ACCase herbicide used in these particular fields could select for TSR with NTSR being preexistent), or resistance to ALS could have evolved first (NTSR) and then enabled resistance to ACCase herbicides, or vice versa. Our data do not allow assessing which site-of-action herbicide resistance evolved first or which mechanisms evolved first in the tested population for ACCase resistance.
The identity of the genes involved in both high and medium NTSR activity could reveal a more precise picture of resistance mechanisms and resistance evolution. The role of detoxification pathways, most likely involving CytP450 or GST genes, is strongly suspected, albeit circumstantial. The farm at which these populations were sampled is one of the first in Denmark where de novo ALS resistance in silky windgrass was identified. These results indicate that the evolution of ALS resistance in these populations rested strongly on high levels of NTSR metabolic activity. The overall frequency of NTSR activity for ALS and ACCase was informative for resistance assessment, but the levels (medium vs. high) appear more important. Many factors can explain why some weed populations might have evolved different or higher efficiency of NTSR mechanisms than their neighbors. The variation in dose–response curve shape shown here for the different populations could indicate that other NTSR mechanisms than detoxification, such as transport and differential uptake of herbicide, might be occurring. It could be due to a stronger herbicide selection pressure as a result of the crop rotation in the specific field, the herbicide pressure could be similar to other fields but it could have been present for a longer time, or populations could be preadapted and have evolved high detoxification capacity before herbicide use through historical exposure to all manner of natural chemical threats.
NTSR is considered to be an unpredictable mechanism, as it can confer resistance even to herbicides not yet marketed and often confers multiple resistance (Délye et al. Reference Délye, Gardin, Boucansaud, Chauvel and Petit2011). However, multiple resistance to ALS and fatty-acid elongation inhibitors seem more unlikely to evolve in silky windgrass populations resistant via NTSR. PRE herbicides have retained good efficacy, when NTSR mechanisms were involved, due perhaps to heightened sensitivity during the early developmental stage of the plant at the time of exposure (Beckie Reference Beckie2011; Délye et al. Reference Délye, Gardin, Boucansaud, Chauvel and Petit2011; Hull et al. Reference Hull, Tatnell, Cook, Beffa and Moss2014). Therefore, PRE herbicides with different sites of action are still an effective solution to control iodosulfuron and fenoxaprop resistance in silky windgrass. In order not to exert a too strong selective pressure, different PRE herbicides with different sites of action should be used over several rotations.
ALS Resistance Evolution in Time
We observed a decrease in resistance to iodosulfuron in populations 75 and 72 between 2013 and 2014 (Table 3; Figure 1B), while populations 80, 70, and 65 remained highly resistant. These two groups of populations were found in different yet neighboring fields (Figure 3) managed by the same farmer. The field where resistance decreased had tall fescue in 2013 and 2014 (no plowing in between), while the field where resistance was stable across years had winter wheat in 2013 and winter barley in 2014. The change in resistance levels could be due to novel NTSR gene combination from one generation to the next. These combinations can be negative for the farmer (higher resistance level) or positive (reduced resistance level). Machinery direction has previously been found to be associated with resistance patterns in silky windgrass (Schulz et al. Reference Schulz, Mathiassen and de Mol2014) but generally can only explain an increase and not a decrease. Volatile resistance patterns were observed between years and fields in blackgrass (Herrmann et al. Reference Herrmann, Hess, Schubel, Strek, Richter and Beffa2014). However, our study found a volatile pattern in A. spica-venti in only one of the six fields studied. The apparent disappearance of the Ile-1781-Leu mutation from 2013 to 2014, along with the decrease in resistance level, could be attributed to resistance management by the farmer, but most likely reflected the temporal genetic variability of weeds caused by seedbank dynamics. It could, however, also indicate that a fitness cost is associated with resistant biotypes. For example, previous studies have revealed germination differences between ALS-resistant and ALS-susceptible silky windgrass phenotypes (Massa and Gerhards Reference Massa and Gerhards2011). Therefore, it is possible that susceptible biotypes germinated better compared with resistant biotypes, but further studies are needed to confirm this, and other, hypotheses.
Map of the populations with resistance levels to iodosulfuron (2013) by phenotype category based on ED50 percentage of the field rate in Denmark of the herbicide. ED50: S, 0–15%; sr, 15–30%; r, 30–50%; R, 50–80%; RR, 80–100%; RRR, >100%.

Spatial Gradient of Herbicide Resistance
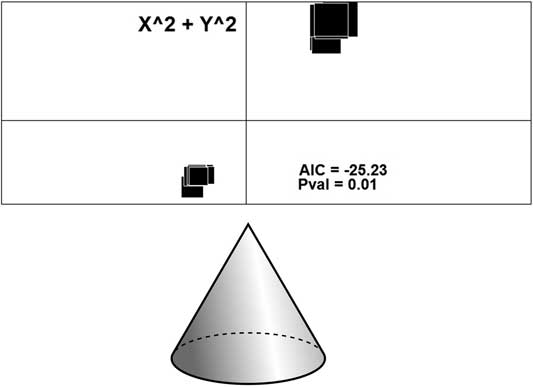
Visually, the most resistant populations seemed to be aggregated in one field, which represented the epicenter (Figure 3). The trend that best represented our data was X 2+Y 2 (Figure 4) with an AIC of −25.2 and a P-value of 0.017. This trend represented a cone-shaped surface where the center had resistance values higher than the mean that diffused gradually outward in all directions. This shape represents a clear mathematical illustration of our epicenter of resistance hypothesis. Once the data were detrended, only three distance-class categories remained. The semi-variogram (Supplemental Material S5) explained less than 0.05% of the total variance. Thus, spatial autocorrelation was not significant (P=0.84). This means that a smaller-scale spatial autocorrelation was not possible. The fact that so few distance-class categories remained indicates that the spatial structure cannot be found within the extent of our study. Possible reasons could be a low number of original observations or the low distance variance at which our observations were sampled. Schulz et al. (Reference Schulz, Mathiassen and de Mol2014) found that resistance to isoproturon in silky windgrass was randomly distributed in one field, indicating that spatial patterns are difficult to assess but also that they might be herbicide specific. Similarly, in ALS-resistant blackgrass in which both TSR and NTSR occur, neighboring fields developed resistance in very different patterns and there was no interfield structure to resistance in space or time (Herrmann et al. Reference Herrmann, Hess, Schubel, Strek, Richter and Beffa2014; Hess et al. Reference Hess, Beffa, Kaiser, Laber, Menne and Strek2012). Spatial resistance patterns seem specific and difficult to assess in interfield studies.
Significant spatial trends of iodosulfuron resistance pattern of 19 populations of silky windgrass collected in 2013 in Denmark evaluated by polynomial surface trend fitting on centered and transformed geolocation data.

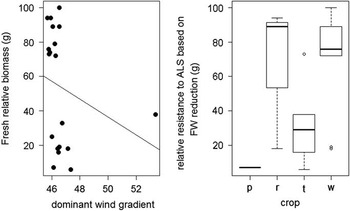
There was no correlation between ALS resistance and the wind direction (Figure 5; adjusted R2=0.08, P=0.58). This suggests that the spatial pattern of resistance in these particular fields was not due to pollen from the resistant populations dispersing via the dominant wind to fields in the northeast. There were higher levels of resistance in red fescue (P=0.02) and winter wheat (P=0.04) crop (Figure 5). The association of silky windgrass with winter cereals is well known due to life cycle similarity (Jasieniuk et al. Reference Jasieniuk, Brûlé-Babel and Morrison1996; Massa and Gerhards Reference Massa and Gerhards2011). The lower levels of resistance found in populations originating from other grass seed crops (tall fescue and ryegrass) could be due to lower sampling effort in those crops in our study.
Biotic and abiotic factors evaluated for the spatial pattern of resistance in populations of silky windgrass. Left: dominant wind direction analyzed from linear regression of resistance level on the orthogonal projection of locations on dominant wind vector. Right: crop type analyzed by ANOVA of resistance levels by crop type; p, potato; r, red fescue; t, tall fescue; w, winter wheat.

We accept our first hypothesis, as this study showed that early ALS resistance in Danish silky windgrass populations was caused by NTSR evolution. The second hypothesis concerning spatial gradient of resistance remains elusive. An epicenter pattern was observed in our study, but was not significant. Confirmation of this pattern would require more samples at different sampling scales. Additionally, this study was unable to obtain full field history data (herbicide site of action [SOA] use, herbicide doses, sowing date, soil management, crop rotation before 2013) that would have greatly improved the explanation of the variation in the different herbicide resistance levels and variations in TSR and NTSR frequency. This highlights the difficulty of identifying the plethora of factors involved in assessing the early evolution of herbicide resistance in field populations and the interest for future meta-analyses in this area.
Acknowledgments
The authors thank Henrik Terp for allowing field sampling, Christian A. S. Nielsen and Khalid Mahmood for help with field sampling, and Betina Bendtsen for assistance in the greenhouses. We thank two anonymous reviewers for their comments in improving this article. Funding was provided by Aarhus University, the Danish Council for Strategic Research, and Bayer CropSciences.
Supplementary Material
To view supplementary material for this article, please visit https://doi.org/10.1017/wsc.2017.11