

Cluster evolution and change dynamics occupy center stage in cluster studies.Footnote 1 Exogenous shocks are one of the crucial drivers of cluster evolution and change.Footnote 2 However, the mechanisms and processes through which exogenous shocks affect the cluster dynamics have been relatively underexplored. Another limitation of cluster change studies is that they focus mainly on cooperative dynamics to explain the change in clusters. The cluster’s growth is explained in terms of interfirm cooperation. It is argued that this cooperation generates trust, lowers transaction costs, facilitates knowledge exchange, and fosters innovation.Footnote 3 Similarly, cluster decline is attributed to excessive cooperation among firms in a cluster.Footnote 4 It is argued that excessive cooperation can lead to different types of lock-ins and inertia.Footnote 5 This can hamper adaptability, promote diseconomies of clustering, and lead to cluster decline. Thus, a cluster’s growth and decline are attributed to cooperation among the cluster’s firms. This paper addresses the above two limitations in cluster change studies and develops a conflict theory of cluster change. It analyzes cluster change in terms of change in the cluster’s actors, activities, and structure.Footnote 6 It asks the following questions: How does an exogenous shock affect a cluster’s actors, activities, and structure? What are the mechanisms through which exogenous shock affects cluster dynamics? In addressing these two questions, this paper brings attention to the conflict dynamics in a cluster that arises out of heterogeneity of actors, diversification of cluster activities, and fragmentation of the cluster structure.
The current paper studies the cluster changes in Howrah foundries from 1914 to 1947. This period was dynamic, witnessing the two World Wars and the beginning of Indian independence. The exogenous shock of two World Wars triggered widespread changes in the Howrah foundry cluster. The interwar period of 1919 to 1939 was a period of relatively stable growth. India’s independence in 1947 led to wide-ranging macrolevel changes in Indian industries. The year 1947 thus represents a qualitative break in the evolution of the Howrah foundry cluster and marks the end point of this study.
The study makes two significant contributions to cluster change dynamics. First, it uncovers the mechanisms through which exogenous shocks affect the cluster. The two World Wars precipitated the macrolevel political shocks in the current case. These shocks led to regulatory changes and increased demand for foundry products. As a result, new actors (firms) entered the foundry cluster. Conflicts arose between the new group of small firms represented by Indian owners and large incumbent firms represented by European owners. The formation of rival industry associations formalized the conflict and led to the fragmentation of the cluster. The two World Wars further led to an increase in stress in the cluster. Laborers agitated for an increase in wages due to price rises. The creation of trade unions led to the formalization of these laborer-management conflicts. Thus, the political shock led to a change in regulations, the entry of new actors, conflicts among actors in the cluster, and cluster fragmentation. Secondly, this paper highlights the dynamics of cluster governance during exogenous shocks. Industry associations are central actors governing the activities in a cluster.Footnote 7 They facilitate coordination and cooperation among member firms. They also act as bridge actors and promote collaboration with external actors. The present study shows that the bridging activity of industry associations will increase during periods of relative instability driven by exogenous shock. In the current case, industry associations facilitated collaboration between cluster firms and government agencies. The industry associations were the primary channels through which macroactors such as governments engaged with the cluster. The study further shows that exogenous shocks could lead to the emergence of rival industry associations. Rival associations lead to the equitable distribution of opportunities but can also foster group-level conflicts in the cluster.
This paper further contributes to the literature on Indian business history. It offers a microglimpse into the challenges and tribulations of industrialization in India and sheds light on the growth dynamics of small-scale industries. Large industries have been the prime focus of Indian business history literature.Footnote 8 Specifically, the economic history of Bengal has paid more attention to the large-scale jute industryFootnote 9 to the neglect of small-scale engineering and foundry industries. This paper addresses this oversight. This study also highlights the changing community structure of entrepreneurs in Howrah. Ownes and Nandy documented that during the postindependence period, the Mahisya community were the dominant entrepreneurs in the Howrah district.Footnote 10 However, the paper shows that multiple communities contributed to Howrah’s industrial growth during the preindependence phase. These included Europeans, Marwaris, and Bengali Kayastha, Brahmin, and Baidya communities.
The paper is divided into five sections. The first section reviews the relevant cluster literature. The second section gives a glimpse of the research context and data sources used in the study. The third section provides details about the findings. Macrolevel exogenous shocks and their impacts on the Howrah foundry cluster are the focus of this section. We have divided the findings into three phases to make the narrative more tractable. Phases I, II, and III correspond to World War I, the interwar years, and World War II, respectively. The fourth section discusses our contribution to cluster change studies and Indian business history. The fifth section concludes the paper by summarizing the findings.
Literature Review
Clustering phenomena have existed for centuriesFootnote 11. Alfred Marshall was one of the pioneering figures who brought attention to the localization of industries and industrial clustersFootnote 12. More recently, studies on Italian industrial districts have reinvigorated scholarly interest in industrial clusters.Footnote 13 The initial interest in industrial clusters was focused on the positive aspects of clustering and economies of localization. It was argued that cooperation among firms in a cluster generated trust lowered the cost of transactions, facilitated knowledge exchange, and promoted innovation.Footnote 14 Later studies highlighted the disadvantages and diseconomies of localization. Scholars attributed the diseconomies of clustering to four different types of lock-ins or inertia: functional, cognitive, structural, and political.Footnote 15 Functional inertia exists at the dyadic level, cognitive and structural inertia operates at the cluster level, whereas political inertia works at the extracluster level. The lack of adaptability and diseconomies of clustering was explained in terms of excessive cooperation at different levels in the cluster. The focus on the diseconomies of clustering also brought attention to the phenomenon of cluster decline. As a result, the static view of successful clusters was supplemented by a dynamic and evolutionary perspective.Footnote 16
Cluster change and dynamism now form an essential part of cluster studies. Scholars have developed several frameworks to study the dynamism and change in clusters. Popp and Wilson brought attention to the agency of cluster actors, macrolevel context, and resource reordering as factors of cluster change.Footnote 17 Martin and Sunley conceptualized clusters as a complex adaptive system and pointed to several factors that could determine its trajectory of change.Footnote 18 They highlighted the role of resources (such as knowledge and capital), associated institutions, and interfirm dependencies in cluster change. Wilson and Singleton brought attention to the competitive dynamics in facilitating cluster change.Footnote 19 They characterized clusters as “cooperative competitive” systems consisting of heterogeneous actors. As against the standard understanding of clusters as a cohesive system, they brought attention to the fragmented nature of clusters where different groups try to dominate each other. Fornahl and colleagues drew upon these earlier models and conceptualized cluster change as an interaction between actors, networks, and institutions.Footnote 20 The actors are the cluster’s individuals, firms, and public organizations. Networks are interconnections between different actors. Institutions are the overall social environment of the cluster. This includes the regional culture, cognitive frames, and the state (its policy, legislations, and organizations). The present study draws upon the above models and analyzes the change in the Howrah foundry cluster in terms of interaction between actors, their activities, and the cluster structure. The study further points to group-level competition as one of the mechanisms of cluster change.
Exogenous shock is another crucial mechanism of change in industrial clusters.Footnote 21 Different studies have analyzed the impact of economic, technological, and political shocks on actors, activities, and structures in clusters. Scholars have argued that economic shocks lead to a decrease in demand. This leads the cluster firms to focus on core activities.Footnote 22 It further leads to decreased organizational founding and employment rates in the cluster. In other words, economic shocks lead to a decrease in the entry of new actors or firms in the cluster. Lane argued, in the context of small potteries of North Staffordshire (England), that during tightening economic conditions, new firms in a cluster would likely arise from interfirm collaborations among existing firms.Footnote 23 Researchers have further explored the effect of economic shocks on cluster structure. Skålholt and Thune showed that economic shocks would increase interfirm cooperation. Bowden and Higgins analyzed the differential impact of the political shock on British cotton and wool textile clusters, respectively.Footnote 24 They showed that the British cotton textile cluster integrated with the formation of the Lancashire Cotton Corporation, an amalgamation of 100 firms, to deal with the shock of World War I. On the other hand, the woolen textile cluster witnessed cluster dissolution with the weakening of existing industry associations and individual firms acting independently. Similarly, Popp showed that a British chemical cluster merged due to a technological shock.Footnote 25 Firms in the cluster organized themselves into a single firm to deal with the challenges arising from the technological shock.
We extend the work of the above scholars and study the impact of the exogenous political shock on the entry of new actors (i.e., firms), activities, and structure in a cluster. Extant studies have primarily analyzed the impact of demand-constricting economic and technological shocks on clusters. However, exogenous shocks may also lead to demand creation and expansion. Further, political shocks have a multidimensional effect on cluster development compared with technological or economic shocks. Political shocks may lead to legislative changes and demand creation and may challenge the dominance of incumbent actors in the cluster. Therefore, this study focuses on the effect of political shock (i.e., war) on government regulations, its impact on demand, and the cluster’s structure, activities, and actors.
Context and Data
Research Context
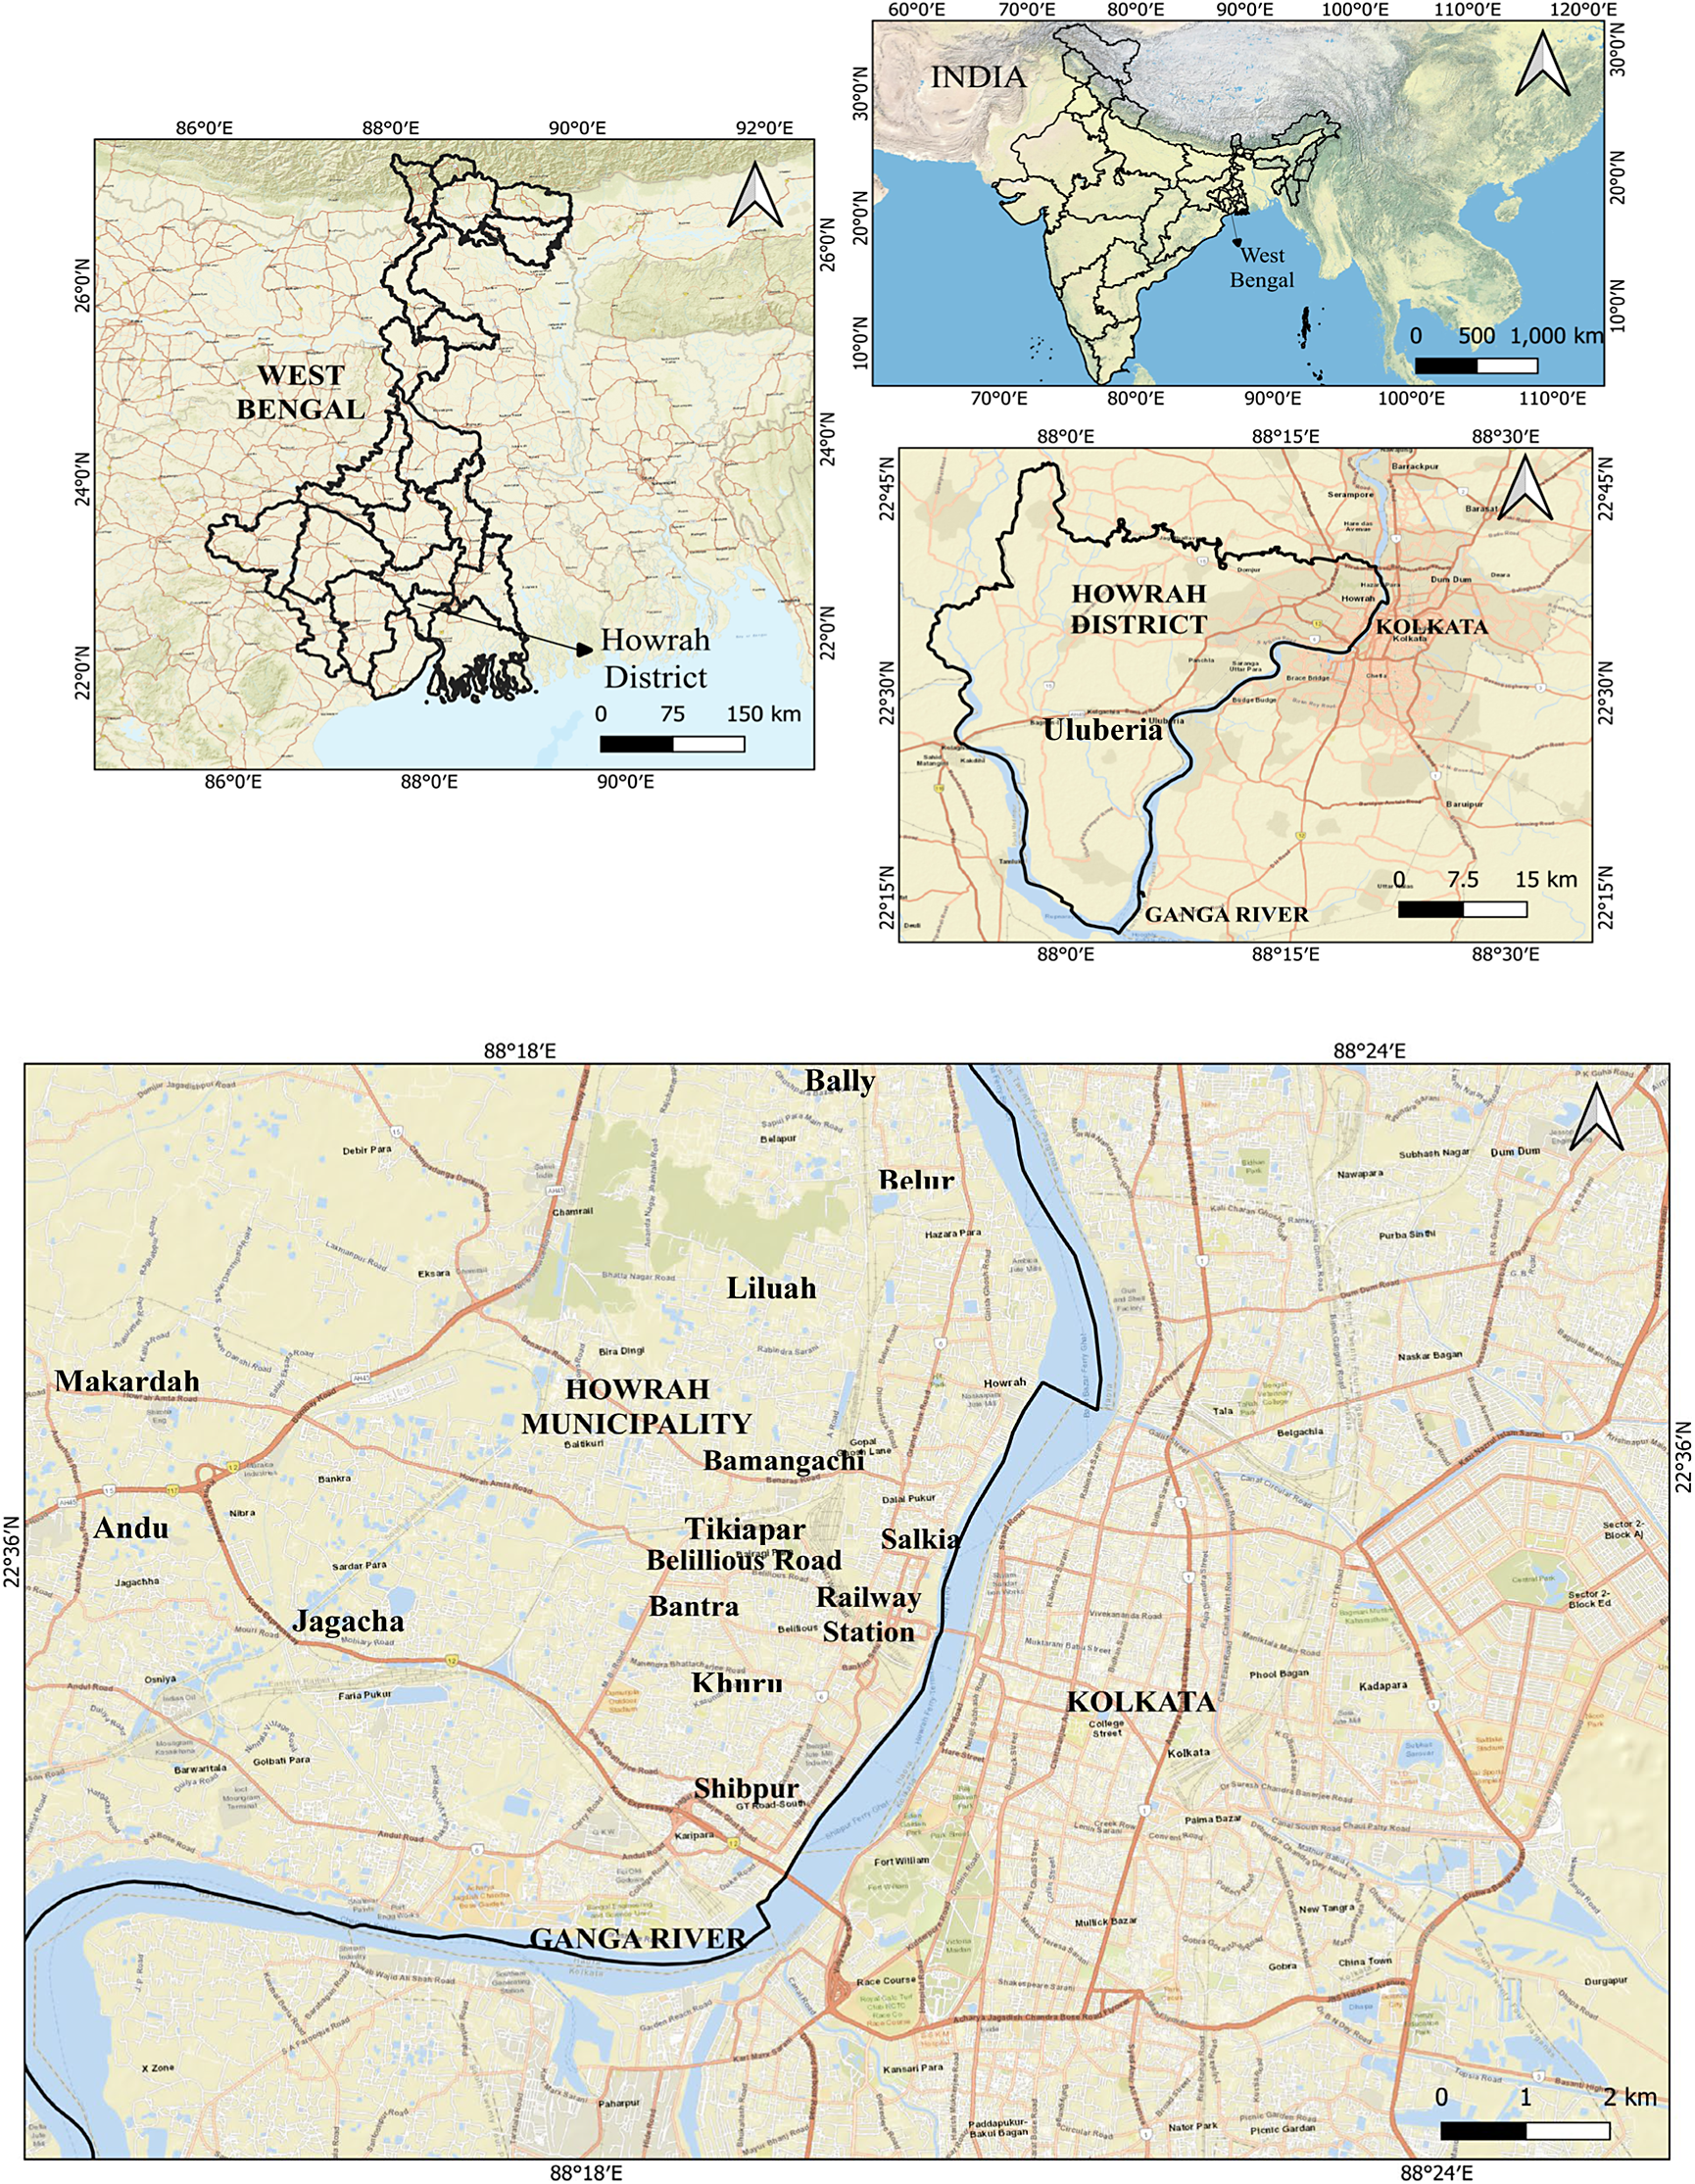
The current study analyses the process of change in the Howrah foundry cluster. Howrah is Kolkatta’s twin town (the West Bengal state’s capital). It is located on the banks of the Hooghly River. It emerged as an industrial town by 1947. The foundry industry is an essential part of Howrah’s industrial landscape. The industry is located along a five-kilometer stretch, from Bamungachi to Bantra, around the Howrah railway station. Figure 1 below depicts the foundry industry centers in the Howrah district.
Major centers of foundry industry in Howrah.
Note: Howrah district is divided into sixteen administrative units.Footnote 26 Howrah Municipality has been the most urbanized unit in the district. The foundry cluster is concentrated in this administrative unit in centers such as Bantra, Salkia, Belilious Road, Bamangachi, and Shipbur.

Data Sources
The two primary data sources used in the paper are Large Industrial Establishments in India (hereafter, LIEI) and Thacker’s India Directory (hereafter TID). LIEI was a biennial government publication from 1911-1949. After that, it was published annually from 1950-1958. Subsequently, it was published after a gap of eight years in 1966. Its last issue came in1978. LIEI contained a list of factories active in the particular year, classified by industry, province (later states) and district. TID was a private publication of Thacker, Spink & Co. It was published annually from 1864-1960. The editions from 1864-1884 covered only the Bengal presidency and were titled Thacker’s Bengal Directory. It contained a host of information. The most significant sections for our purpose were (1) Calcutta commercial, (2) Commercial Industries (Iron Works) and (3) Trades and Professions (Engineers and Iron Founders/ Iron Founders). The Calcutta commercial contained a list of Calcutta’s factories,their address and products. The other two sections included a list of iron works (or iron foundries) in India. In the earlier editions of TID, section 3 had a more exhaustive list of iron foundries. However, from 1915 onwards, section 2 contained a more thorough list of iron foundries. We used LIEI and TID to create a database of the Howrah iron foundry firms.
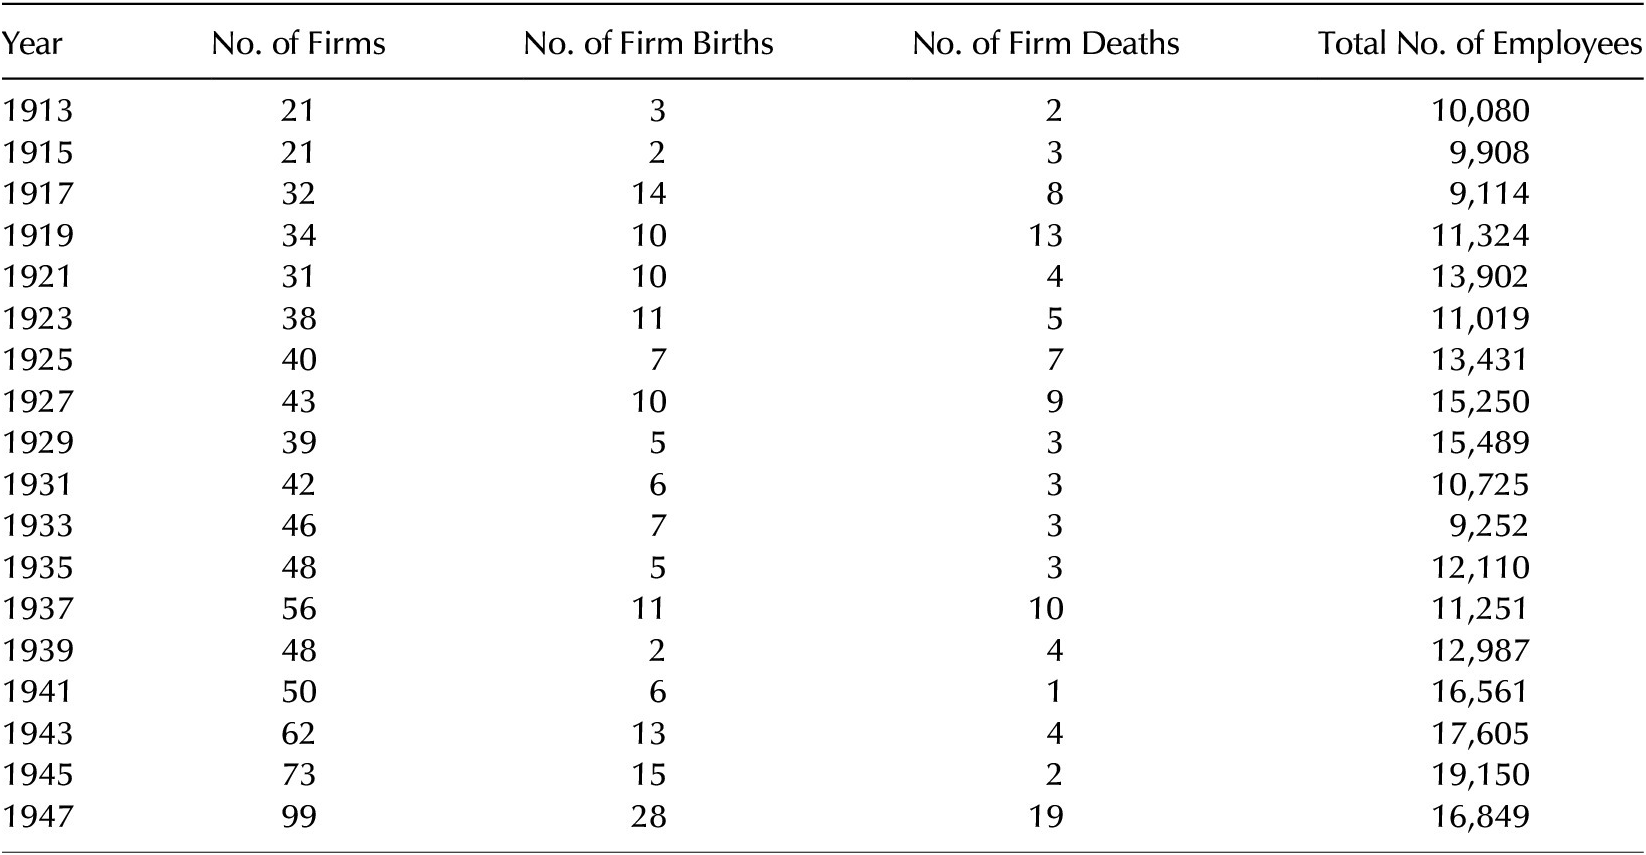
A firm was active in a particular year if it was mentioned in either of the two sources. Thus, the total number of firms in a specific year is the union of the number of firms mentioned in LIEI and TID. A firm was assumed to be born in a particular year if it was mentioned in either of the sources but not in the previous edition (published two years before) of these sources. For example, if a firm X is mentioned in either LIEI or TID of 1915 but is not mentioned in LIEI or TID of 1913, it is considered to have been born in 1915. Similarly,a firm was considered to have died in a particular year if it was either mentioned in LIEI orTID of that year but not in the next edition (published two years after) of either LIEI or TID. For example, if a firm X is mentioned in either LIEI or TID of 1915 but not in LIEI or TID of1917, it is considered to have died in 1915. There is a possibility that a firm mentioned inLIEI or TID of year X was born in the preceding year X -1 (i.e. a firm assumed to have been born in the year 1915 was born in 1914). The same possibility holds for the year in which a firm died. However, since LIEI, which provided an official and more exhaustive list of foundries, was published biennially, we relied on a biennial count of firm births and deaths for our analysis (see Table A3a in Appendix).
The firm’s size is equal to the number of workers it employs. LIEI provided the data on the number of workers. The address of most of the firms up to the post officeFootnote 27 (i.e. zipcode) level is mentioned in LIEI. The TID also contains the address of firms up to the post office (i.e. zip code) level. This was used to determine the number of firms in a particular area (Belillious Road, Salkia, Bamangachi or Shibpur).
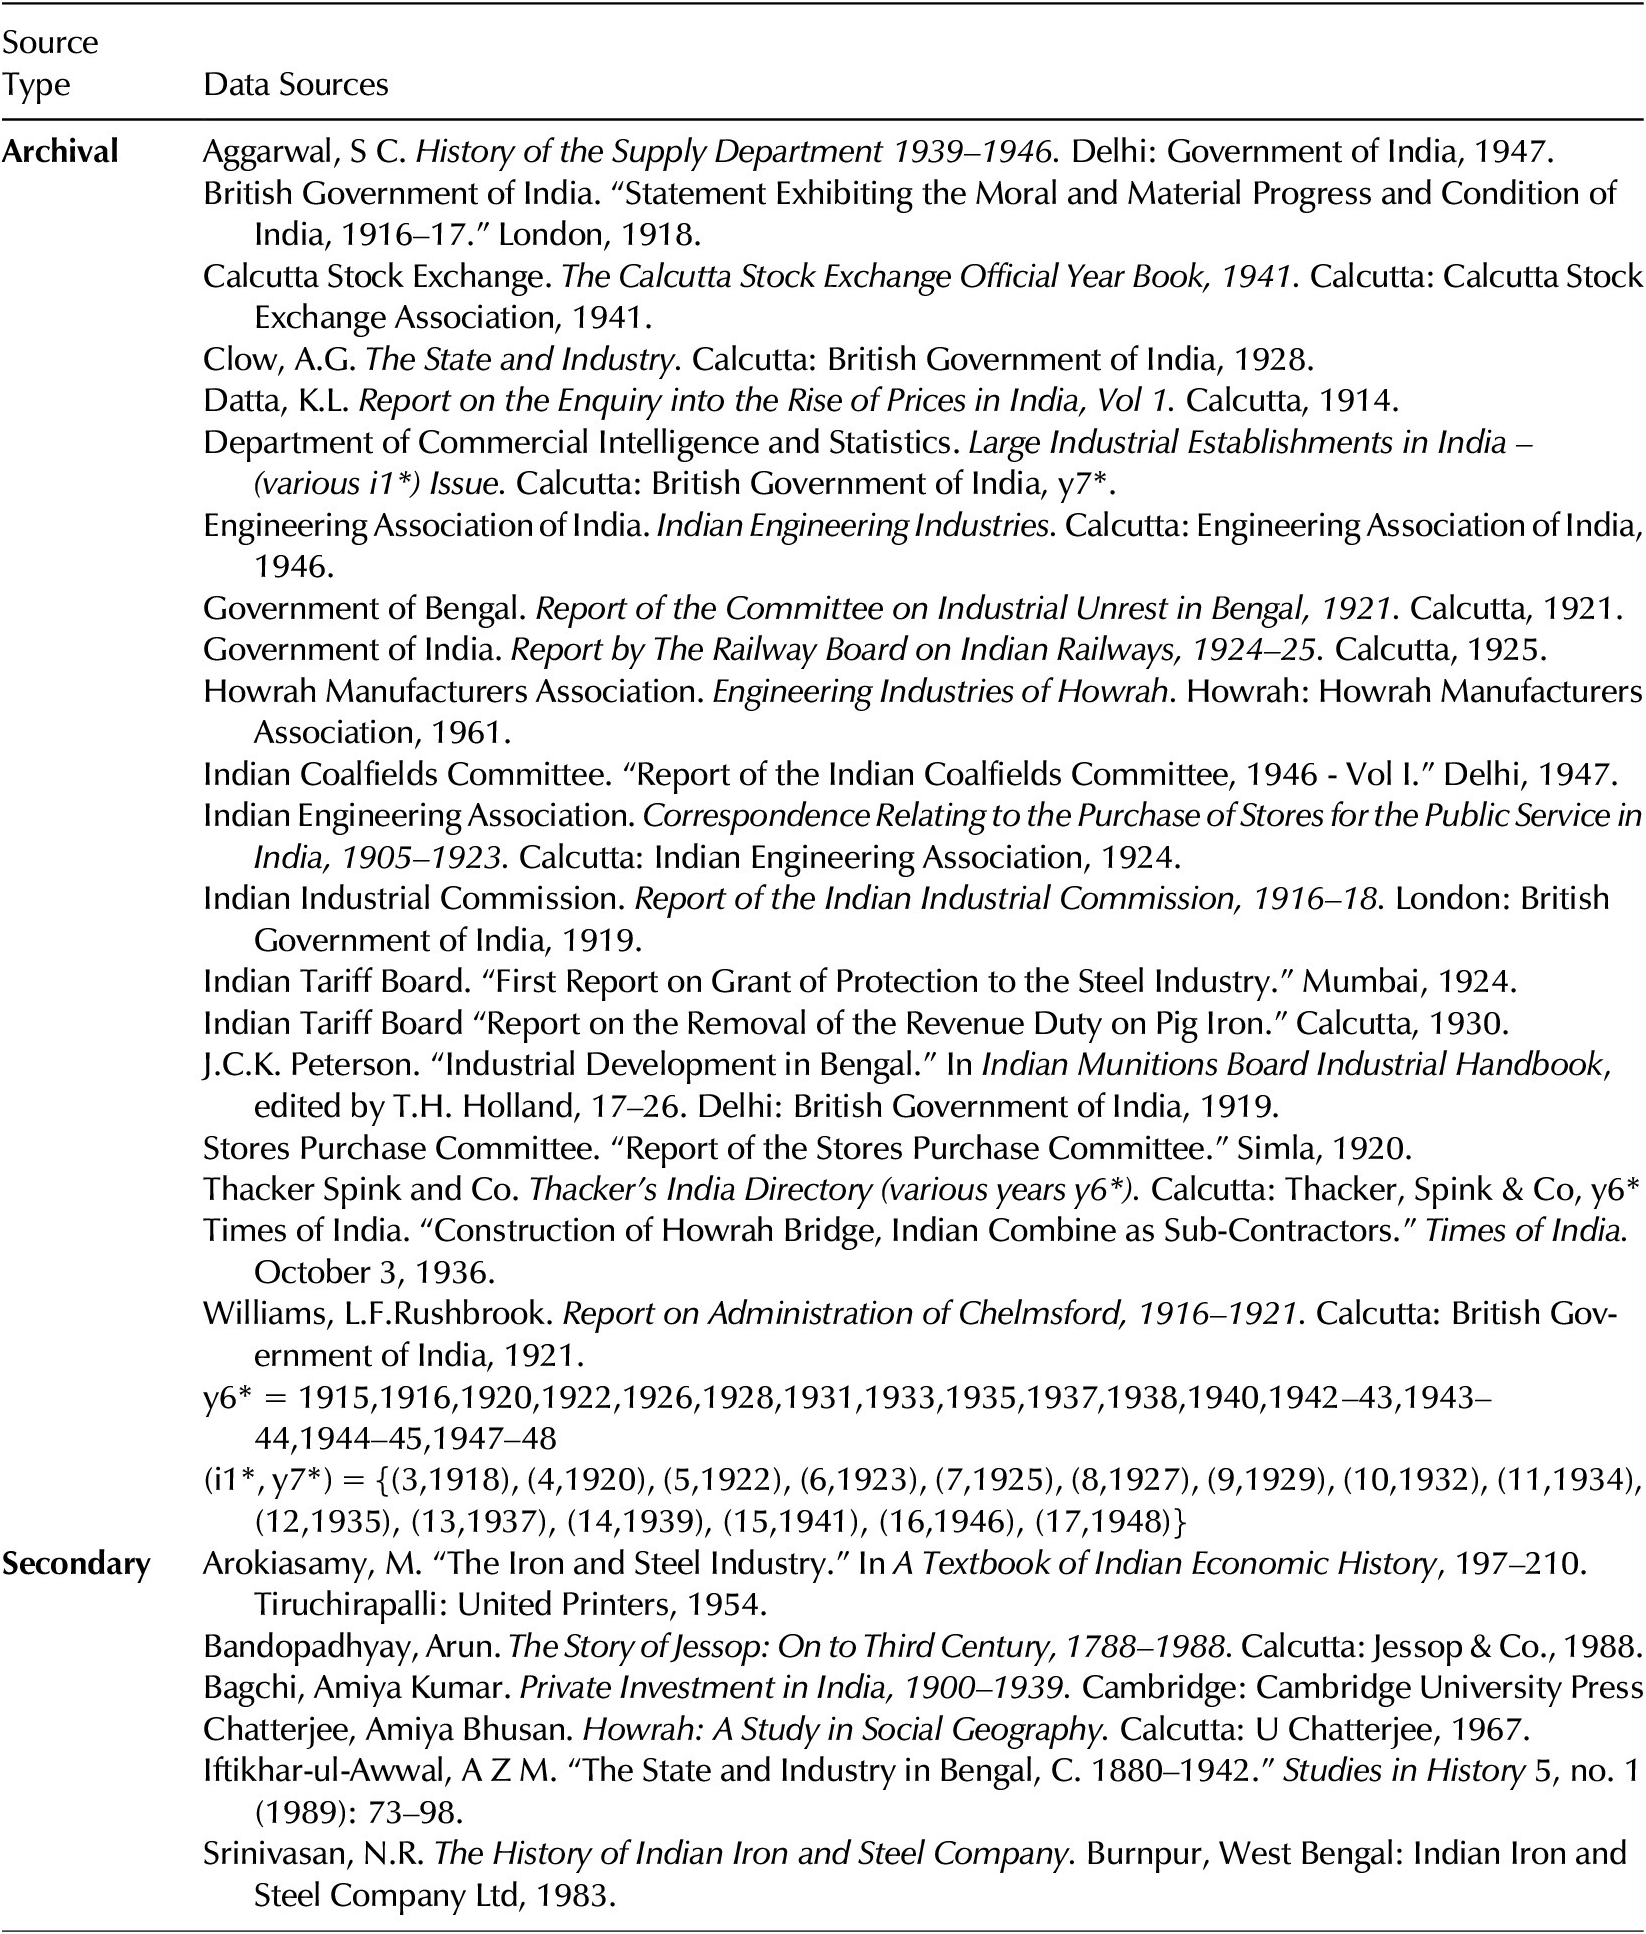
Apart from LIEI and TID, we consulted historical works related to Howrah’s industrial development. These included organizational histories, industry association archives, government publications and secondary sources. Organizational histories included History of the Supply Department, 1939-1946 and The Story of Jessop: On to Third Century,1788-1988. Though focussed on individual organizations, these organizational histories also provided contextual details about Howrah’s industrial development. The publications by industry associations included Engineering Industries of Howrah, and Indian Engineering Industries. These were published annually by the Howrah Manufacturer’s Association and the Engineering Association of India. The Correspondence Relating to Purchase of Stores published by the Indian Engineering Association provided valuable details on the foundry and engineering industry’s development from 1905 to 1923. Government reports such as the Indian Tariff Board reports, the coalfields committee and the stores’ purchase committee report provided insight into the policy changes. A crucial secondary source, Howrah: A Study in Social Geography, provided a glimpse into Howrah’s overall industrial development. Table A4 in the Appendix lists all these sources.
Findings
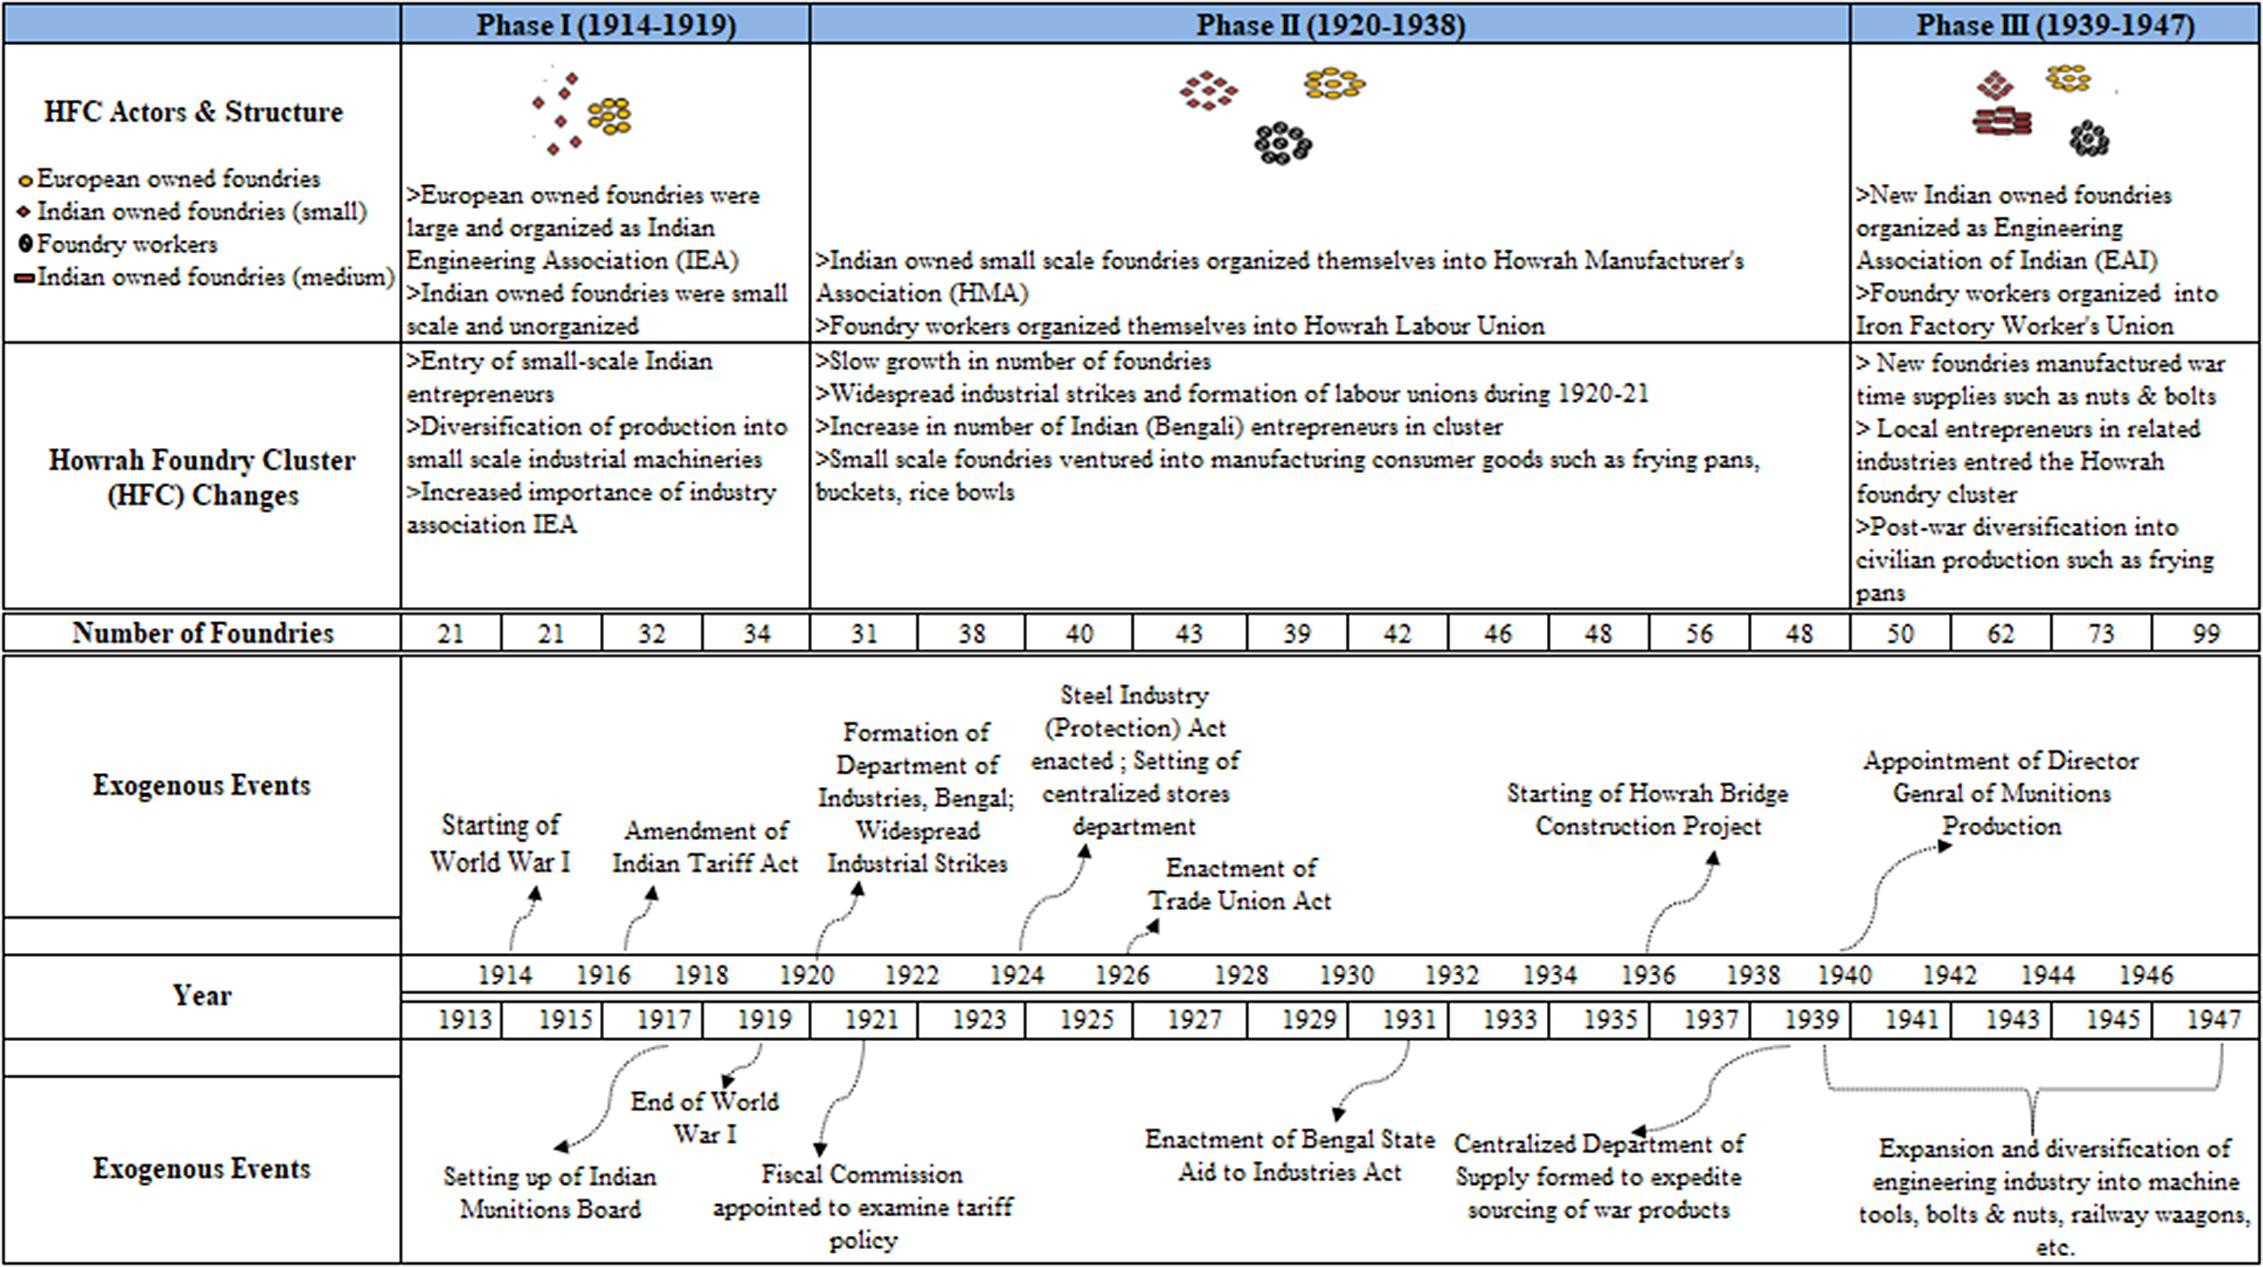
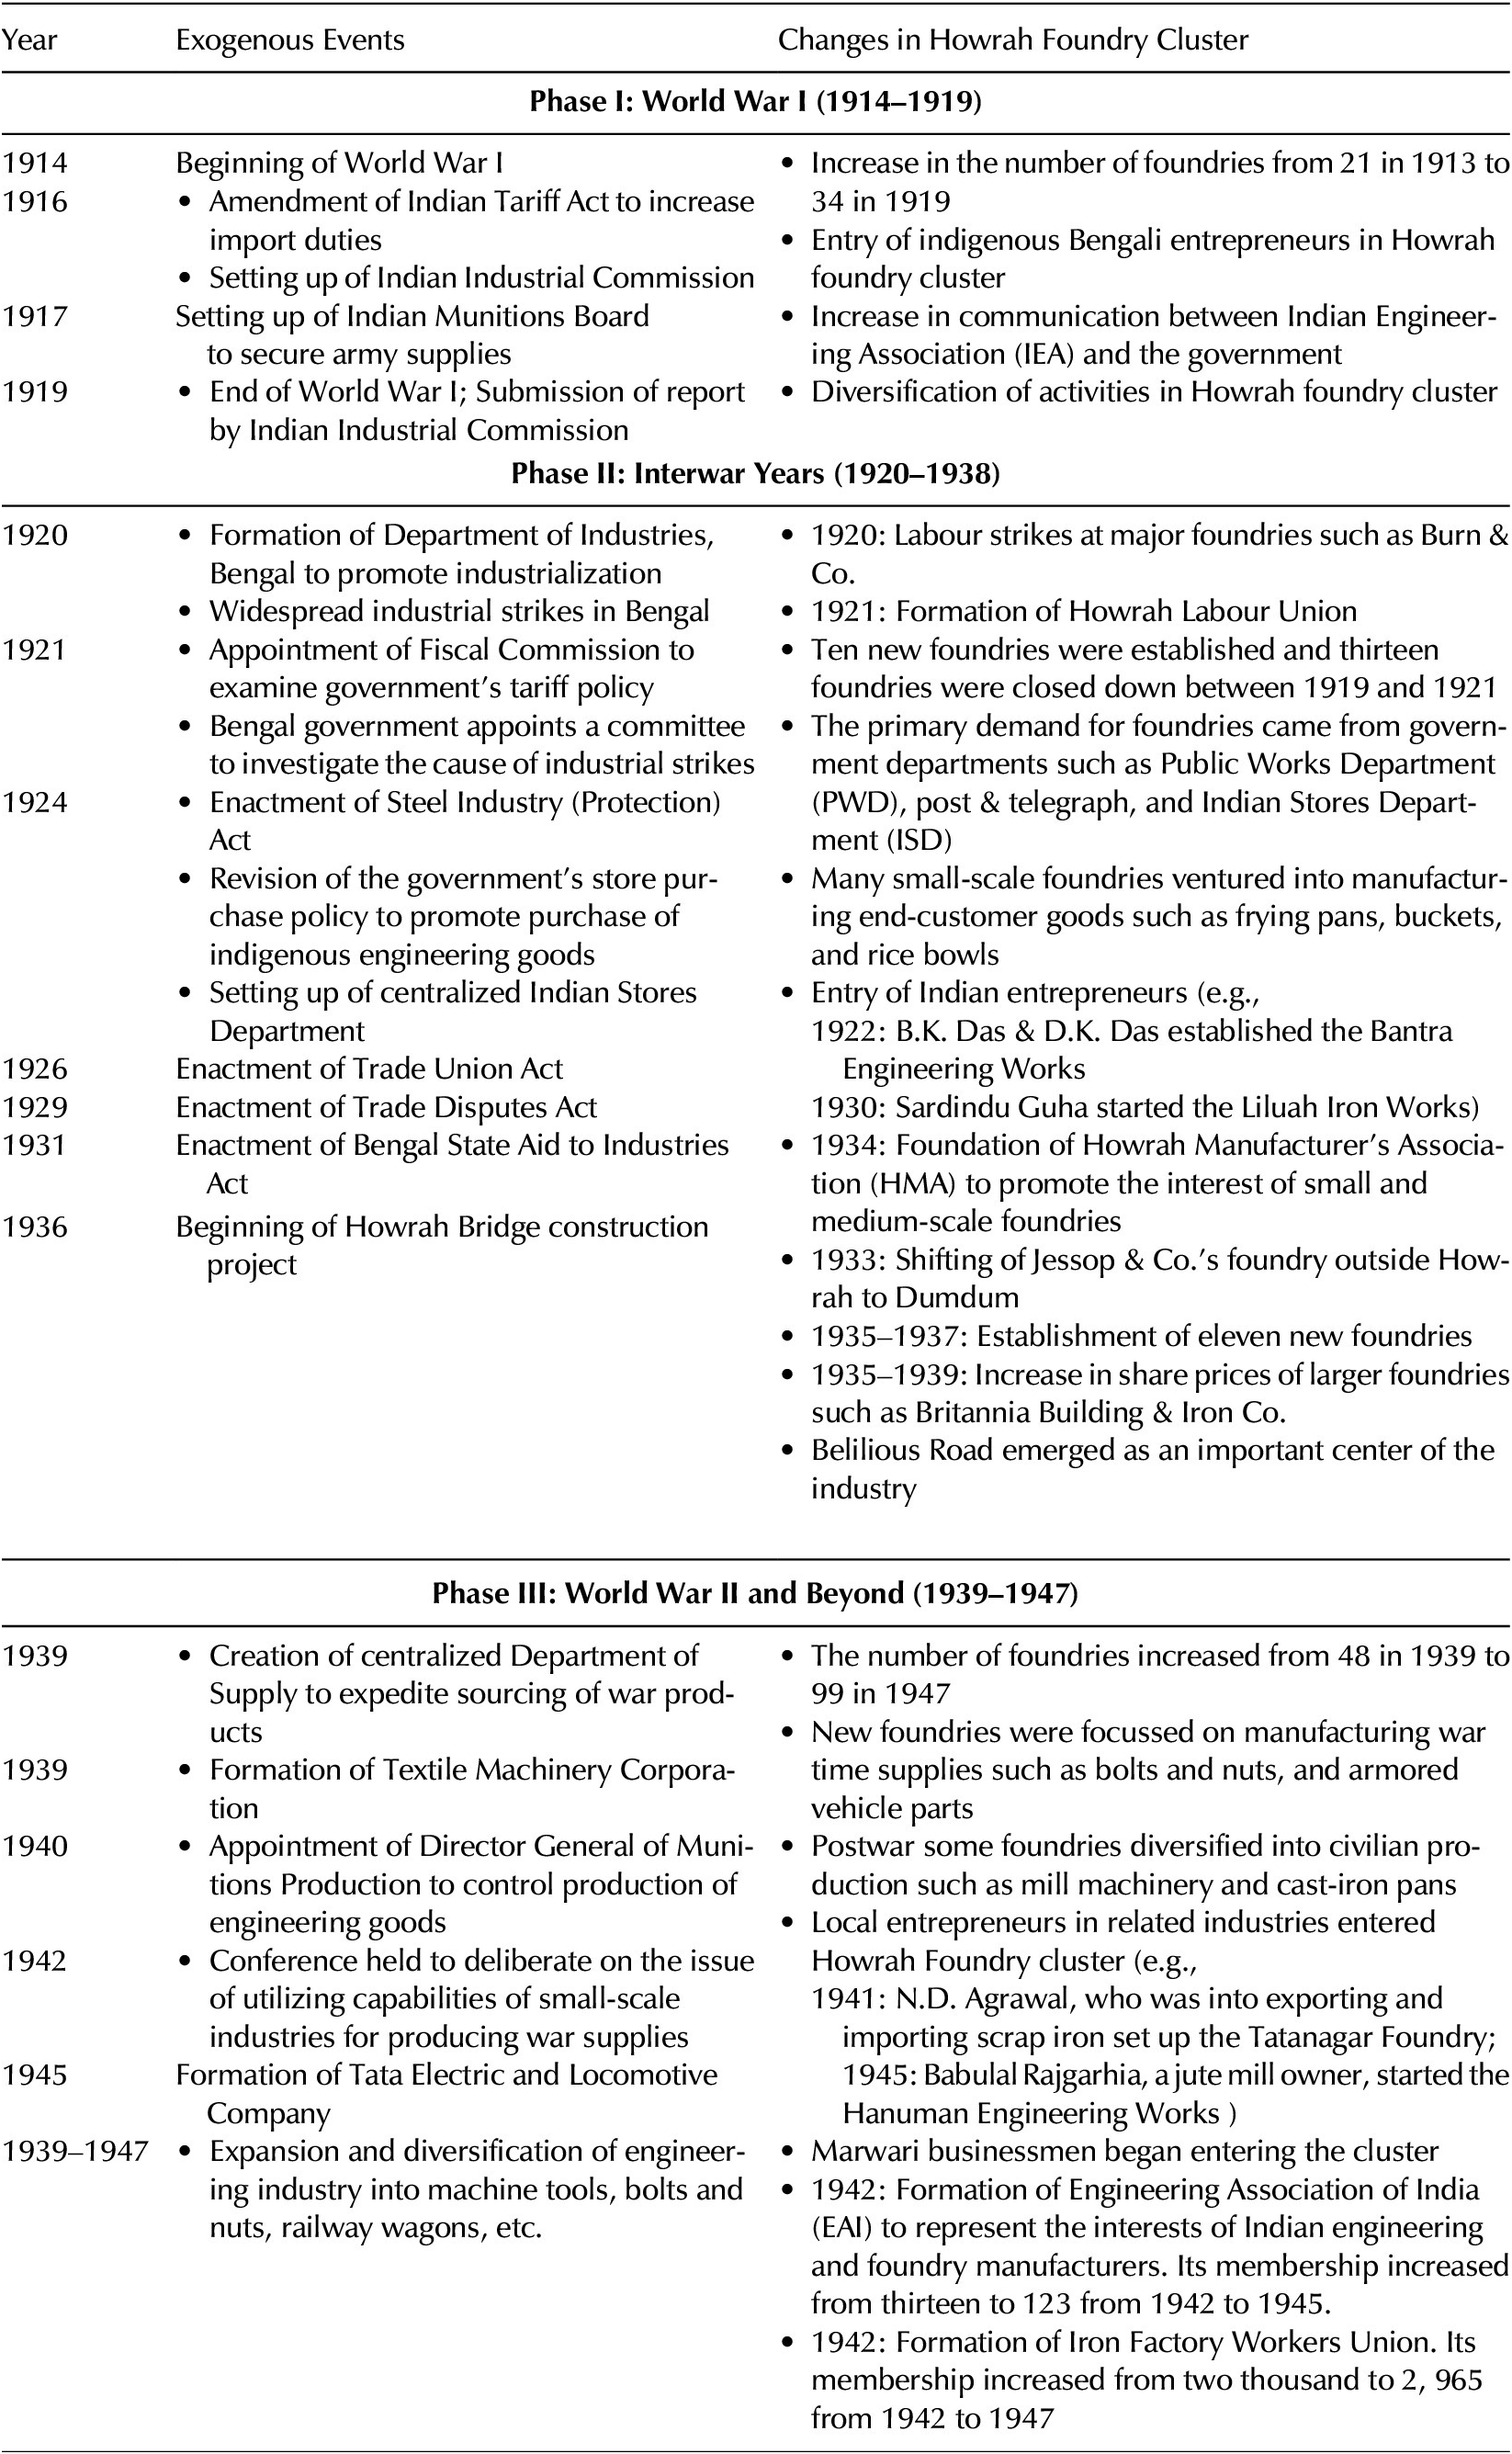
This section gives a detailed account of the changes in the exogenous environment of the Howrah foundry cluster and its impact on the cluster. We consider the three specific parameters characterizing the exogenous environment: the regulations, demand for foundry products, and raw materials for foundries. We analyze the impact of these exogenous factors on the internal dynamics of the Howrah foundry cluster, namely the change in actors (firms), activities, and cluster structure. Figure 2 summarizes the crucial exogenous events and their impact on the Howrah foundry cluster.
Changes in the Howrah Foundry cluster, 1914–1947.

Phase I (1914–1919): World War I and the Howrah Foundry Cluster
The exogenous shock of World War I led to wide-ranging changes in the exogenous environment of the Howrah foundries. There were sudden and widespread changes in industrial regulations, the availability of raw materials, and the demand for foundry products. The war led to the introduction of industry-friendly policies, the encouragement of raw material suppliers to set up factories, and increased demand for foundry products due to wartime requirements. These sudden changes brought about changes in actors, industrial activities, geographical spread, and structure of the Howrah foundry cluster.
Indian entrepreneurs ventured into the cluster, which European firms then dominated. Most of the firms established by Indian entrepreneurs were small-scale in nature. The existing and new firms brought about a qualitative change in the industrial activity of the Howrah foundry cluster. Before World War I, most Howrah region foundries focused on shipbuilding, ship repair, and structural engineering. Due to import restrictions and wartime demands, firms in the cluster diversified into manufacturing new products such as jute presses, lathes, hydraulic presses, and colliery equipment.
The industry further expanded to new geographical areas in the Howrah district. Before the war, most of the firms were located near the riverbank in the Salkia area. After the war, the industry expanded to new areas such as Bantra, Bamangachi, and Belilious Road. There were multiple reasons for this expansion. One reason was the shift in industrial activity within the cluster. The cluster mainly focused on shipbuilding and ship repair, and it made sense for the firms to be located near the river bank. Since shipbuilding ceased to be the main activity in the cluster, the newer firms expanded to less congested nearby areas such as Bantra, Bamangachi, and Belilious Road. The new geographical centers were located near the Howrah railway station. Since railways had emerged as a medium of goods transport by this time, being located near the Howrah railway station facilitated the transport of finished products. Furthermore, many entrepreneurs owned land in the Bantra and Bamangachi areas, prompting them to start proprietorship firms there.
Most of these new firms were small-scale and worked on contracts from the larger firms. Thus, a vertical differentiation emerged in the cluster due to the exogenous shock of World War I. The larger firms in the cluster had already organized themselves into an association known as the Indian Engineering Association (IEA). The association became more active during the war. There was an increase in the lobbying efforts by the IEA due to the opportunities created by increased wartime demand. This led to favorable policy changes. The importance of the association increased during the war as it was the only reliable channel for exchanging information between the firms in the cluster and the outside agencies.
Exogenous Factors Affecting the Cluster
Change in Regulations and Policies
World War I had far-reaching implications for India’s industrial development. There was a gradual shift in the laissez-faire policy, driven by war requirements. The Indian Tariff ActFootnote 28 was amended in 1916 to increase the ad valorem import duty from 5 to 7.5 percent. The import duty on certain iron and steel products also rose from 1 to 2.5 percent.
However, more important from a long-term perspective was the appointment of the Indian Industrial Commission (IIC) in 1916 to suggest measures for further industrial development in India.Footnote 29 The Commission submitted its report in 1919. It recommended the establishment of a centralized Indian Stores Department and a provincial Department of Industries. Establishing a centralized stores department that could scrutinize the indents for stores before sending them to the India Office in London had been a long-drawn demand of the Indian engineering industry.Footnote 30 This was expected to encourage the purchase of Indian products by the government, the largest consumer of engineering goods, thus boosting the growth of the engineering and foundry industry.
Change in Demand
The war made obtaining supplies such as munitions, railway rolling stock, and engineering goods from Europe difficult. There was a lack of Indian enterprises that could manufacture these goods. This forced the government to seriously consider industrial underdevelopment in India. An Indian Munitions Board was set up in 1917, primarily to secure the supplies for the army and develop the industries in India.Footnote 31
Change in Raw Material Supply
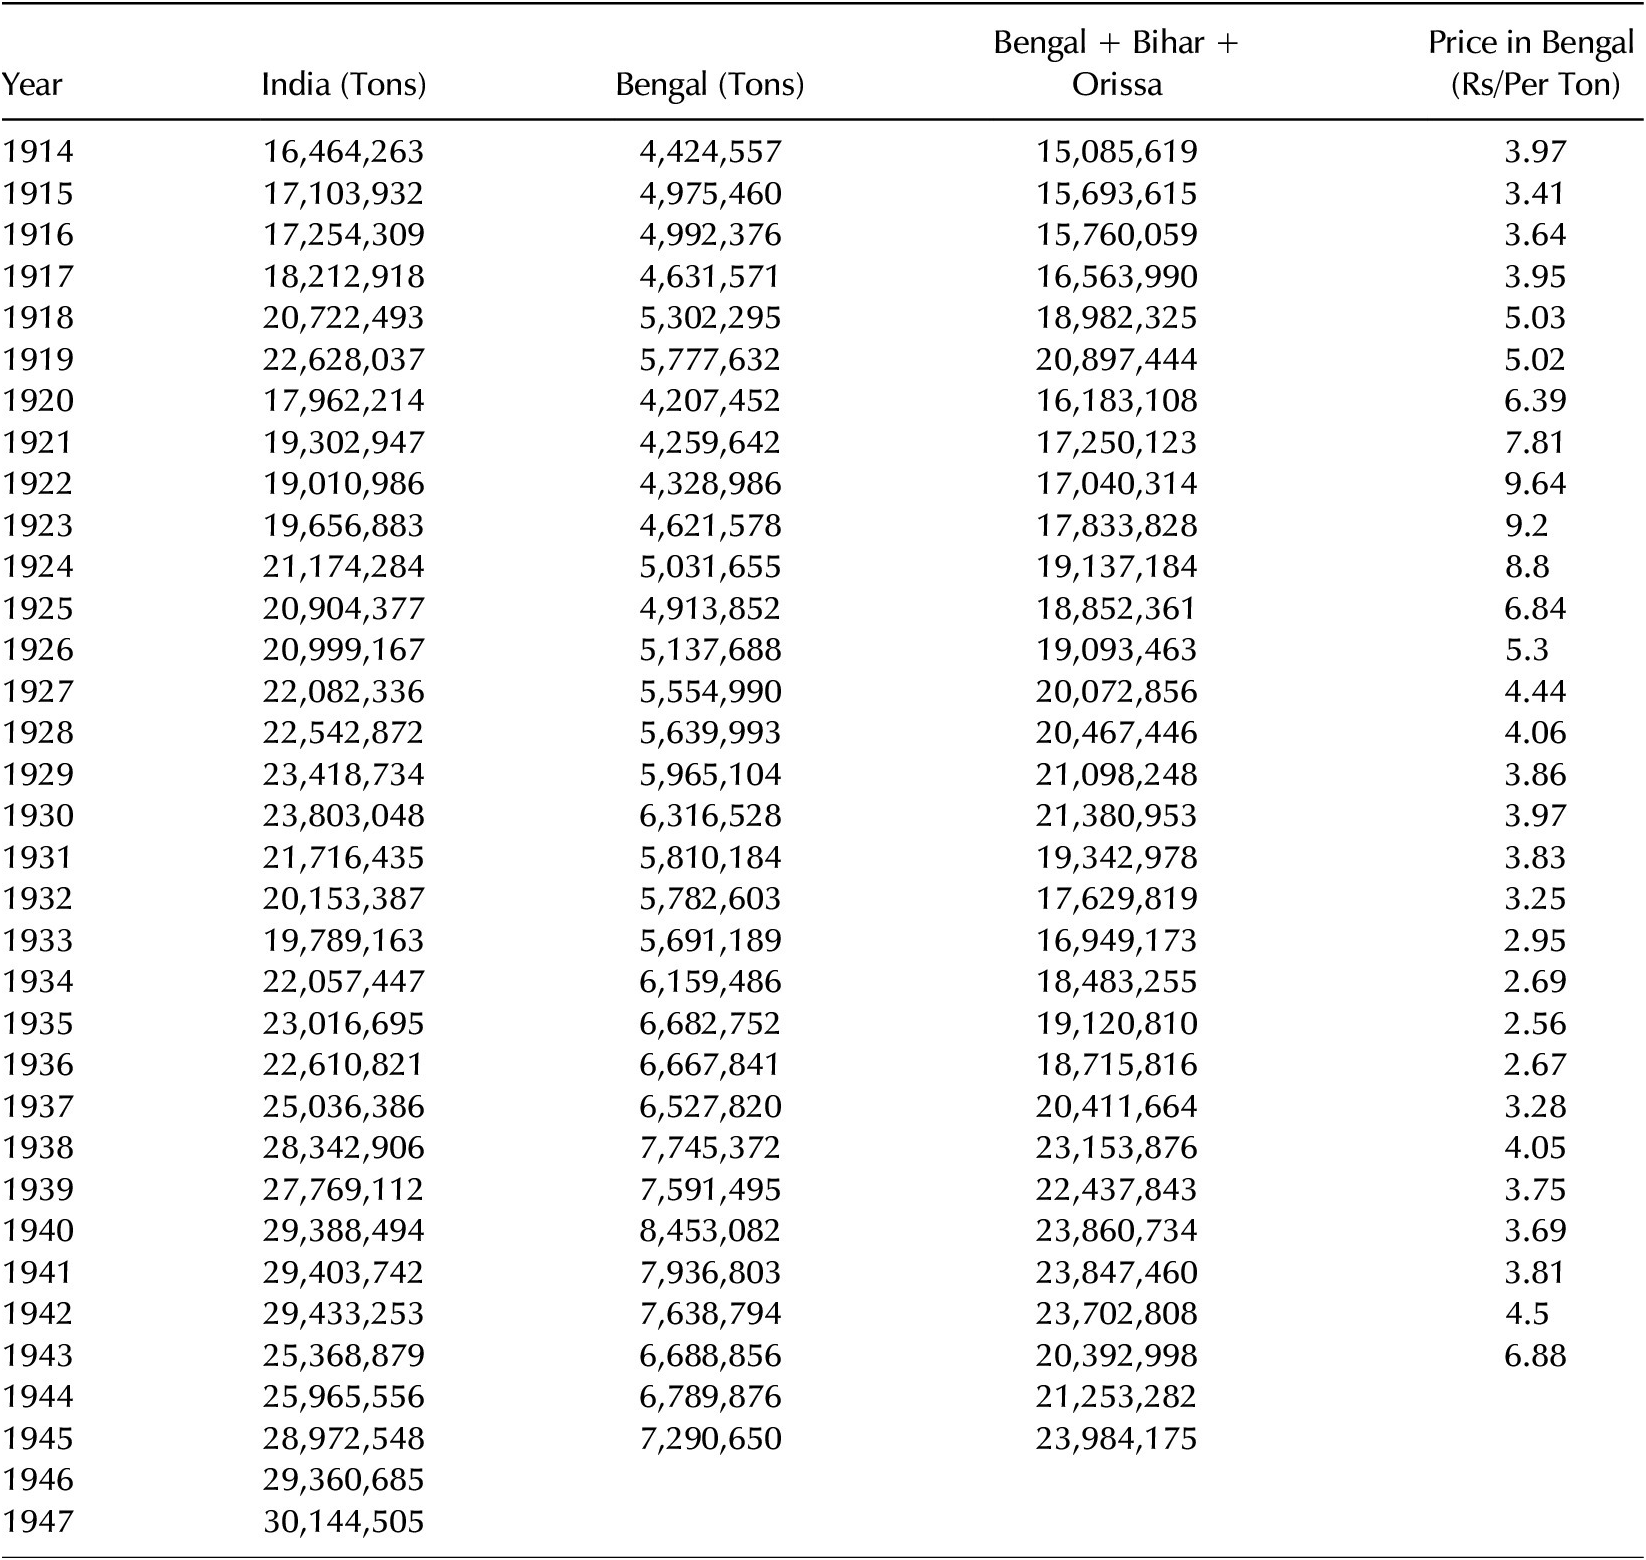
It was only a year before the war that the Tata Iron and Steel Company (TISCO), located in JamshedpurFootnote 32, started the production of pig iron and steel.Footnote 33 The war became a boon to TISCO, creating more than enough demand to engage its works. The only other company producing pig iron during the time was the Bengal Iron Company (BIC)Footnote 34. It also made cast iron pipes, railway sleepers, and miscellaneous castings.Footnote 35 The war created a massive demand for these products. During this period, 6000 vehicles, 200 engines, 1800 miles of rail tracks, and 13,000 feet of bridgework were sent out of India to different war locations in Mesopotamia, East Africa, and Palestine.Footnote 36 TISCO and BIC contributed the bulk of this production. This was reflected in TISCO and BIC’s high pig iron production levels.Footnote 37 The output of other principal raw material, coal, rose from 16,464,263 tons in 1914 to 20,722,493 tons in 1918.Footnote 38
Changes Within the Howrah Foundry Cluster
Change in Actors
The favorable conditions created by World War I led to the setting up of new foundries in Howrah. Most of these foundries were small-scale and established by Indian proprietors. Before the breakout of the war in 1913, twenty-one foundries in Howrah employed 10,060 workers.Footnote 39 Ten were owned by European managing agencies or proprietors, eight by Indian proprietors, one by an Indian partnership, and two by Indo-European managing agencies. The war increased the number of foundries from twenty-one in 1913 to thirty-four in 1919.Footnote 40 The number of people employed in these firms increased from 10,060 in 1913 to 11,324 in 1919. Several new foundries were established during this period. Two new foundries, owned by Indian proprietors, were established in 1915. Fourteen and ten new foundries were established in 1917 and 1919, respectively. On average, the firms born in 1917 and 1919 employed thirty-eight and forty-eight workers, respectively.
Almost all the firms active at the end of this period were proprietary concerns. The two exceptions—Dey, Kundu & Co. and Star Iron Works—were partnership firms. Both the proprietary and partnership concerns were established by Indians (Bengalis). Most proprietors belonged to the Bengali Kayastha, Brahmin, and Baidya communities. Almost all the new firms were jobbing foundries and were sustained by orders from larger firms.Footnote 41
Change in Cluster Structure
As many foundry products could not be imported, some firms diversified horizontally and began manufacturing foundry products catering to different industries. The cluster growth was driven mainly by the entry of indigenous Bengali entrepreneurs. Most of these entrepreneurs started at the lower end of the value chain by establishing jobbing foundries that worked on contracts received from bigger firms. Thus, there was also vertical differentiation during this phase of cluster growth.
The Indian Engineering Association (IEA) was the only association representing the foundries in the Howrah district. It was also connected to influential industry associations like the Bengal Chamber of Commerce. The local purchase of government stores had been a long-time demand of the Association because the government was the largest consumer of foundry and engineering products. The government, in principle, agreed to the request. However, technical intricacies—such as lack of inspection facilities, modalities of simultaneous tendering, and price comparison of stores manufactured in Britain and India—hindered the local purchase of stores. The Association regularly highlighted these roadblocks in its communications to the government’s Department of Commerce and Industry Secretary. The Association also publicized its grievance through the local press and published articles on the lack of assistance to local industries in reputed magazines. All these efforts led to a slow but definite change in government policy. A perusal of the communication records between the IEA and the government shows that these issues assumed greater urgency on the eve of World War I. This is reflected in the increased frequency of the association meetings and communication with the government.Footnote 42 This urgency led the government to concede to several provisions related to the local purchase of government stores. Thus, the lobbying activity of the Association played a vital role in bringing about change in policy and regulations. IEA also apprised the government authorities that some members were interested in diversifying into railway rolling stock production. Also, the war created difficulties for the railways in importing several rolling stock items such as bogies, wagons, and cast-iron sleepers from Britain. The railway board contacted the IEA and enquired if the Association’s members could manufacture these items in India. The Association collected the relevant data from its members, shared it with the railway board, and arranged meetings of its members with board officials. Many members could secure railway rolling stock orders because of these efforts. The Association, therefore, acted as a bridge between the individual firms and the different government agencies.
Change in Activities
Before the war, most of the firms in the cluster were engaged in shipbuilding, ship repair, and structural engineering. Some firms also produced industrial machinery such as sugarcane crushers, jute bales, and oil seed pressers on a small scale.Footnote 43 During the war, Albion Foundry (an old firm) manufactured shell cases required for war purposes.Footnote 44 John, King & Co., which was primarily involved with shipbuilding and ship repair, undertook the manufacturing of diverse items such as jute baling presses, colliery coal tubs, crankshafts, milling machines, lathes, steam hammers, winding engines, and drying machines for roping.Footnote 45 Balmer, Lawrie & Co., primarily involved with structural engineering, started repairing electrical machinery.Footnote 46 Jessop & Co. secured the contract to expand the TISCO facilities at Sakchi (now Jamshedpur).Footnote 47 The project led to the extension of its structural workshop at Howrah. The iron castings of various sizes required for the project were fabricated at its Howrah foundry. It undertook the manufacture of hydraulic presses, engine pumps, colliery, and mill equipment. However, it also faced significant handicaps in expanding its capacity due to the restrictions on importing raw materials and machinery. It had to depend solely on Indian pig iron and steel, both of which were in short supply during the war.
Change in Location
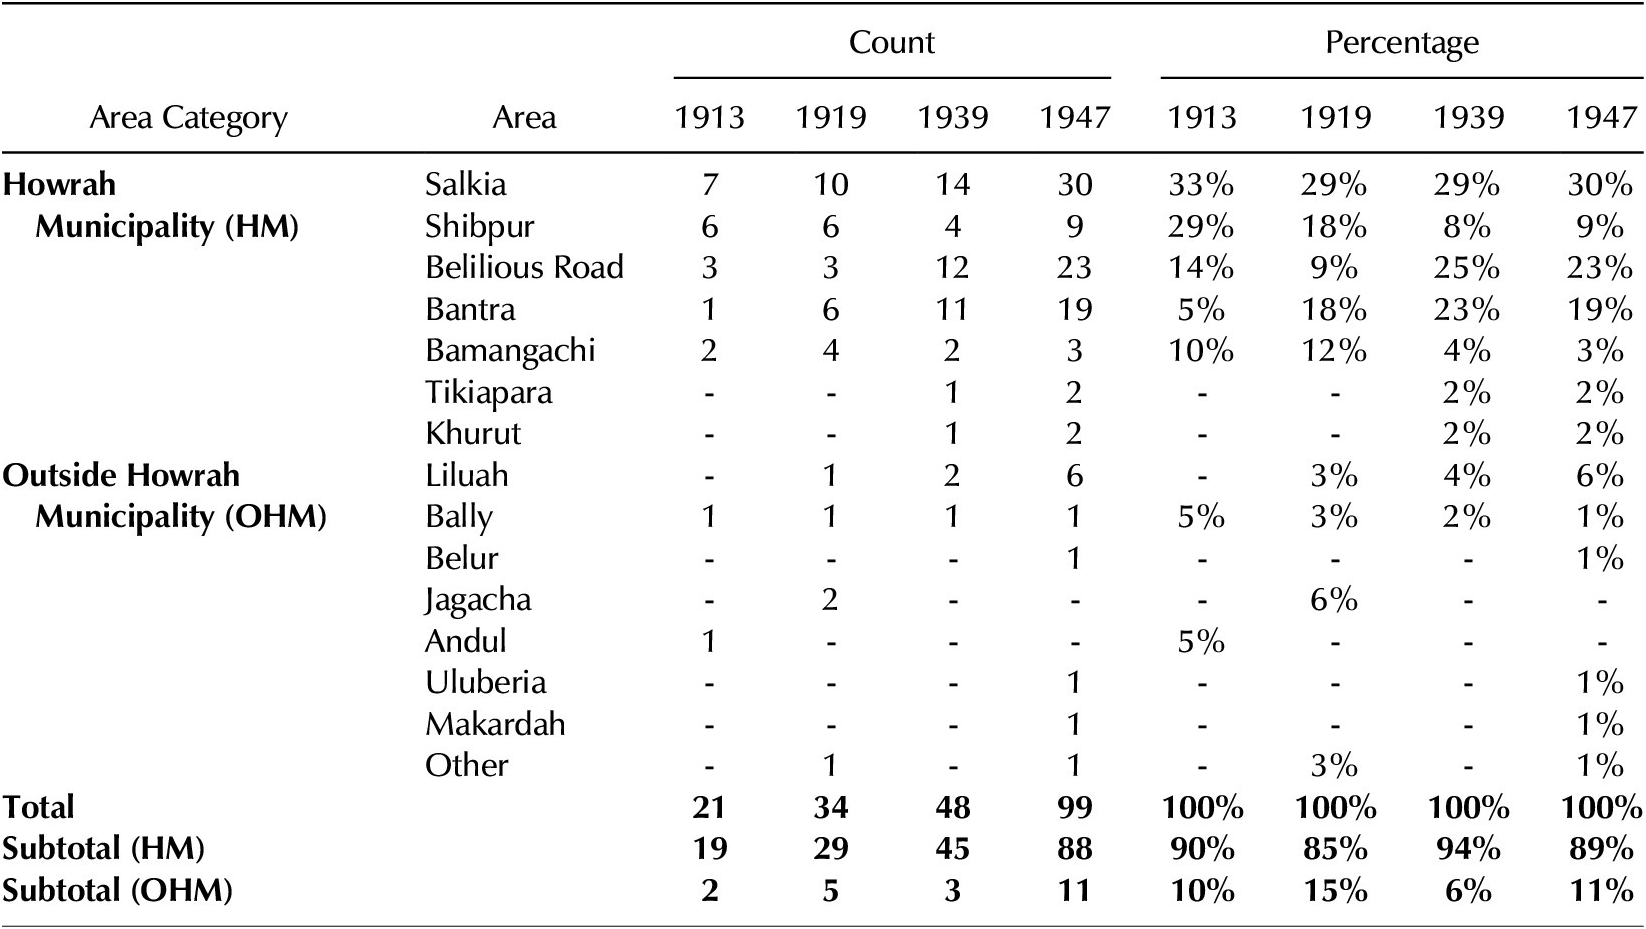
The twenty-one foundries that functioned in 1913 were in different regions of the Howrah district (Table 1).
Location of foundries across different areas in Howrah

Note: Percentages are rounded off to zero decimal places.
Seven foundries (33 percent) were in Salkia, six (29 percent) in Shibpur, three (14 percent) along Belillios Road, two (10 percent) in Bamangachi, and one (5 percent) in Bantra. All of these centers were located within the boundaries of Howrah Municipality. Thus, 90 percent of the foundries in the Howrah district were located in the Howrah Municipality. Two foundries (10 percent) were located outside Howrah Municipality, one each in Bally and Andul. By the end of this period, Salkia was still the center of the foundry industry. However, areas such as Bantra and Bamangachi were the emerging hubs. Of the thirty-four firms active in 1919, thirty (85 percent) were located in the Howrah municipality. Out of these, ten (29 percent) were in Salkia, six (18 percent) in Shibpur, six (18 percent) in Bantra, four (12 percent) in Bamangachi, and three (9 percent) in Belilious Road. There were four foundries (15 percent) located outside Howrah Municipality, with one (3 percent) in Bally, one (3 percent) in Liluah, and two (6 percent) in Jagacha.
Phase II (1920–1938): Interwar Years and the Howrah Foundry Cluster
World War I led the British Government of India to take cognizance of India’s industrial underdevelopment. In this regard, an industrial commission was appointed during the war. After the war, many of the commission’s recommendations were also implemented. These changes included the establishment of a permanent Department of Industries in Bengal, a change in import tariff to protect nascent industries such as steel, a change in the government’s store policy to facilitate the procurement of Indian manufactured goods, and bringing about legislative changes to give financial assistance to cottage and small industries. The policy change slowly led the government departments such as railways, post and telegraph, public works department, and the Indian Stores Department to increase their procurement of Indian manufactured goods. This generated the demand for foundry products.
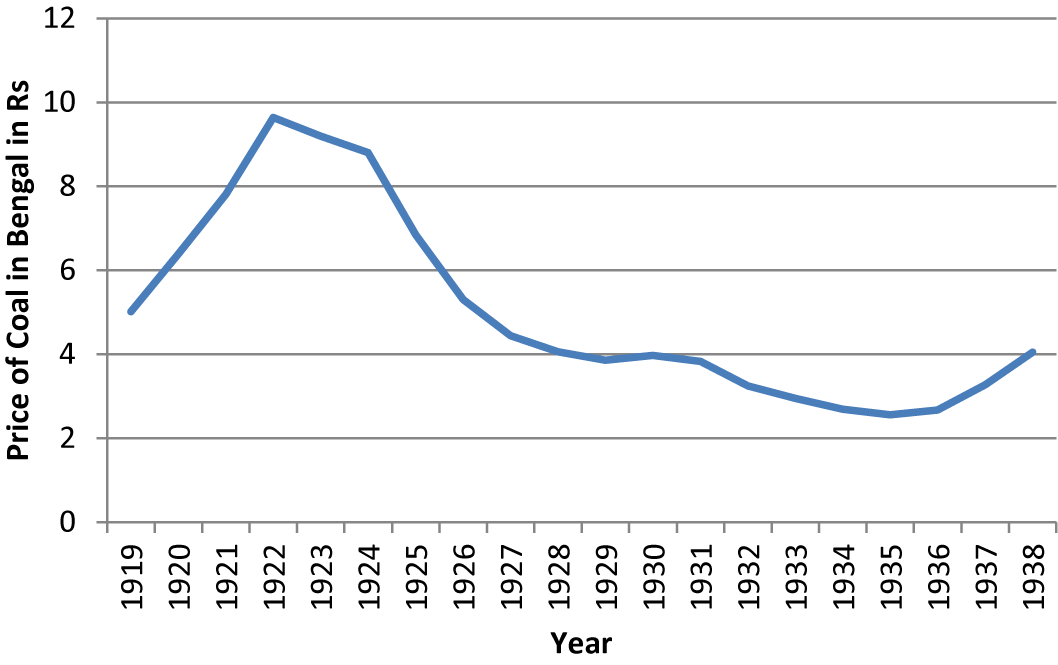
The postwar macroeconomic environment witnessed a rise in prices and demand for an increase in wages. On the other hand, the industries suffered from a slowdown in demand, making it difficult to raise wages. This led to pan-India labor conflicts in different industries. The government was prompted to design a framework to resolve such disputes. This led to the enactment of the Trade Union Act in 1926. The principal raw material for foundries, i.e., pig iron, increased significantly in the postwar era. However, coal production did not rise significantly, leading to an increase in coal prices.
Once the war ended, the Howrah foundry cluster witnessed a shakeout, with many firms closing down due to the immediate decrease in demand. The number of workers employed in Howrah foundries decreased significantly after the war. Although many legislative provisions were enacted to aid the industries, the increase in demand for foundry products was slow due to the restrictive implementation of the legislative provisions. Consequently, the growth of firms in the Howrah foundry cluster remained slow during this phase. The overall increase in number of firms during this phase was fourteen.
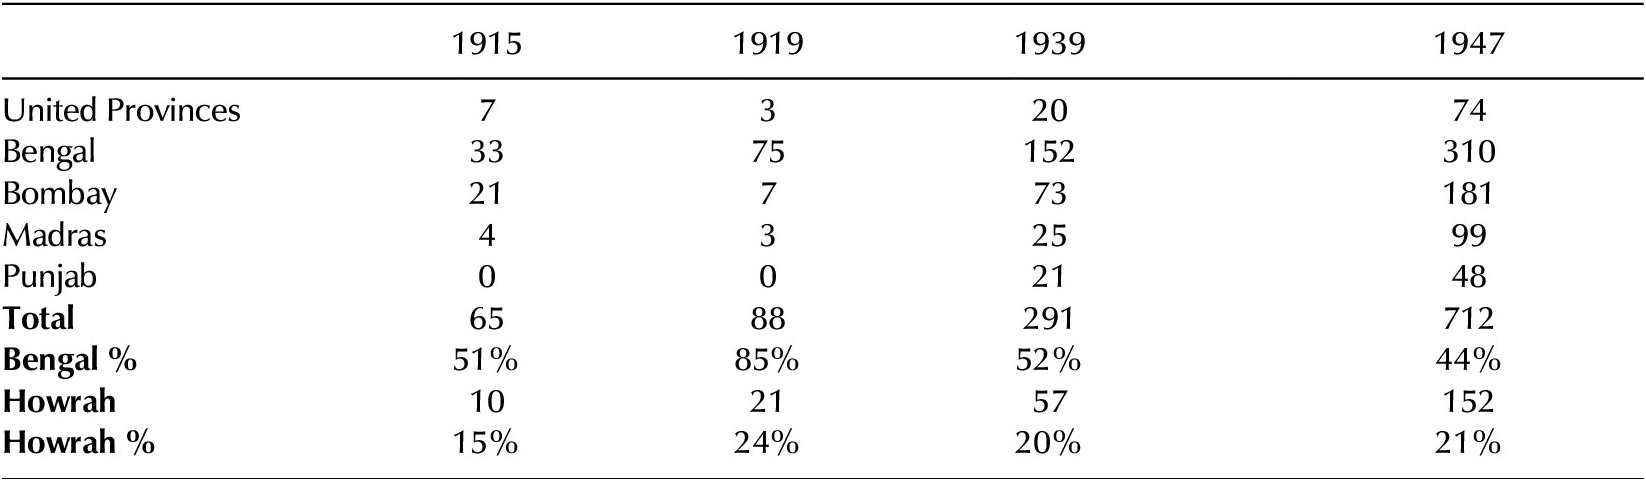
The demand for foundry products mainly came from government departments. Most of these government departments were headquartered in Kolkata, the twin city of Howrah. Thus, the Howrah foundry cluster firms received a significant portion of the orders from these government departments. Howrah emerged as a center of the foundry and engineering industry. Twenty-four percent of the total engineering factories across India in 1919 were located in Howrah (see Table 2).
Numbers and percentages of engineering factories in India, 1915–1947

Source: Large Industrial Establishments in India (British Government of India, Commercial Intelligence Department), 1915, 1919, 1939, and 1947.
Note: The industrial classification in the data source changed over the years. For 1915, the data reported consists of factories categorized as either iron and brass foundries or engineering workshops. The iron and brass foundries category was discontinued after 1919. Therefore, for 1919, 1939, and 1947, the data reported consists of only factories categorized as engineering workshops. There are differences in the data reported in Table 2 and Table A3a (see Appendix) as, for 1915 and 1919, some of the engineering factories were also listed under the Metal Works, Dockyards, and Miscellaneous section of the report. Due to this, Table 2 underreports the data for the total number of engineering factories in 1915 and 1919.
The railway workshop in Howrah further encouraged the establishment of new foundries. The spinoff process gained traction during this phase, with many Indian employees in the bigger foundries establishing their foundries. Backward vertical integration also played a role in expanding the Howrah foundry cluster. Some Indian industrialists, such as oil mill owners, established their foundries for manufacturing industrial goods, such as oil mill presses, required for their parent firms. This points to the role of private industrial demand generated by nearby mill industries in the growth of the Howrah foundry cluster. Most of these small foundries were owned by Indians, specifically Bengalis. The industry became concentrated around the Belilious Road and Bantra area. One of the probable reasons for concentration around these areas was the availability of land and social proximity of the new firms with the existing Indian-owned firms in these areas.
As the number of Indian-owned foundries increased, the structure of the Howrah foundry cluster witnessed a change. The social and organizational proximity of the Indian-owned firms led them to form a separate association, the Howrah Manufacturer’s Association (HMA), to represent the interests of small-scale Indian-owned foundries. Workers in the Howrah foundry cluster became more organized after the war. The enactment of the Trade Unions Act led the workers to organize themselves into unions legally. Multiple unions, such as Howrah Sramik Mandal and the Engineering and Metal Workers Union (EMWU), represented the workers in the Howrah foundry cluster. Thus, at the end of this phase, the Howrah foundry cluster was governed by multiple associations and unions, each representing a specific group of stakeholders in the cluster.
Exogenous Factors Affecting the Cluster
Change in Regulations and Policies
The beginning of the interwar period, 1919–1938, saw the implementation of some of the recommendations of the Indian Industrial Commission. A permanent Department of Industries in Bengal was formed in early 1920 with Dr. D.B. Meek, former Controller of Munitions Bengal, as its director. (Figure 3).Footnote 48
The second was the appointment of a Fiscal Commission in 1921 to examine the government’s tariff policy.Footnote 49 The Commission recommended an approach of discriminatory protection to industries that could not develop without protection. The government also appointed a tariff board to inquire into the nature and degree of protection for different industries.Footnote 50 The first industry which received the government’s attention regarding protection was the steel industry. The Tariff Board submitted its report on the steel industry in 1924 and recommended protection in the form of increased import duties for iron and steel products. The recommendation received legislative sanction with the enactment of the Steel Industry (Protection) Act, 1924.Footnote 51 Although the Act was reviewed several times, it continued to be in effect with minor modifications until the end of this period. The Act ceased to be in force after 1947.
The third was the appointment of the Stores Committee to report on the possible changes in its policy to encourage Indian industries.Footnote 52 The Committee submitted its report in 1920. Following the recommendations, the stores purchase policy was revised in 1924.Footnote 53 The revised policy led to the setting up of a centralized Indian Stores Department (ISD). A further change in stores policy occurred in 1931 with the imperial government’s adoption of the Rupee Tender System (RTS).Footnote 54 This system of stores purchase was also adopted by the Bengal government in 1933. The RTS laid down the preference order for the stores purchases. The first preference was to be given to Indian products made from Indian raw materials. The second preference was for Indian products manufactured from imported materials. The third preference was for imported materials held in stock in India, and the last preference was to be given to imported articles.
Another significant policy change in Bengal was the enactment of The Bengal State Aid to Industries Act in 1931. The Act was meant to provide financial assistance to cottage and small industries.Footnote 55 However, it did not have the desired effect on establishing new industries due to restrictive provisions in its implementation.
The labor policy and regulations also witnessed significant changes during this phase. The early interwar years saw labor unrest in all the major industrial centers, such as Bombay and Calcutta.Footnote 56 There had been a gradual rise in prices even before the war.Footnote 57 This continued during and after the war. Accordingly, the demand for wage increases was the most common cause of the industrial strikes.Footnote 58 The strikes led to a definite increase in workers’ wages, though it was often not commensurate with their demands. The imperial and provincial governments were forced to recognize the labor issues as the strikes became widespread.Footnote 59 This resulted in the establishment of labor institutions and the enactment of crucial labor legislation.
The provincial government of Madras appointed a Commissioner of Labour in 1920.Footnote 60 The same year, the Bengal government appointed a Labour Intelligence officer, and the Imperial government established the Labour Bureau. The Bengal government appointed a committee in 1921 to investigate the causes of industrial strikes. That committee recommended setting up the Conciliation Courts and Works Committee to deal with industrial conflicts. These committees were set up temporarily in Bengal and arbitrated a few industrial disputes. However, it was not until 1929 that a formal Trade Disputes Act was passed.Footnote 61 The Act was further amended in 1938. The issue of trade union legislation came up before the central legislature because of a trade dispute in Madras.Footnote 62 Tentative proposals for trade union legislation were published in 1921. However, it took five years of deliberations before the Trade Unions Act 1926 was passed. The Act came into effect in June 1927.
Change in Demand
The changed stores policy catalyzed the purchase of local goods by the Indian Stores Department. This led to increased demand for engineering and foundry products manufactured by firms in Howrah. During this period, the railways were the biggest consumer of engineering goods. According to the new stores policy, the government railways were required to send copies of their foreign indents to the Indian Stores Department to ascertain if some c could be purchased from Indian companies. This also contributed to an increase in demand for foundry products.
A major infrastructure project in Howrah, the new Howrah Bridge, commenced towards the end of this period in 1936.Footnote 63 The project provided impetus to the local engineering and foundry industry. There was considerable lobbying by the Indian engineering firms to secure the project’s tender. However, the contract for the project went to Clevland & Co. of Britain. The lobbying, however, ensured that principal Indian engineering firms Burn & Co., Braithwaite & Co., and Jessop & Co. were appointed as subcontractors.
Change in Raw Material Supply
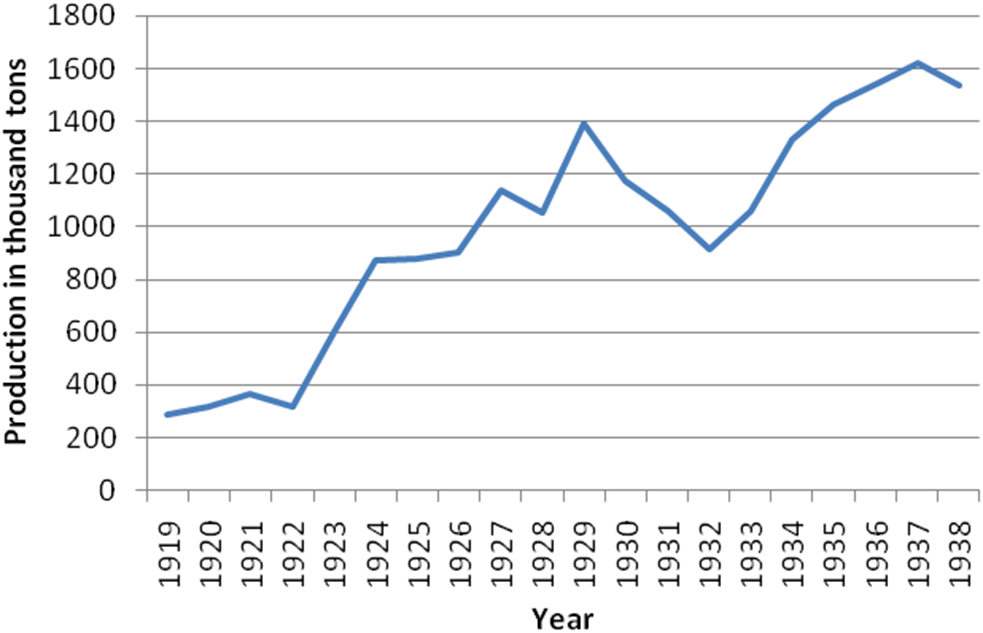
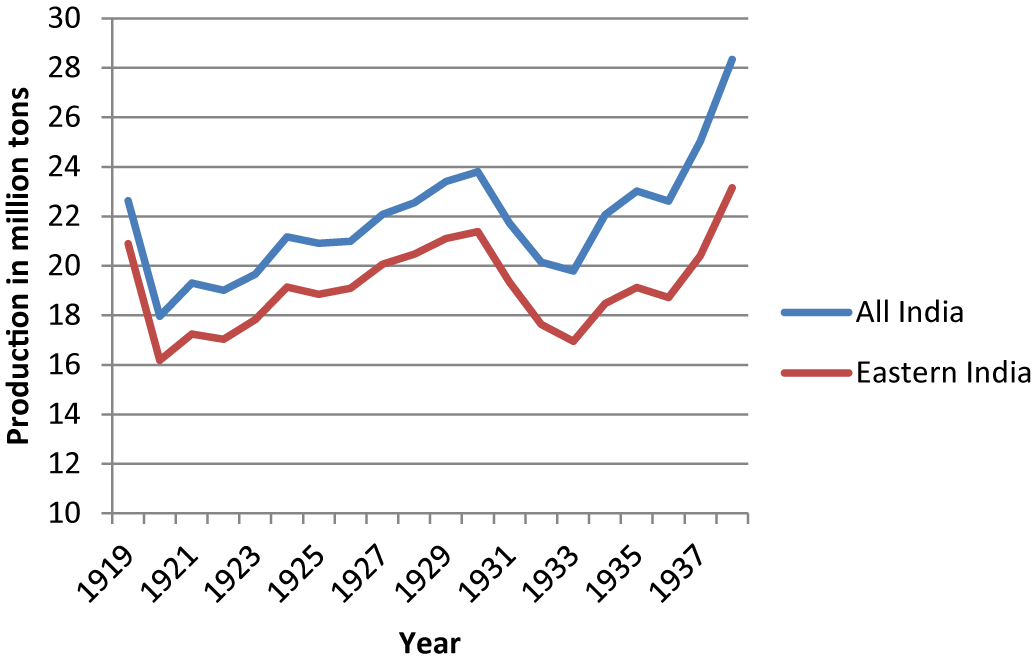
The production of two primary raw materials—pig iron and coal—for foundries increased substantially during this period. The graphs below show the broad trend in producing these two raw materials for the period under consideration.
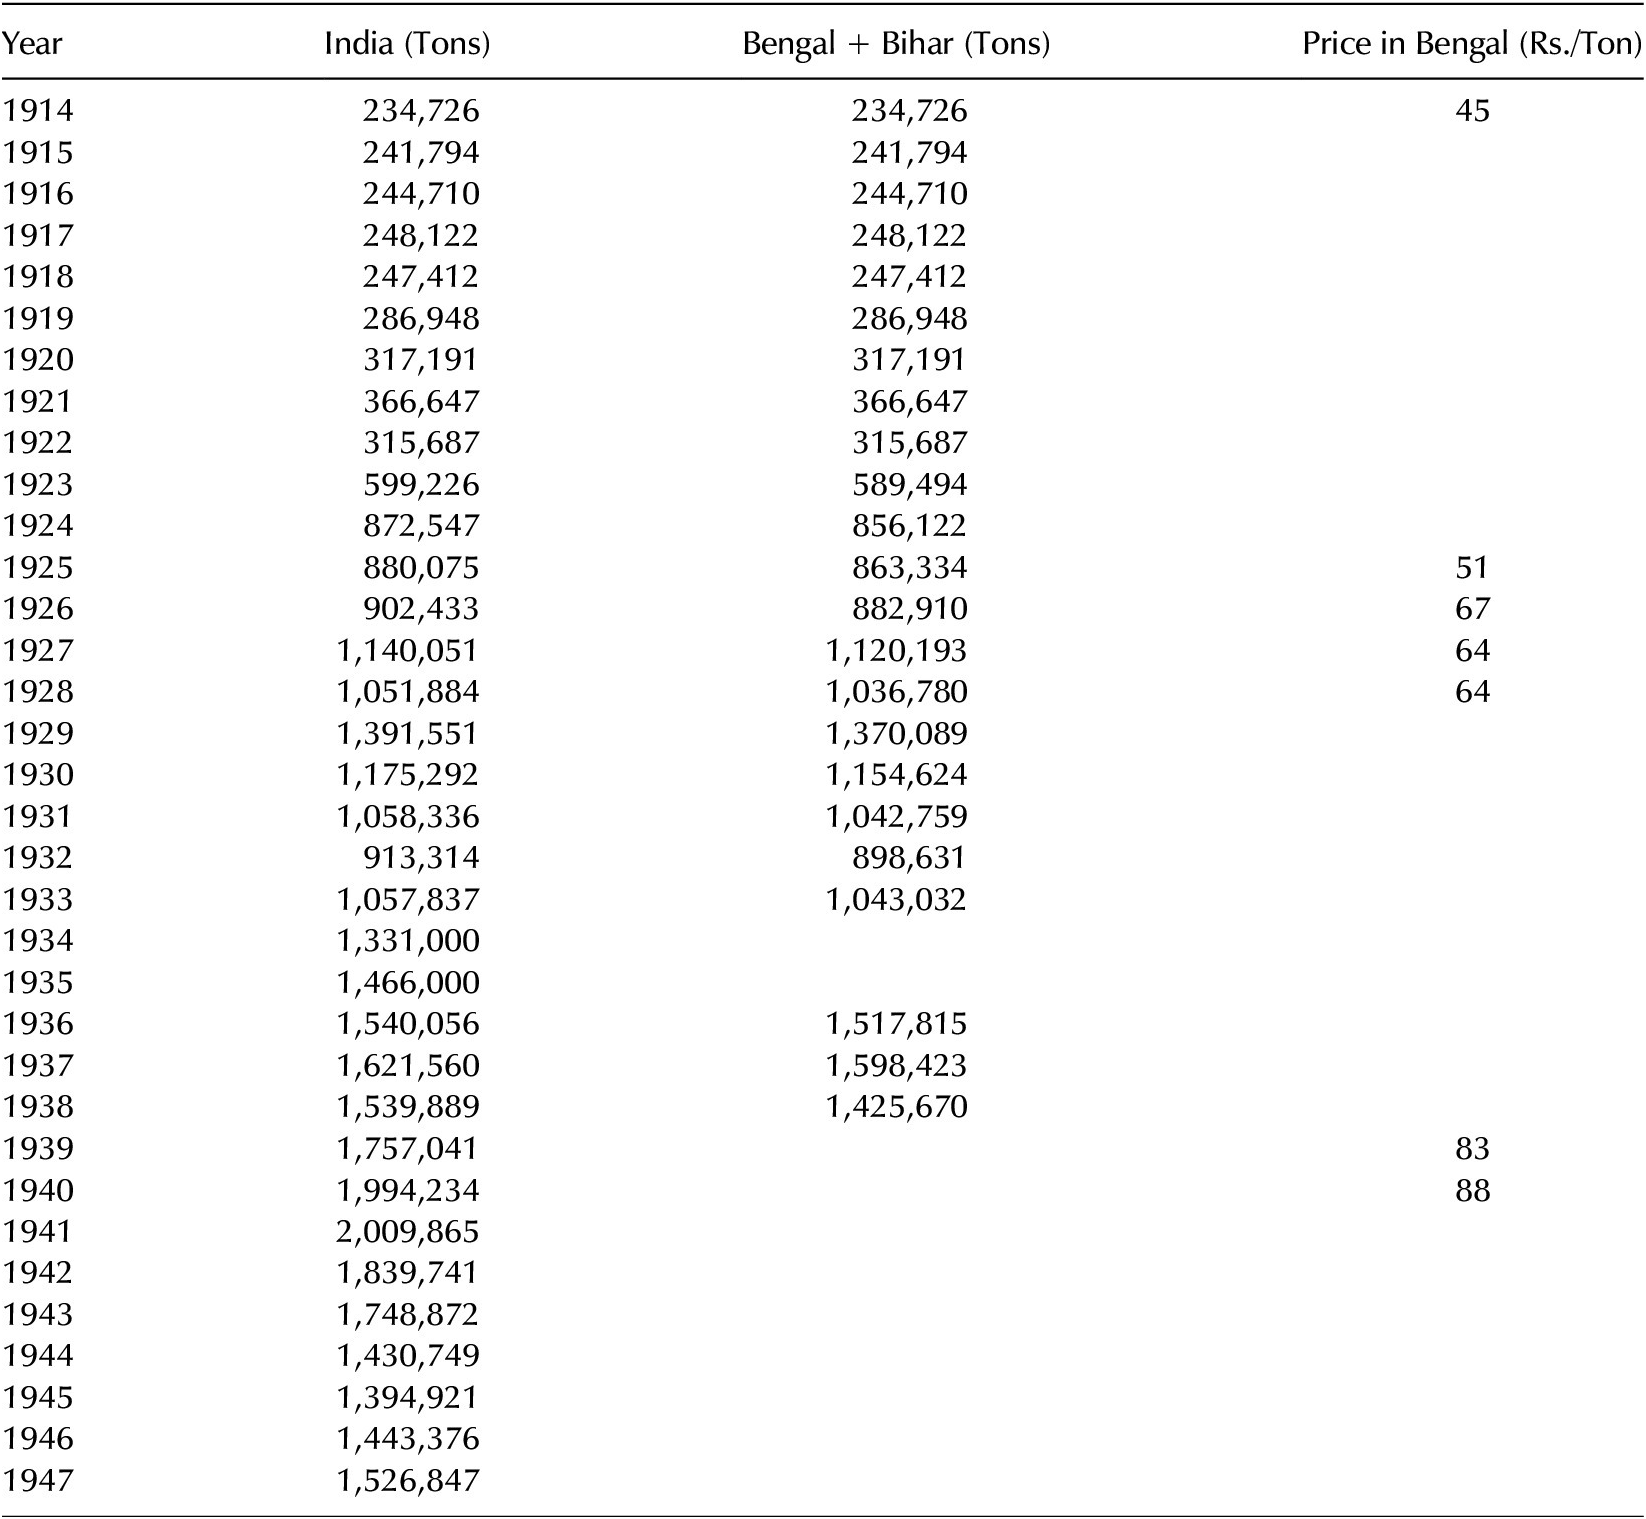
The overall coal production in India rose from around 22.6 million tons in 1919 to 28.3 million tons in 1939.Footnote 64 The corresponding output in Eastern India increased from 20.9 million tons in 1919 to 23.1 million tons in 1939. However, as is evident from Figures 4 and 5, the overall production decreased significantly after the war and was followed by a consequent increase in price. It was not until 1928 that the output could match the war levels. The worldwide depression began in the early 1930s, and production again showed a downward trend. The production started to recover from the effects of depression from 1934 onwards.
Production of pig Iron in India, 1919–1938.
Source. Prepared by the authors from various sources (see the Appendix).

Coal production in India (blue line) and Eastern India (Bengal, Bihar, and Orissa) (red line), 1919–1938.
Source. Prepared by the authors from various sources (see the Appendix).

Pig iron production rose from 286,948 tons in 1919 to 1,539,889 tons in 1938.Footnote 65 As is evident from Figure 1, pig iron production increased significantly from 1923 onwards. It was in this year that two new steel plants—the Indian Iron and Steel Company (IISCO) at Hirapur in Bengal and Mysore Iron Works (MIW) at Bhadravati in Mysore (now Karnataka)—began producing pig iron.Footnote 66 IISCO was floated by Burn & Co. as early as 1918, although production began only in November 1922. The princely state of Mysore floated Mysore Iron Works, and it started production in 1923. IISCO later entered into a profit-sharing arrangement with the Bengal Iron Company (BIC), managed by Martin & Co., in 1925.Footnote 67 The agreement enabled the company to tide over the slump in the iron and steel trade of the mid-1920s. Further integration of the two companies took place in 1936 when they merged, and IISCO took over the assets of BIC. IISCO was also the principal supplier of pig iron to the steel manufacturing firm Steel Corporation of Bengal (SCOB), floated by Burn & Co. in 1937.
Price of coal in Bengal, 1919–1938.
Source. Prepared by the authors from various sources (see the Appendix).

Changes Within the Howrah Foundry Cluster
Change in Actors
The early interwar years were also turbulent in terms of the establishment of new foundries.Footnote 68 Whereas ten new foundries were established between 1919 and 1921, thirteen were closed during the same time. Following the worldwide depression in the early 1930s, there was a significant reduction of workers in the industry. The total number of workers employed decreased from 15,489 in 1929 to 10,725 in 1931 and 9,252 in 1933. A significant part of the decrease in 1933 was due to the closure of one of the oldest and largest foundries, Jessop & Co.’s Howrah Foundry.Footnote 69 The reason for the closure was the government’s acquisition of Howrah Foundry’s land for the Howrah Bridge project. Jessop & Co. consequently shifted their foundries and structural workshop to Dumdum.
The existence of larger foundries, engineering firms, and railway workshops in Howrah encouraged the establishment of smaller foundries. Large firms served as a training ground for the next generation of entrepreneurs. This was the case with Benoy Kumar Das, who established the Bantra Engineering Works in 1922, along with his brother D.K. Das.Footnote 70 He was earlier employed as a marine engineer by the firm Apcar & Co., one of the largest shipping companies of the time. The larger firms lowered the cost of entry into the foundry industry by creating a secondhand machinery market. The entrepreneurs who wanted to enter the foundry business could purchase the old and discarded machinery from firms such as Burn & Co.; John, King & Co.; Port Engineering Works; and Railway Workshop at Liluah.Footnote 71
The existence of mill industries in Howrah also gave impetus to the foundry industry. Many entrepreneurs who owned mills entered the foundry industry with the intention of backward integration and manufacturing mill machinery for the market. This was the case with foundries such as Atta Iron Foundry and Dhang & Co., which both owned oil mills before they entered the foundry business and started manufacturing oil seed presses.Footnote 72 Educational institutions such as Bengal Engineering College (BEC) also gave impetus to the growth of the foundries, with many of its students establishing foundries in the Howrah district. One such case was Sardindu Guha, who passed out of BEC in 1925. He worked for a short period at B.D. Berry & Co. in Calcutta and later started the Liluah Iron Works at Howrah in 1930.Footnote 73
Toward the end of this period, World War II speculations encouraged the formation of new foundries. Eleven new foundries began between 1935 and 1937. The share prices of larger foundries such as Britannia Building & Iron Co and Burn & Co. also experienced significant increases toward the end of this period.Footnote 74 The share prices of Britannia Building & Iron Co increased from Rs. 3.5 in 1935 to Rs. 9 in 1939, whereas the share prices of Burn & Co. increased from Rs. 122.5 to Rs. 274.5 during the same time. The period witnessed a slow growth of the foundry industry in Howrah. The number of foundries increased from thirty-four in 1919 to forty-eight in 1939. The number of employees increased from 11,324 in 1919 to 12,987 in 1939. Most of the firms at the end of this period were propriety concerns. However, there were also eight partnership firms. Indians (Bengalis) owned most of these firms. Most owners, proprietors, and partners belonged to the Bengali Kayastha, Brahmin, and Baidya communities. However, a minority of owners belonging to the Mahisya community had also emerged by this time.Footnote 75 Mahisya entrepreneurs gradually emerged as industrial leaders and played an essential role in organizing small-scale foundries. B.K. Das, the founder of the Howrah Manufacturers Association, belonged to the Mahisya community.
Change in Cluster Structure
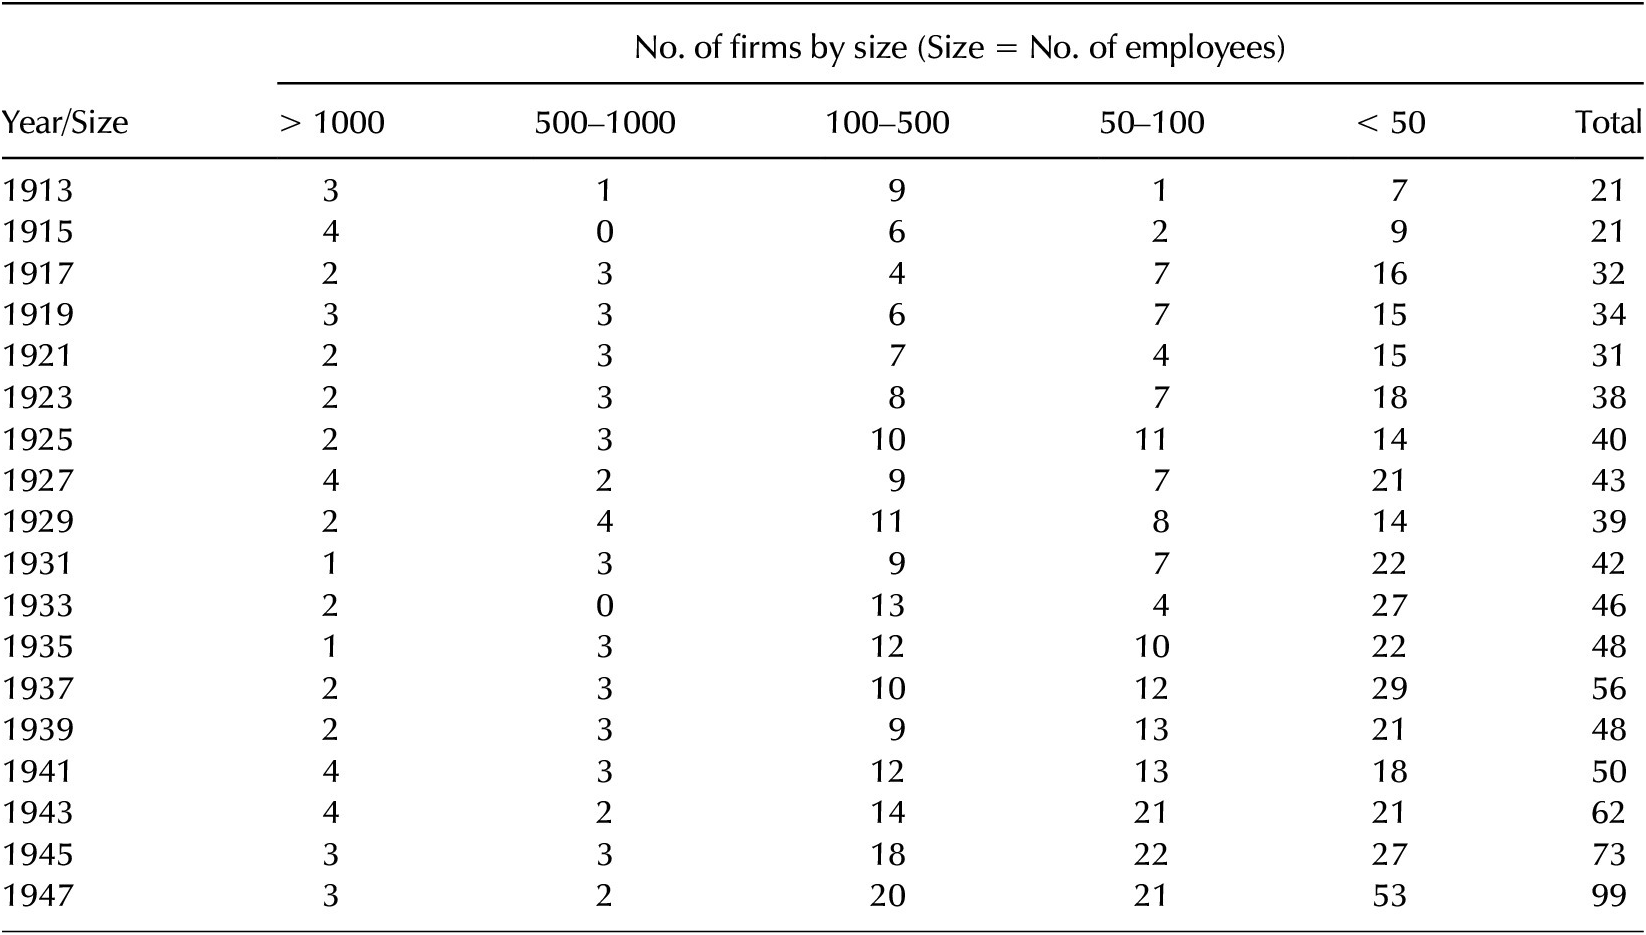
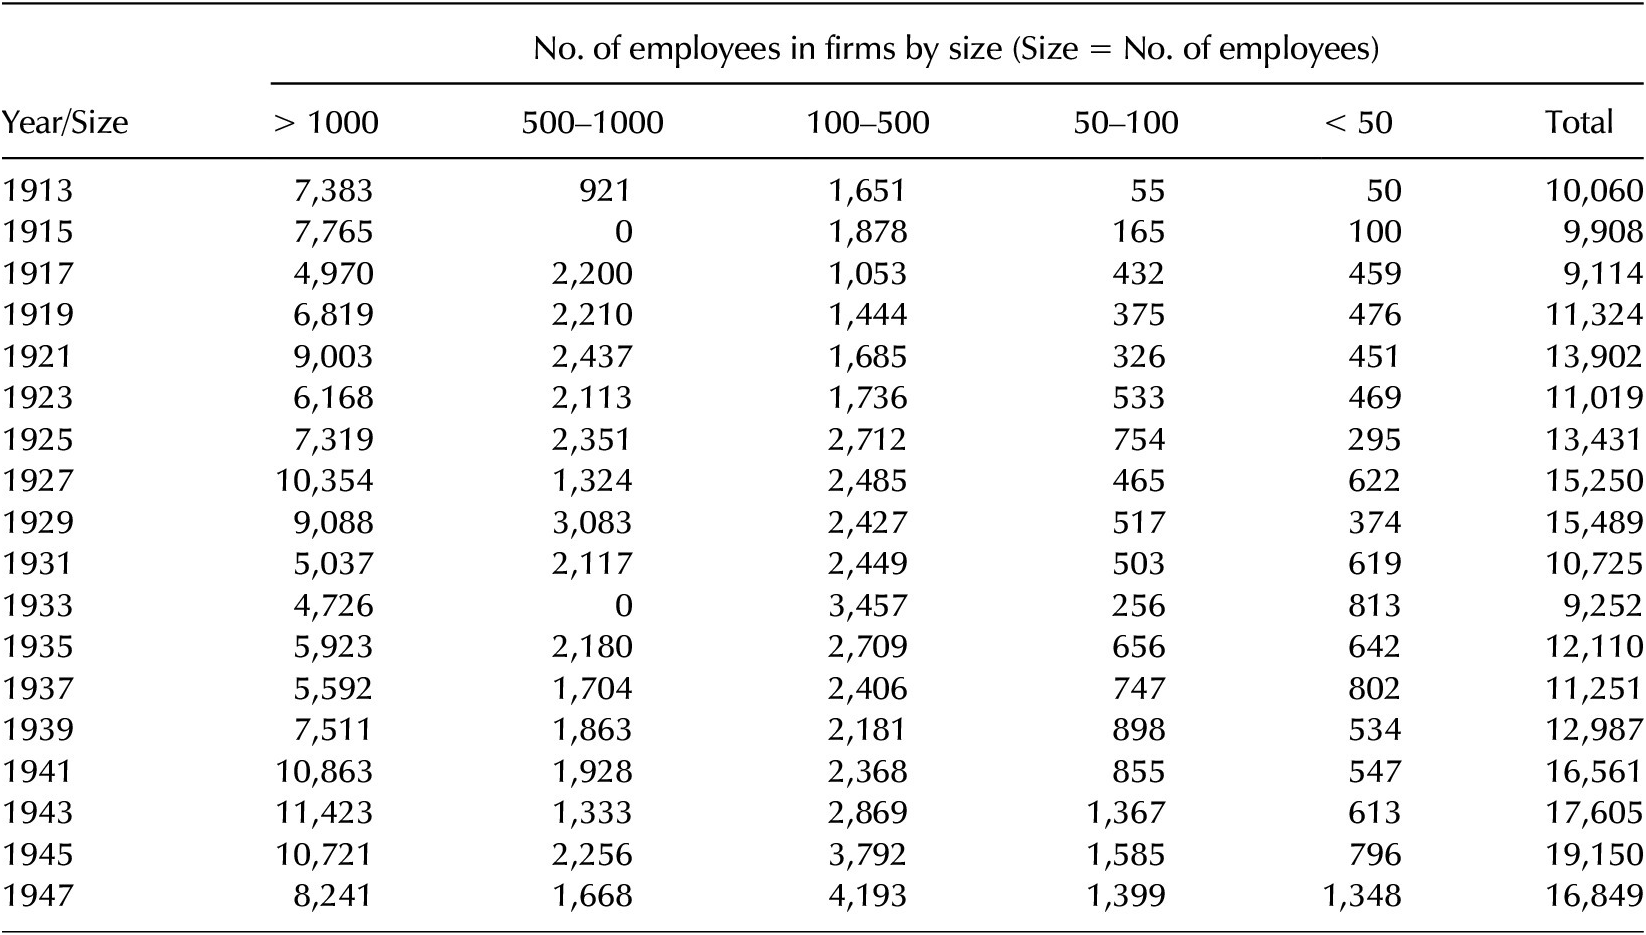
Compared with the larger and older firms, the firms established by indigenous Bengali entrepreneurs operated on a small scale. Most of these firms employed less than a hundred workers (Appendix, Table A3b). Thus, the cluster became vertically differentiated into large and small firms. The smaller firms faced several disadvantages because of differential government policies concerning smaller foundries. One of the difficulties for smaller foundries was securing pig iron at competitive prices. TISCO and IISCO were the leading producers of pig iron. These two firms also manufactured cast iron products that gave competition to the smaller foundries. Furthermore, these two larger firms received protection under the Steel Industry (Protection) Act of 1924. The smaller firms alleged that the two larger firms artificially inflated pig iron prices.Footnote 76 Since pig iron was the primary raw material for foundries, this created an unfair competitive scenario for smaller foundries. Also, these small-scale foundries were not represented at the IEA. Furthermore, IEA was dominated by large foundries and engineering firms owned mainly by Europeans. Even in 1939, the executive committee of the IEA consisted only of European firms. These concerns prompted some indigenous Bengali entrepreneurs to establish the Howrah Manufacturers Association (HMA) in 1934 to protect and promote the interest of small and medium-scale foundries.Footnote 77 B.K. Das of Bantra Engineering Works played a pioneering role in establishing this association.
The Howrah Manufacturers Association was located at the then-emerging center of the foundry industry, Belilious Road. Most of the Indian-owned foundries were concentrated in this area. At the end of this period, the foundry industry in Howrah was represented by two associations, the IEA and HMA. The HMA published an annual brochure titled “Engineering Industries in Howrah” to give visibility to the small-scale industries in Howrah. It also maintained a library that was available for use by its members. The Association further provided advisory services to its members regarding government legislation, taxation, labor relations, and other industrial matters. It also helped its members deal with the government, procure raw materials, organize exhibitions, and create a market for their products.Footnote 78
Another significant change in the cluster’s structure was the formation of labor unions. The early interwar years witnessed a growing incidence of labor strikes in the Howrah foundry industry.Footnote 79 Labor strikes were organized at major foundries such as Burn & Co.; Hooghly Docking & Engineering Co.; Shalimar Works; Jessop & Co.; John, King & Co.; and Dey & Kundu’s in 1920. As was the case in the rest of India, the primary cause of the strike was the demand for wage increases. The strikes led to the organization of labor and the growth of the trade union movement in Howrah. The Howrah Labour Union was a prominent trade union in Bengal in 1921. It was affiliated with the All India Trade Union Congress (AITUC) and continued until 1927.Footnote 80 Toward the end of this period in 1938, a generic labor union, Howrah Sramik Mandal—affiliated with AITUC—existed in Howrah.Footnote 81 It had 500 members. Specialized unions related to the foundry industry existed at the Bengal provincial level. These were the Engineering and Metal Workers Union (EMWU) and the Bengal Steel and Iron Workers Union (BSIWU). Both were in Calcutta and had 200 and 248 members, respectively.
Change in Activities
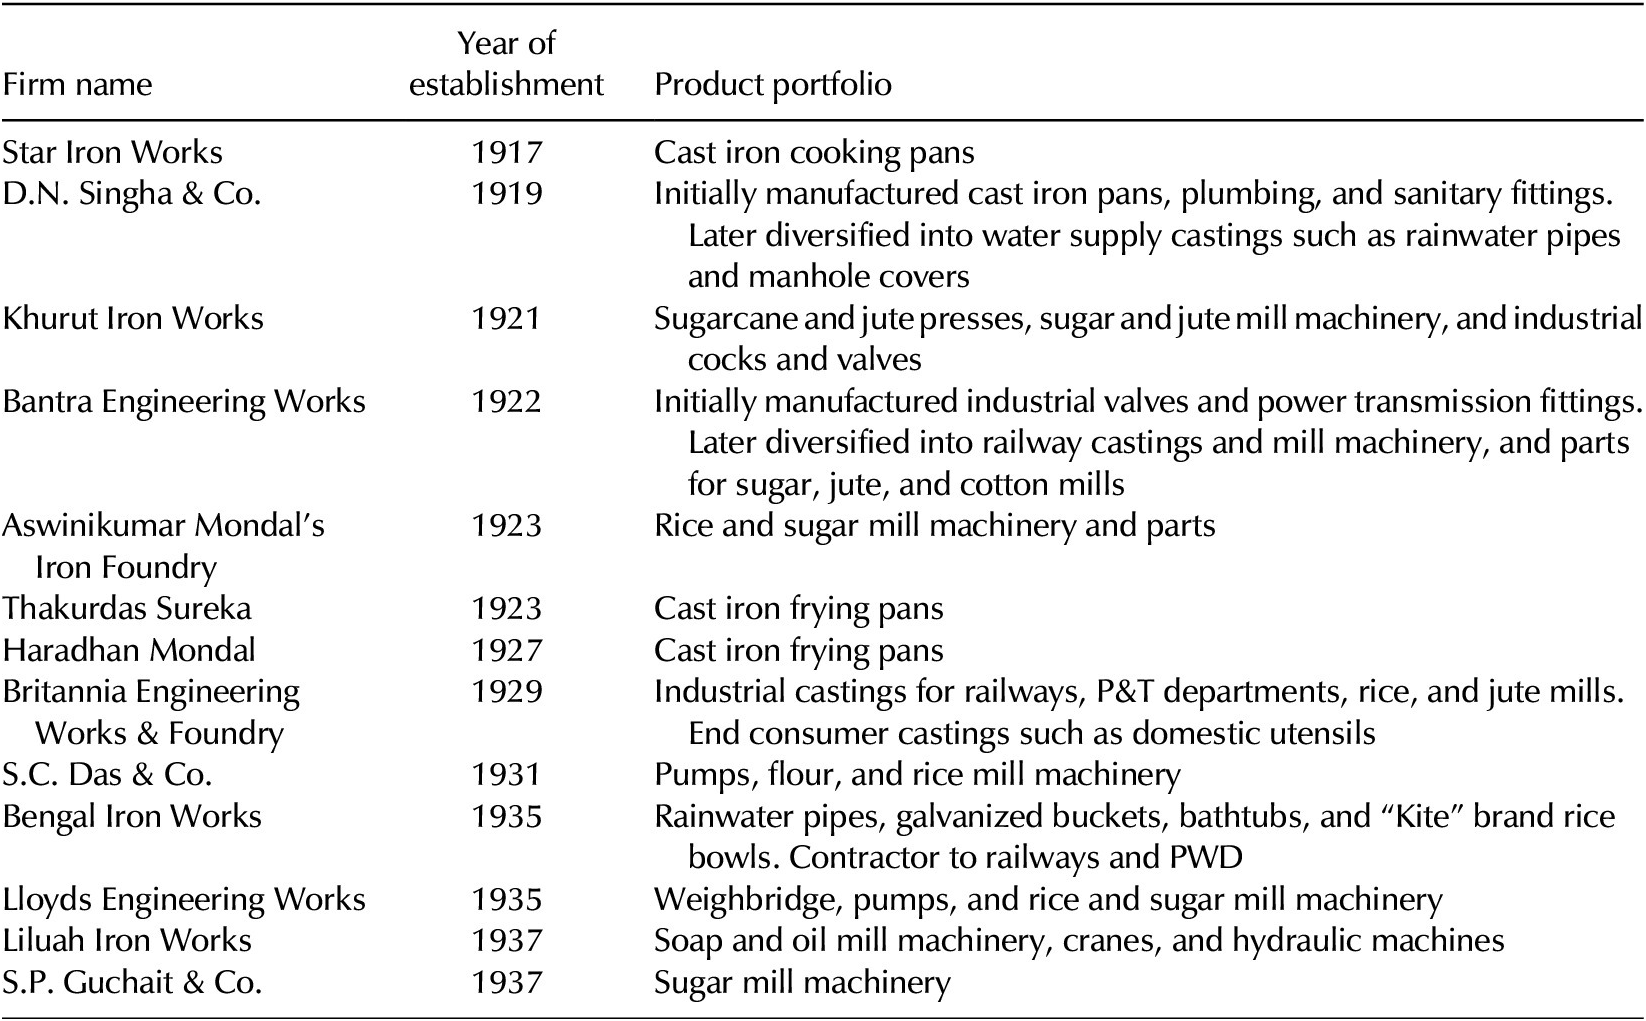
The primary customers of foundries during this period were railways, mills, Public Works Department (PWD), Post and Telegraph (P&T), and Indian Stores Department (ISD). Many foundries also manufactured end-customer castings such as frying pans, buckets, and rice bowls. This is evident from Table 3 below, showing the product portfolio of some of the firms that existed during this period.
Product portfolio of iron foundries in Howrah, 1919–1938

Source: Thacker’s India Directory (various years), Indian Engineering Industries (various years).
Change in Location
At the end of this period, there were forty-eight foundries, with forty-five (94 percent) and three foundries (6 percent) located in and outside the Howrah Municipality, respectively. Belilious Road and Bantra emerged as new centers of the foundry industry at the end of this period. Out of the forty-eight foundries in 1939, twelve (25 percent) were located in Belilious Road and eleven (23 percent) in Bantra. Salkia was still the center of the foundry industry, with fourteen (29 percent) foundries in this area.
Phase III (1939–1947)—World War II and the Howrah Foundry Cluster
The exogenous shock of World War II led to increased government control of different industries. This was done to channel industrial production towards wartime requirements. The government enacted several orders to regulate output and fix prices in industries such as iron and steel, machine tools, and coal. The Factories Control of Production Order mandated private engineering firms to manufacture only government-authorized products. Furthermore, engineering goods were controlled by the Director General of Munitions Production (DGMP), headquartered in Calcutta. As a result of wartime demands and import restrictions, new branches of engineering industries were set up in India. These included producing machine tools, bolts and nuts, textile machinery, structural engineering, railway wagons, wheels, and axels. The diversification of engineering industries led to increased demand for foundry products.
The exogenous shock of World War II created opportunities for the Howrah foundry cluster expansion. Many entrepreneurs in related industries, such as jute and coal, established foundries in Howrah to cater to the increasing demand. The number of foundries in Howrah increased from forty-eight (in 1939) to ninety-nine (in 1947). Also, the bigger foundries in the Howrah cluster experienced increased production capacity. The foundries in Howrah district further diversified their production to cater to new branches of engineering industries. Most of the new players in the Howrah foundry cluster belonged to the Bengali Brahmin, Kayastha, and Mahishya communities. A minority of Indian Marwaris, holding prominent positions in related industries such as jute, also set up large-scale foundries.
The entry of new players in the Howrah foundry cluster brought about a qualitative change in the structure and governance of the Howrah foundry cluster. At the beginning of this period, the cluster was segmented into small-scale Indian-owned foundries (represented by HMA) and large-scale British-owned foundries (represented by IEA). The war led many Indian industrialists to establish relatively large foundries in Howrah. Specifically, the Indian Marwari owned large foundries and felt the need to start a new association to take advantage of the opportunities created by World War II. This gave rise to the birth of the Engineering Association of India in 1942, which helped the Indian-owned foundries to secure wartime orders and ensured the timely availability of raw materials. The Association grew at a faster pace compared with the IEA. EAI’s membership increased from thirteen (in 1942) to 123 (in 1945). In comparison, IEA’s membership witnessed a relatively slower growth, with its strength rising from fifty-eight (1939) to eight-seven (1943). The wartime hardships and lack of wage increments gave a fillip to the trade union movement in the Howrah foundry cluster. Workers in larger foundries became unionized and affiliated themselves with the AITUC. As the number of workers in the Howrah foundry cluster increased, cluster-level unions were formed to represent the specific interests of foundry workers. Among these were the Iron Factory Union and the Ghusuri Loha Karkhana Madoor Union. The Engineering and Metal Workers Union witnessed an increase in its membership from 200 in 1938 to 3,605 in 1947. Thus, the opportunities and stress created by the exogenous shock of World War II led to greater fragmentation of the Howrah foundry cluster. At the end of this period, the Howrah foundry cluster was represented by three industry associations and three unions representing the interests of different owners and workers, respectively.
Exogenous Factors Affecting the Cluster
Change in Regulations and Policies
As World War II broke out, the government created a centralized Department of Supply in 1939 to expedite the sourcing of war products. The government also created, in 1940, a Director General of Munitions Production (DGMP) office headquartered in Calcutta. Almost all the engineering factories functioned under the direct or indirect control of DGMP during the war. The directorate worked in close contact with the industry associations. Advisory committees and panels were formed on which the members of industries were represented. A committee named Roger Mission was appointed in 1940 to study the problem of wartime supply. On its recommendation, the ambit of the DGMP was greatly expanded, and several new engineering sections were formed under it. The same year, a conference of British colonies in the eastern hemisphere, known as the Eastern Group Conference, was held in Delhi. The deliberations at the meeting led to the formation of the Eastern Group Council (EGC) to coordinate wartime production and distribution among member countries. The EGC placed large orders on the Indian engineering industries during the war. A small-scale industry conference of provincial governments and princely states was organized in New Delhi in 1942. It formalized policies to utilize the capabilities of small-scale industries for producing war supplies. Footnote 82 , Footnote 83
The production and distribution of private engineering and allied industries functioned under strict government control during the war. The Factories Control of Production Order required engineering firms to manufacture only specific government-authorized products. The protective duties on steel were set to expire in 1941 but were continued due to wartime exigencies. Furthermore, the Iron and Steel Control of Production and Distribution Order gave power to the government to fix prices and determine allocations of iron and steel to license holders. The Machine Tool Control Order regulated the import and production of machine tools. The government ordered machine tools in bulk and distributed them to individual license holders. The Colliery Control Order was passed towards the end of the war in 1944 to overcome the crisis in coal production. It gave power to the government to regulate the formation of new collieries, fix prices, and control the production levels of individual collieries. Footnote 84 , Footnote 85
Change in Demand
The war boosted the existing engineering industries, and many new lines of production were set up. The government financed the extension of private engineering firms and even established a few factories. The industry inspectors closely connected with engineering firms and provided valuable technical advice. This resulted in the expansion of different branches of the engineering industry. The production of bolts, nuts, and rivets was 21,700 tons in 1936, increasing to 50,000 tons in 1947.Footnote 86 The machine tool manufacturing capacity of the country increased from 100 tons per year before the war to 4,200 tons per year in 1944.Footnote 87 The reduction in the import of textile machinery during the war prompted the formation of the Textile Machinery Corporation in 1939. It had branches in Gwalior and Calcutta. The Tata Electric and Locomotive Company came into being in 1945. It was the first Indian company to manufacture railway wheels and axles. The other branches of the engineering industry, such as shipbuilding and repairs, structural engineering, weighing machines, and wagon manufacturing, also registered significant growth. Footnote 88 , Footnote 89
Although government control benefited the engineering industries, they faced considerable difficulties adjusting to the postwar situation. The major problem was adjusting to low demand, replacing the overworked machinery, and diversifying into civilian manufactures. There were additional challenges in establishing contacts with foreign suppliers and customers with whom they had lost touch during the war.Footnote 90
Change in Raw Material Supply
The production of coal and pig iron fluctuated during this period. Coal production increased from 27,769,112 tons in 1939 to 29,433,253 tons in 1942. The production declined in the next three years before rising to 29,360,685 tons in 1946. The pig iron production rose from 1,757,040 tons in 1939 to 2,009,600 in 1941. It continued to decline in the subsequent years and stood at 1,443,376 tons in 1946.Footnote 91
Changes Within the Howrah Foundry Cluster
Change in Actors
The political shock of World War II drove the cluster change during this period. This led to an increase in domestic and international demand for foundry products. Many entrepreneurs in related industries, such as jute and coal, sensed the opportunity and invested in the foundry industry. The employees of existing foundries with the necessary technical expertise and capital also ventured into the industry. The number of foundries more than doubled during this period. It increased from forty-eight in 1939 to ninety-nine in 1947. Sixty-two new foundries were formed during this period. The number of persons employed in the foundries increased from 12,987 in 1939 to 16,849 in 1947.Footnote 92 At the end of the war, 19,150 workers were employed in this industry. The wartime boom was also reflected in the stock prices of large foundries such as Britannia Building Iron & Co. and Burn & Co. The share price of the former increased from Rs. 8.5 in 1939 to Rs. 21.75 in 1947, whereas the latter increased from Rs. 274.5 in 1939 to Rs. 772 in 1947.Footnote 93 However, in the postwar situation, the foundry industry faced decreasing demand. Nineteen foundries closed between 1947 and 1949.Footnote 94
Most of the firms during this period continued to be owned by Bengalis. However, a minority of Marwaris had also ventured into the industry by the end of this period. Among the Bengalis, most owners, proprietors, and partners belonged to the Brahmin, Kayastha, and Mahishya communities. A minority of owners also belonged to the Baidya community.Footnote 95
Also significant is the immediate background of some entrepreneurs who ventured into the foundry industry during this period. They came from a variety of backgrounds. Nursing Das Agarwalla, who floated the Tatanagar Foundry in 1941, was earlier involved in exporting and importing scrap iron. K.P. Mukherjee, who established an eponymous foundry in 1941, had worked at Godrej & Boyce Manufacturing Company. Babulaji Rajgarhia, who started the Hanuman Engineering Works in 1945, owned a jute mill started by his father. D.K. Das, the proprietor of Bantra Engineering Works, and his partner S.K. Das floated the Castings Corporation (India) in 1947.
Change in Cluster Structure
The period also saw the restructuring of the industry in terms of the growth of new associations. HMA and IEA were two significant associations that represented the industry before the war. IEA registered substantial growth during the period. Its membership increased from fifty-eight in 1939 to eighty-seven in 1943.Footnote 96 Meanwhile, several indigenously owned foundries had grown.
Furthermore, successful indigenous entrepreneurs from other industries also established large-scale foundries to cater to the increase in demand. However, both these categories of foundries faced difficulty in securing government orders. The British-owned foundries were organized under the aegis of IEA. This gave them a first-mover advantage in establishing links with the government and obtaining wartime orders. The Indian-owned foundries were disadvantaged vis-à-vis the British-owned concerns regarding wartime orders. Thus, the market expansion for foundry products led to group-level conflict between the British and Indian-owned foundries. Indian-owned large and medium-scale foundries needed to start a separate association to represent their interests. This gave rise to the Engineering Association of India (EAI) in 1942.
EAI represented the interests of Indian (as opposed to European) engineering and foundry manufacturers.Footnote 97 This newly formed association was affiliated with Indian business associations such as the Indian Chamber of Commerce (ICC) and the Federation of Indian Chamber of Commerce and Industry (FICCI). EAI helped its members to secure government contracts during the war. It further helped the members deal with the government, secure raw material supply, and introduce prospective customers. EAI’s membership increased as more and more Indian entrepreneurs ventured into the foundry industry. The total membership of EAI increased sharply from thirteen (in 1942) to 123 (in 1945) in three years. Thus, EAI gradually increased its influence in the cluster. The Association also facilitated the industry’s growth by promoting sector-specific associations such as machine tools, electric fans, and jute machinery.
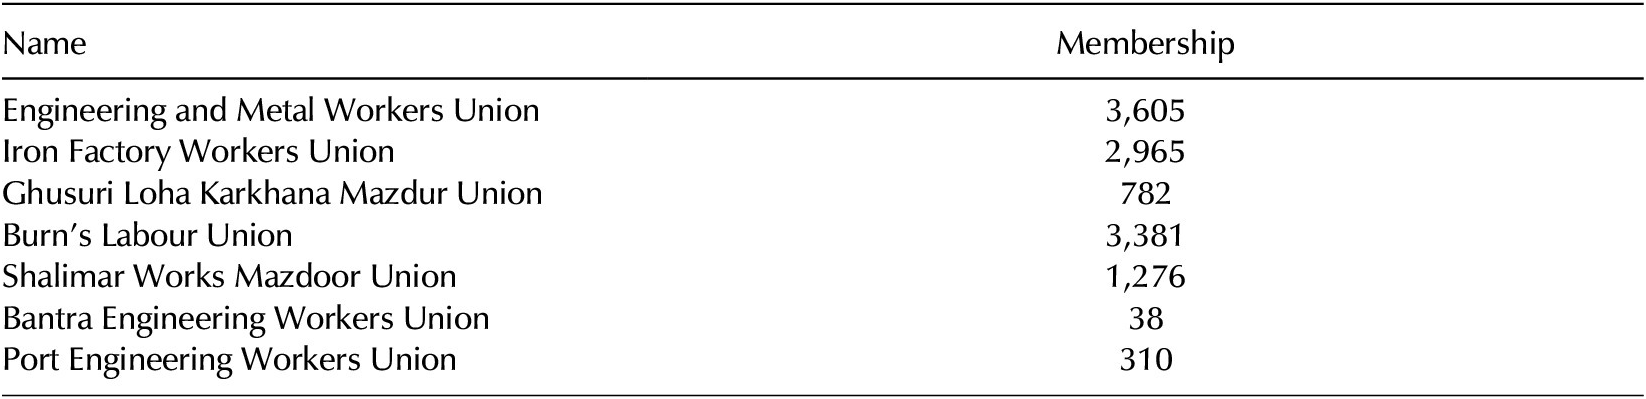
Trade union activity also gained ground in the foundry industry during this time. The first union, the Iron Factory Workers Union, catering specifically to the workers in the iron industry, was founded at Howrah in 1942. Its membership increased from two thousand in 1942 to 2,965 in 1947. The Engineering and Metal Workers Union membership increased from two hundred in 1938 to 3,605 in 1947. Ghusuri Loha Karkhana Mazdoor Union, catering to the iron foundry workers in Ghusuri (an area in Howrah), was started in 1947. It had 782 members. Several organizational-level unions within the Howrah foundry industry also emerged during this time. Burn’s Labour Union, Shalimar Works Mazdoor Union, Port Engineering Workers Union, and Bantra Engineering Workers Union were prominent among these. All the above unions were affiliated with AITUC. Table 4 below lists the unions in the Howrah foundry industry at the end of this period.Footnote 98
Trade unions catering to Howrah Foundry industry, 1947

Source. All India Trade Union Report, 1947Footnote 99
Change in Activities
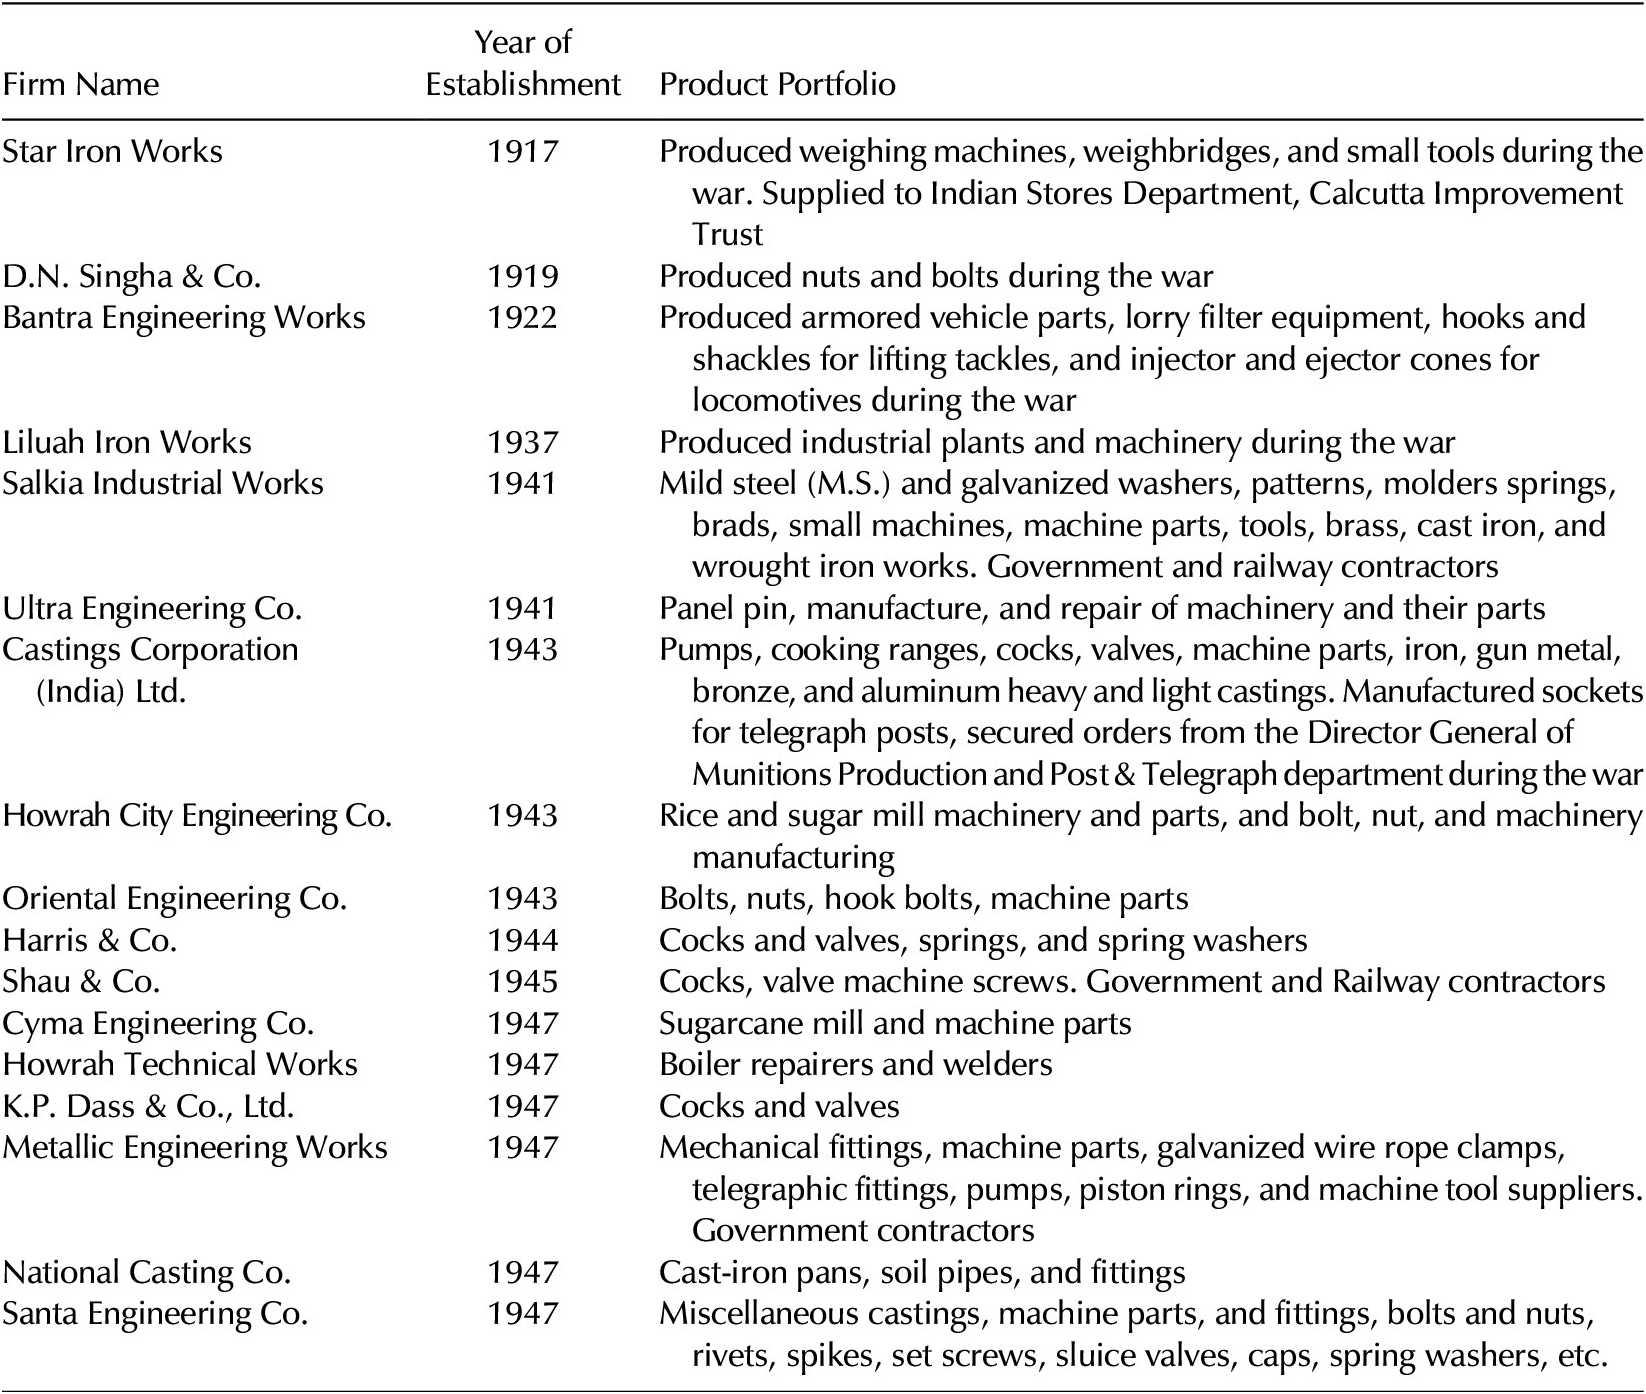
Many old foundries diversified their production towards war supplies during this period. Bantra Engineering Works manufactured armored vehicle parts during the war. D.N. Singha & Co. produced nuts and bolts. The new foundries established during this period focused on manufacturing wartime products such as nuts, bolts and screws, machine tools, and industrial machinery. These foundries prospered and grew as they received orders from larger firms. As the war ended, many foundries had to close due to a sudden decrease in demand. However, new foundries geared towards civilian products were established in the postwar years. A perusal of the product portfolio of firms established before, during, and after the war (Table 5) supports this observation.Footnote 100
Product portfolio of iron foundries in Howrah, 1939–1947

Source Thacker’s India Directory (various years), Indian Engineering Industries (various years)
Change in Location
The concentration of foundries along the Belilious Road area grew during this period. At the end of this period, three crucial foundry industry centers were Salkia, Belilious Road, and Bantra, with thirty (30 percent), twenty-three (23 percent), and eighteen (18 percent) foundries respectively. Out of ninety-nine foundries in 1947, eighty-seven (88 percent) were in Howrah Municipality, and eleven (11 percent) were outside Howrah Municipality. Liluah was an emerging center of the foundry industry outside the Howrah Municipality, with six foundries (6 percent).
Summary of Findings
Table 6 below summarizes the impact of key exogenous events on the Howrah foundry cluster.
Key exogenous events and changes in the Howrah Foundry cluster

The percentage of firms in Howrah Municipality (HM) and outside Howrah Municipality (OHM) in 1913 was 90 percent and 10 percent, respectively. This changed to 85 percent and 15 percent, respectively, in 1919. The percentage of firms in HM again rose to 94 percent in 1939. The percentage of firms in HM and OHM was 89 percent and 11 percent, respectively in 1947. The percentage of firms outside HM was higher in 1919 (15 percent) and 1947 (11 percent) as compared with firms outside HM in 1913 (10 percent) and 1939 (6 percent). This shows that periods of rapid expansion after exogenous shocks led to the founding of comparatively more firms outside HM. One of the reasons for this could be the increase in infrastructure cost, including land princes, in HM. This would have led some entrepreneurs to establish their firms outside HM. Thus, our findings suggest that compared with stable times, demand-expanding exogenous shocks would lead to establishing more firms in the geographical periphery of the cluster. This shows that exogenous shocks also affect the spatial dynamics in the cluster.
Discussion
Exogenous Shocks and Structural Conflicts
Exogenous shocks play a significant role in fostering cluster change.Footnote 101 The current study points to structural conflict as a mechanism facilitating this change. We show that exogenous shocks can lead to two types of structural conflicts: (1) conflict between groups of firms, and (2) conflict between labor unions and owners. Most of the existing literature focuses on interfirm conflict and competition in clusters. Extending Grabher’s typologyFootnote 102 of lock-in to analyze the conflict in a cluster, we can say that current literature focuses mainly on functional or dyadic interfirm conflicts within the cluster. In contrast, our findings shed light on group-level or structural conflicts in the cluster. Furthermore, most cluster studies on exogenous shocks point to integration, cooperation, coalescence, and collusion as a response to the shock.Footnote 103 Our findings show that exogenous shocks also lead to conflicts and fragmentation in a cluster. These conflicts arise from social and organizational heterogeneityFootnote 104 among actors (firms) in the cluster. In contrast to extant studies that characterize exogenous shocks as demand constrictingFootnote 105, our findings show that exogenous shocks can lead to demand creation and expansion. Demand-expanding exogenous shocks create opportunities for new firms to enter the cluster. The differences in social and organizational characteristics of the new and incumbent firms lead to group-level conflicts in clusters.Footnote 106 Incumbent firms are already well organized and better positioned to exploit the demand expansion. Therefore, the social and organizational homophily among new firms leads them to form separate associations to take advantage of the opportunities created by the exogenous shock.
In the present study, exogenous political shocks led to widespread regulatory change. These included changes in government regulations and the formation of organizations to implement those policies. These changes increased demand, lowered entry barriers, and made the cluster attractive for new firms. The entry of new actors or firms led to organizational (task-based) and social (ethnic) heterogeneity in the cluster. Europeans owned most of the large firms, whereas Indians owned most of the smaller firms. Wilson and Singleton pointed to religious heterogeneity in the Manchester cluster and showed that rivalry existed between the Anglican-owned large firms and Unitarian-owned small firms.Footnote 107 However, they did not explore the impact of this heterogeneity and rivalry on the cluster change. The current study shows that heterogeneity and diversity of actors in a cluster lead to group-level competition, conflict, and fragmentation in clusters. This fragmentation becomes formalized with the formation of rival industry associations. This facilitates a more equitable distribution of opportunities among different groups. However, excessive conflict between rival groups can also hamper cluster growth. Thus, our findings point to the group-level competitive and conflict dynamics in the cluster and support the characterization of clusters as “cooperative competitive” systems.Footnote 108
In addition to conflict between the new and incumbent actors, political shocks also lead to conflict among the cluster’s existing actors (firm owners and workers). Political shocks affect the well-being of workers and are stressful. In the current case, the shock of two world wars led to price increases and inflation. The rise in prices created difficulties for the workers in the cluster. This led them to agitate for wage increases and regulatory change. The workers formed trade unions to give a collective voice to their plight. Thus, the firm-level worker-owner conflicts were transformed into structural or group-level conflicts between the workers and the owners. This shows that the colocation of workers in a small geographical space makes industrial clusters more susceptible to the organization of workers’ discontent. The organized labor movement and trade union formation are more likely to start in an industrial cluster. This can have the beneficial effect of improving working conditions and promoting cluster growth by attracting a qualified labor pool.Footnote 109 This aligns with contemporary studies that highlight the positive aspect of the colocation of labor.Footnote 110 However, if the organization of labor assumes a militant proportion, this can also lead to the cluster’s decline. The current study shows that labor conflicts also led to the closing of some foundries. Thus, the conflict between existing actors (workers and owners) can lead to cluster growth and decline.
Dynamics of Cluster Governance
Industry associations play a vital role in the governance of clusters. It has been argued that these associations promote cooperation and coordinationFootnote 111 and facilitate knowledge exchange in clustersFootnote 112. However, the bridging role of trade associations in fostering collaboration between the cluster and external actors has received relatively less attention. The current study delineates the bridging activity of industry associations in ensuring cooperation among cluster firms, government agencies, and other influential industry associations. These bridging activities included lobbying for favorable policy changes and securing government orders. Industry associations also acted as a bridge between the individual industrialists and the government to remove the roadblocks faced by the entrepreneurs. These bridging activities became more salient during exogenous shocks when the cluster went through relative instability. Thus, the study shows that industry associations will gain importance during periods of instability.
The above findings point to the positive role of industry associations. This is in line with the findings of contemporary studies.Footnote 113 However, competing industry associations’ dynamics have received less attention in the cluster literature. The current research shows that group-level conflicts can lead to the formation of rival industry associations. Social and organizational proximity can prompt homophilous firms to float group-level associations to advance their specific interests.Footnote 114 For example, small-scale firms, who get subcontracting work from large firms, can form an association to increase their bargaining power vis-à-vis the larger firms. Furthermore, entrepreneurs with different social backgrounds can float a separate association to represent themselves. The formation of HMA and EAI representing smaller Indian foundries illustrates this dynamic. The existence of multiple industry associations representing different groups can contribute to the equitable distribution of opportunities and resources among these groups. However, it can also hinder cooperation, lead to unhealthy competition, and contribute to the cluster’s decline in the long run.
Indian Business History
The current study offers a microlevel glimpse into India’s industrialization. Regulatory changes during and after World War I and World War II promoted the growth of industries in different parts of India. Howrah was an important center of this industrial growth. The paper further sheds light on the development of small-scale industries, which has received only scant attention in the Indian business history literature. The literature has focused on large-scale industries such as jute and cotton textiles.Footnote 115 The history of small-scale foundries in Howrah highlights the struggles and tribulations of small-scale industries. It is well-recognized that colonial tariff policies hurt Indian industrialization.Footnote 116 The study shows that even when these policies were relaxed, they favored large-scale companies at the expense of small-scale units such as foundries. The small-scale industries further faced difficulties representing their interests to the government. The effort of small-scale foundries to set up rival associations and their consciousness of Indian identity points to the resilience of Indian entrepreneurs in preindependence India. The study also sheds light on the history of industry associations and their role in India’s industrial development. IEA and EAI were precursors to the contemporary pan-Indian industry association Confederation of Indian Industries (CII). These associations had a significant role in bringing about regulatory and institutional change to promote industrial growth.
Owens and Nandy documented that the Mahishya community was the predominant entrepreneur in the Howrah district in postindependence India.Footnote 117 This paper brings a dynamic perspective to the entrepreneurship story in Howrah. It shows that Europeans initially dominated the Howrah foundry industry. During World War I, Bengali owners of the Kayastha, Brahmin, and Baidya communities made a foray into this industry. The interwar years saw the emergence of the Mahisya community as new entrepreneurs in the Howrah district. During World War II, the Baidya entrepreneurs receded to the background. A minority of Marwari entrepreneurs entered this industry. During this time, just before independence, Bengali Brahmin, Kayastha, and Mahisya communities came to occupy the center stage as entrepreneurs in Howrah. Owens and Nandy attribute the rise of Mahisya entrepreneurs to the low cost of entry and the communities’ desire to gain social status. The current study shows that the presence of suitable role models was another reason for an increase in Mahisya entrepreneurs. Mahisya entrepreneurs played an active role in the collective organization of Indian entrepreneurs. They were at the forefront of organizing activities in HMA and EAI. This gave greater visibility to Mahisya entrepreneurs and attracted a new generation of entrepreneurs.
The study also draws attention to novel data sources used only sparingly in the past literature. One of the critical data sources used in this study is the Large Industrial Establishments. It was a biannual list of industries published from 1911 to 1978. It listed factories belonging to various sectors in different parts of India. Scholars can use this source to prepare a detailed database of industrial clusters in preindependence India.
Future studies can also draw upon these data sources to conduct a more detailed analysis of microlevel industrial developments in different parts of India. These microlevel studies can bring attention to hitherto neglected dimensions of Indian industrialization. Future studies on Indian industrial clusters can also explore the role of specific communities, local industry associations, and small entrepreneurs in Indian industrialization. The challenges faced by small-scale industries differed from those of large-scale industries. Dealing with these challenges requires an innovative mindsetFootnote 118. Future studies can explore the specific challenges faced by small-scale firms and the innovative solutions they designed to navigate them.
Conclusion
This study examines the role of exogenous shock in cluster change. It shows that exogenous shocks can impact the cluster positively by bringing changes in regulations and increasing the demand for the cluster’s products. However, the increase in opportunities also leads to conflict among firms in the cluster. The conflict plays out at the group level, with homophilous firms forming group-level associations. This leads to fragmentation of the cluster. Thus, the study shows that exogenous shocks can lead to group-level conflicts and fragmentation. The study further indicates that the bridging role of industry associations will increase during periods of instability driven by exogenous shock. The study also sheds light on the influence of rival associations on cluster governance dynamics. The research also contributes to the literature on Indian business history. It brings attention to the growth dynamics of small-scale industries and sheds light on entrepreneurship dynamics in the Howrah district. It also highlights novel data sources for microlevel studies on industrial development in preindependence India.
Appendix
Statistics relating to coal production in India and Eastern India, 1914–1947

Source: Record of the Geological Survey of India (various years), Report of the Coalfield Committee 1946, Statistical Abstract India 1949
Statistics relating to pig iron production, 1914–1947

Source: Record of the Geological Survey of India (various years), History of Technology in India - Vol III, Report on Removal of Revenue Duty on Pig Iron, Calcutta Stock Exchange Yearbook–1941.
Statistics on foundry firms, 1913–1947 (births and deaths)

Source: Large Industrial Establishments (various years), Thacker’s India Directory (various years).
Statistics on foundry firms, 1913–1947 (firms by size)

Statistics on foundry firms, 1913–1947 (employees by firm size)

List of data sources