The Attention Deficit Hyperactivity Disorder (ADHD), one of the most common among children and adolescents, includes symptoms such as inattention, hyperactivity, and impulsivity. Despite the behavioral heterogeneity and the variations insymptomatology and severity of symptoms between the different cases, Willcutt, Doyle, Nigg, Faraone, and Pennington (Reference Willcutt, Doyle, Nigg, Faraone and Pennington2005) meta-analysis showed that the common deficits between affected children are related to attention, response control and inhibition. In addition, frequent comorbidity with Behavior Disorders, Anxiety Disorders and Learning Disorders (Millichap, Reference Millichap2011; Pliszka, Reference Pliszka2009) and different responses to standard treatments have been observed. The prevalence of ADHD varies between 2.2 and 17.8% (Skounti, Philalitis, & Galanakis, Reference Skounti, Philalithis and Galanakis2007), ranging between 4.6% (Cardo, Servera, & Llobera, Reference Cardo, Servera and Llobera2007) and 4.8% (Lora & Moreno, Reference Lora and Moreno2010) within the Spanish population. Although the observed variability between studies depends on many other factors, such as diagnostic criteria used in single-case studies, assessment methods used, source of information, type of sample, socio-cultural variables (sex, age, socioeconomic status, geographic area) and subtype differentiation within studies, among others.
The diagnostic difficulties encountered, along with the methodological imprecision found in the studies, have encouraged the use of the Continuous Performance Test (CPT) either for diagnostic purposes or for determining the effectiveness of the treatments used. These tests are considered objective measures for the diagnosis of ADHD. Moreover, by providing measures of omission and commission errors, reaction times and response variability throughout the test, they allow for the assessment of sustained attention and hyperactive-impulsive behaviors (Nichols & Waschbusch, Reference Nichols and Waschbusch2004). Several studies contrast, through continuous performance tests, the profile of children diagnosed with ADHD and that of children with normal development. These studies yielded high effect sizes in relation to commission and omission errors, and variability of reaction times with a moderate effect size (Huang-Pollok, Karalunas, Tam, & Moore, Reference Huang-Pollock, Karalunas, Tam and Moore2012). Nichols and Waschbusch (Reference Nichols and Waschbusch2004) highlighted economized time and effort, high internal validity, control of strange variables and easy application regarding these tests.
The Continuous Performance Tests are sensitive to differentiating individuals suffering from this disorder, compared to patients with other disorders (Advokat, Martino, Hill, & Gouvier, Reference Advokat, Martino, Hill and Gouvier2007; Willcutt et al., Reference Willcutt, Pennington, Boada, Ogline, Tunick, Chhabildas and Olson2001). In addition, these tests distinguish between different subtypes of ADHD (Collings, Reference Collings2003) and compare the relationship between intellectual level and implementation of children with ADHD in this type of testing (Park et al., Reference Park, Kweon, Lee, Park, Lee and Lee2011). Moreover, they discriminate between individuals with and without ADHD (Tucha et al., Reference Tucha, Tucha, Walitza, Sontag, Laufkötter, Linder and Lange2009) and individuals diagnosed with ADHD compared to patients who also exhibit comorbidity with other disorders (Greimel, Herpertz-Dahlmann, Günther, Vitt, & Konrad, Reference Greimel, Herpertz-Dahlmann, Günther, Vitt and Konrad2008).
Previous research has provided evidence on the relationship between the information collected through the Continuous Performance Test and other traditional assessment methods. Epstein et al. (Reference Epstein, Erkanli, Keith, Klaric, Costello and Angold2003) found a relationship between a continuous performance test and ADHD diagnostic criteria assessed during an interview with the parents. Lehman, Olson, Aquilino, and Hall (Reference Lehman, Olson, Aquilino and Hall2006) found congruency between CPT performance and rating scales. However, this relationship is not without some controversy, as other research has found that the relationship between scales and CPTs is non-existent or scarce (Gualtieri & Johnson, Reference Gualtieri and Johnson2005; Naglieri, Goldstein, Delauder, & Schwebach, Reference Naglieri, Goldstein, Delauder and Schwebach2005).
The Continuous Performance Test has been used as a task to be performed while registering neuropsychological measures in ADHD patients (Heinrich, Gevensleben, Freisleder, Moll, & Rothenberger, Reference Heinrich, Gevensleben, Freisleder, Moll and Rothenberger2004; Levesque, Beauregard, & Mensour, Reference Levesque, Beauregard and Mensour2006; Rubia et al., Reference Rubia, Halari, Cubillo, Mohammad, Brammer and Taylor2009). Other studies have compared and related them to neuropsychological assessments (Oades, Myint, Dauvermann, Schimmelmann, & Schwarz, Reference Oades, Myint, Dauvermann, Schimmelmann and Schwarz2010; Ogrim, Kropotov, & Hestad, Reference Ogrim, Kropotov and Hestad2012; Shi et al., Reference Shi, Ki, Song, Zhao, Sun, Xia, Wu and Tomoda2012), also taking into account comorbidity of ADHD with learning difficulties (Padolsky, Reference Padolsky2008). Other researchers (Gutiérrez-Maldonado, Letosa-Porta, Rus-Calafell, & Peñaloza-Salazar, Reference Gutiérrez-Maldonado, Letosa-Porta, Rus-Calafell and Peñaloza-Salazar2009; Pollak et al., Reference Pollak, Weiss, Rizzo, Weizer, Shriki, Shalev and Gross Tsur2009) have administered these tests in combination with virtual reality technology in order to provide greater ecological validity to such diagnostic tools. Its use has also been useful in monitoring the effects of treatments (Heinrich et al., Reference Heinrich, Gevensleben, Freisleder, Moll and Rothenberger2004; Monastra, Monastra, & George, Reference Monastra, Monastra and George2002; Yan et al., Reference Yan, Wang, Liu, Zong, Jiao and Yue2008).
Among the Continuous Performance Tests, the Integrated Visual and Auditory Continuous Performance Test (IVA/CPT) (Sandford & Turner, Reference Sandford and Turner2000), based on the DSM-IV-TR diagnostic criteria (APA, 2002) for ADHD, evaluates attention and response control when visual and auditory stimuli are presented. The IVA/CPT has been used as a diagnostic tool, together with other instruments, to assess subjects with suspected ADHD (Coben & Myers, Reference Coben and Myers2009). It has also been used to assess attentional deficits and behavioral control in children diagnosed with Autism Spectrum Disorder (ASD), compared to children diagnosed with ADHD and normal population (Corbett & Constantine, Reference Corbett and Constantine2006; Corbett, Constantine, Hendren, Rocke, & Ozonoff, Reference Corbett, Constantine, Hendren, Rocke and Ozonoff2009). The validity of this test (IVA/CPT) as a diagnostic tool has been explored in comparison to rating scales based on DSM-IV (APA, 2002) and the CCMD-3 (The Chinese Classification and Diagnostic Criteria Of Mental Disorders, version 3, CCMD-3) (Chinese Society of Psychiatry, 2001) in children with suspected ADHD (Pan, Ma, & Dai, Reference Pan, Ma and Dai2007). In adults, the IVA/CPT has been used to assess differences between individuals exhibiting ADHD symptoms and those without ADHD symptoms (Quinn, Reference Quinn2003; White, Hutchens, & Lubar. Reference White, Hutchens and Lubar2005). Moreover, it has been used to specify attentional and behavioral control deficits in stroke patients (adults) compared to ADHD and control samples (Tinius, Reference Tinius2003).
The IVA/CPT has been used in research on treatment efficacy. It has been administered to compare the effects of drug therapy with respect to changes in diet (Harding, Judah, & Gant, Reference Harding, Judah and Gant2003) or to determine the therapeutic efficacy of neurofeedback (Levesque, Beauregard, & Mensour, Reference Levesque, Beauregard and Mensour2006; Moreno, Delgado, Aires, & Meneres, Reference Moreno, Delgado, Aires and Meneres2013; Xiong, Shi, & Xu, Reference Xiong, Shi and Xu2005; Yan et al, Reference Yan, Wang, Liu, Zong, Jiao and Yue2008) in children with ADHD and in adolescents with behavioral problems (Smith & Sams, 2005). In addition, Tinius and Tinius (Reference Tinius and Tinius2000) applied this test to determine the improvement in characteristic symptoms of ADHD in multimodal interventions (neurofeedback and cognitive therapy) administered to adults.
Research reports significant differences in the variables that measure attention and behavioral control with visual and auditory stimuli when comparing performance of children with ADHD in pre-and post-treatment stages, after undergoing different therapeutic modalities (Harding et al., Reference Harding, Judah and Gant2003; Levesque et al., Reference Levesque, Beauregard and Mensour2006; Moreno et al., Reference Moreno, Delgado, Aires and Meneres2013; Xiong et al., Reference Xiong, Shi and Xu2005). Other studies have observed significant improvements through the IVA/CPT, exclusively at an attentional level (Yan et al., Reference Yan, Wang, Liu, Zong, Jiao and Yue2008).
On the other hand, regarding the IVA/CPT’s psychometric properties relating to child populations, Corbett and Constantine (Reference Corbett and Constantine2006) and Corbett et al., (Reference Corbett, Constantine, Hendren, Rocke and Ozonoff2009) conducted two studies in which they compared children diagnosed with ADHD with children diagnosed with Autism Spectrum Disorder (ASD) (high performance, with IQ above 70) and a group of children with normal development. Regarding the ADHD group and the normal development group, significant differences in visual and auditory attention were found. Comparing the ASD group with the normal development group, significant differences in attention and response control were found at a visual and auditory level. The comparison between the ADHD group and the ASD group revealed similar deficits, except in response control at visual level, which yielded significant differences, showing a worse performance of the ASD group. The IVA/CPT showed a moderate ability to classify participants with ADHD (66.7%) and those without disorders (73.3%) and a good ability to classify the ASD participants (86.7%). An excellent sensitivity for the ADHD group and low specificity for the standard development group was observed. This study also analyzed the convergence between information obtained through the continuous performance test and a scale for parents that evaluates characteristic symptoms of ADHD, finding a moderate correlation with attention, and no relationship between the hyperactivity and impulsivity indices.
In a later study, when comparing the ADHD group with a group of normally developing children, Corbett et al. (Reference Corbett, Constantine, Hendren, Rocke and Ozonoff2009) found significant differences in visual and auditory attention and in response control at an auditory level. The differences found in the previous study were confirmed between the ASD and the normal development group, and between ADHD and ASD groups.
Pan et al., Reference Pan, Ma and Dai2007 assessed, through the IVA/CPT, the Chinese pediatric population with suspected ADHD identified through the diagnostic criteria according to DSM-IV (APA, 2002) or CCMD-3 (Chinese Society of Psychiatry, 2001). When the results of the IVA/CPT were compared with the DSM-IV diagnostic criteria, no significant differences were observed in the rate of positive cases, with a sensitivity of 71.6% and specificity of 56.5% for the IVA/CPT. In the group that used the CCMD-3 as diagnosis, no significant differences were found in the rate of positive cases, where a sensitivity and specificity for IVA/CPT of 72.7% and 46%, respectively, was observed.
In the adult population area, the IVA/CPT has been used to assess differences in attentional ability and self-control of adults with and without ADHD diagnosis (Quinn, Reference Quinn2003; White et al., Reference White, Hutchens and Lubar2005). It has also been administered to compare adults with and without ADHD and adults who have suffered cerebrovascular infarcts (Tinius, Reference Tinius2003). The results of this research have shown that there are significant differences in attention evaluated through the various scales of the IVA/CPT (Quinn, Reference Quinn2003; Tinius, Reference Tinius2003). However, the findings regarding response control are inconclusive. The studies by Quinn (Reference Quinn2003) and White, Hutchens, and Lubar (Reference White, Hutchens and Lubar2005) found no significant differences in the ratios for the global auditory visual response control or in the primary scales within them. Meanwhile, Tinius (Reference Tinius2003) reported significant differences between adults with and without ADHD diagnosis for some variables related to behavioral control.
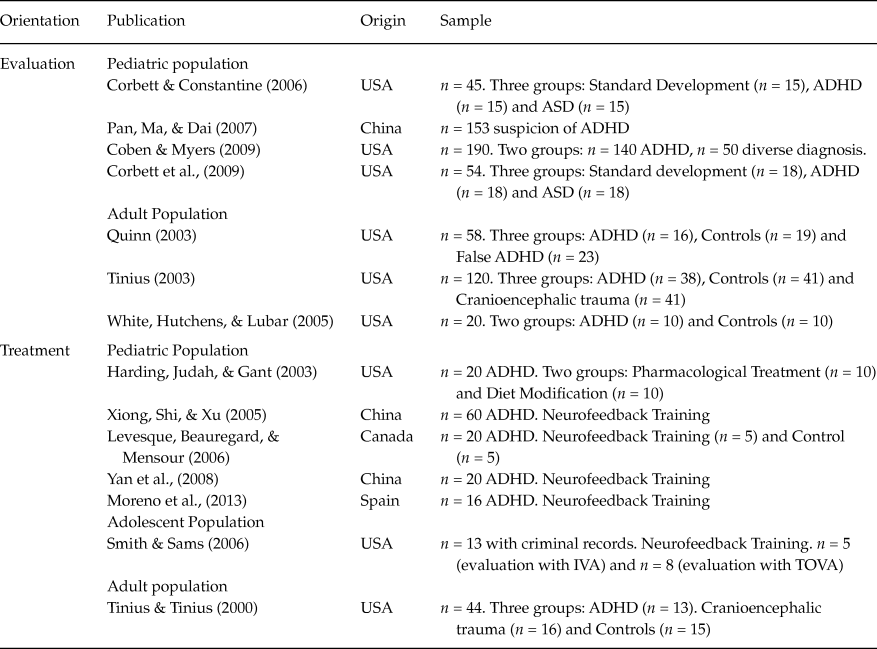
To summarize, the studies that have employed IVA/CPT are presented in Table 1, indicating the purpose of the research, the population of interest and its geographic characteristics.
Research studies that have employed IVA/CPT

Note: The following variables were considered: objective of the administration (for evaluation purposes or to investigate treatment effectiveness), type of population, geographical origin and characteristics of the sample. ADHD = Attention Deficity Hyperactivity Disorder. ADS = Autism Spectrum Disorder.
Considering previous research, the present study aims to evaluate attention and behavioral control in a population of Spanish children, using the IVA/CPT instrument (Sandford & Turner, Reference Sandford and Turner2000). Its relevance derives from the following aspects: (1) to implement the mentioned instrument, which, unlike other CPTs commonly used in the ADHD field, evaluates attentional and behavioral deficits when individuals are exposed not only to visual but also auditory stimulation; and (2) to determine the ability of the IVA/CPT to differentiate children with ADHD, compared to children without hyperactive-attentional symptoms, analyzing attentional performance and behavioral control in different stimulus situations.
The specific objectives of this study are: (a) to determine and compare the performance of two groups of children, those with ADHD diagnosis and those without any hyperactive-attentional symptoms, in areas related to attention and behavioral control, and (b) to identify possible attentional and behavioral control deficits in the group of children with ADHD.
Method
Participants
Between 2009 and 2012, 191 children, aged between 7 and 13 years old and attending the pediatric primary care clinics in the Sevilla-Sur district (Andalusian Public Health Care Service), took part in the study. Some of the children attended the clinic in relation to behavioral problems, and others, for medical reasons, differentiating two groups: a) children with suspected ADHD (n = 90) and b) children who showed no indicators of the disorder (n = 101).
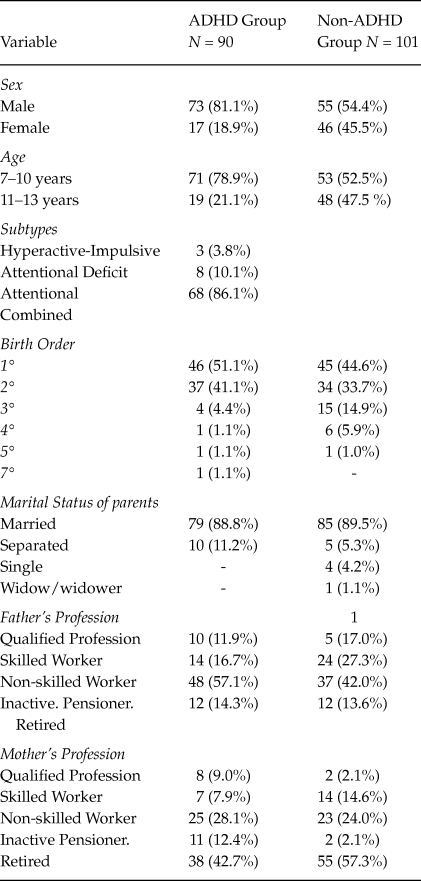
The ADHD group was composed of 90 participants aged between 7 and 13 years (M = 8.82, SD = 1.77), of which 81.1% were boys (n = 73) and 18.9% of girls (n = 17). In this group, 97.8% were biological children and 51.1% held first place in the birth order, 91% lived with first-degree relatives, and only 9% lived with second-degree relatives. Their demographic characteristics can be found in Table 2. A double filter method was used for the selection of this group of participants, taking into consideration the discrepancies between the diagnostic criteria and clinical criteria for ADHD discussed in previous studies (Lora & Moreno, Reference Lora and Moreno2010). All cases exceeded the 95th percentile for at least one of the subtypes of the disorder, according to the SNAP-IV (Swanson, Reference Swanson, Fine and Kotkin2003) rating scale, confirming their relevance to the DSM-IV-TR (APA, 2002) criteria. After initial screening and criterion contrast, parents and teachers completed the ADHD Rating Scale-IV (ADHD-RS) (DuPaul et al., Reference DuPaul, Power, Anastopoulos and Reid1998), confirming that children within this group were above 90th percentile in the teacher version and above the 80th percentile on the parent version.
Sociodemographical variables for the ADHD group and the group without ADHD symptoms (non-ADHD group)
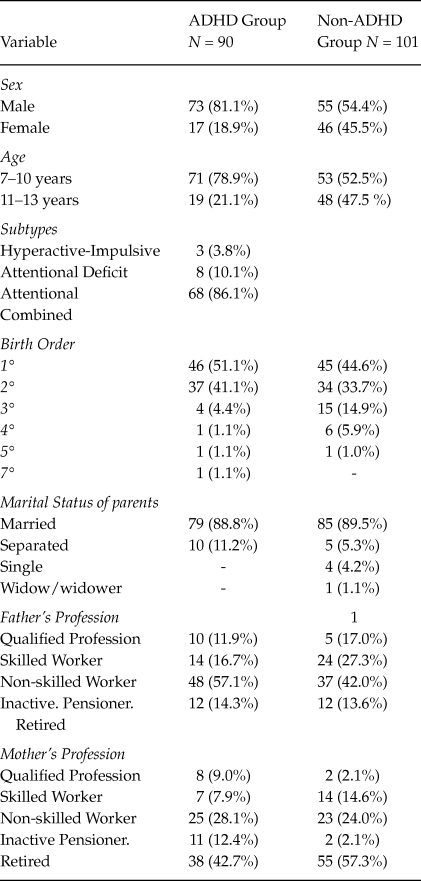
The non-ADHD group consisted of 101 participants aged between 7 and 13 years (M = 10.22, SD = 1.70), with 54.4% of boys (n = 55) and 45.5% of girls (n = 46). Within this group, 99% were biological children, 44.6% took first place in birth order, 85% lived with first-degree relatives, and 15% lived with second-degree relatives. Regarding their reason to attend the clinic, 25.7% suffered from flu and cold symptoms, 22.8% were attending their periodic review, 18.8% suffer from headaches, neck pain, back pain, etc…, 9.9% of children had dermatological problems, 5.9% presented stomach problems and finally, 16.8% of children had medical reasons not categorized in any of the groups previously mentioned. None of the children in this group attended the clinic due to behavioral, hyperactivity, impulsivity, and/or attention problems. Their demographical characteristics can be found in Table 2.
The following inclusion criteria have been observed. For the ADHD group: (a) they must be aged between 7 and 13 years; (b) suspicionof ADHD should arise in their pediatric examination, (c) they must exceed the 95th percentile of the SNAP-IV scale (Swanson, Reference Swanson, Fine and Kotkin2003) for any of the ADHD subtypes and, (d) they must be above the 90th percentile in the teachers’ version and have scores above the 80th percentile in the parents’ version of the ADHD Rating Scale-IV (ADHD-RS) (DuPaul et al., Reference DuPaul, Power, Anastopoulos and Reid1998). For the group without ADHD: (a) they must be aged between 7 and 13 years, (b) they must attend primary care for pediatric reasons, and (c) they should not present any symptoms related to a hyperactivity-attentional disorder. Children who met these criteria were selected and all agreed to participate in this research.
Materials and Method
SNAP-IV Abbreviated version (Swanson, Reference Swanson, Fine and Kotkin2003 )
This scale is adapted to the DSM-IV ADHD criteria and is one of the most used in pediatric primary care in this area. It is composed of 18 items that assess inattention, hyperactivity and impulsivity. It has four response options, ranging between 0 and 3. It yields a global score and a partial score acording to subtypes. There are versions for parents and teachers, with differentiated scales and cutoffs. In the present study, it was used as a source of information for parents.
ADHD-Rating Scales-IV (ADHD RS-IV, DuPaul et al., Reference DuPaul, Power, Anastopoulos and Reid1998)
This scale, commonly used for classification and/or diagnosis of children with ADHD, has outstanding levels of reliability and validity (Lora & Moreno, Reference Lora and Moreno2010). It consists of two subscales, inattention and motor impulsivity-overactivity, both with nine items each. It has four response alternatives ranging from “never or almost never” to “very often”. It is possible to obtain three values: a global index that provides an overall assessment of the disorder in the evaluated child, another score that indicates attention deficit and a third score that evaluates hyperactivity-impulsivity. There are two versions of this scale, for parents and teachers. Both versions have been used in this present study.
Family Information Questionnaire
This instrumentwas designed ad hoc, based on the Clinical Interview Form for Child and Adolescent ADHD Patients (Barkley, Reference Barkley1998). It provides information on the socio-demographic and family variables of the participants. For the group without the disorder, a shortened version of the instrument was used in which issues related to ADHD were removed.
Integrated Visual and Auditory Continuous Performance Test (IVA/CPT, Sandford & Turner, Reference Sandford and Turner2000)
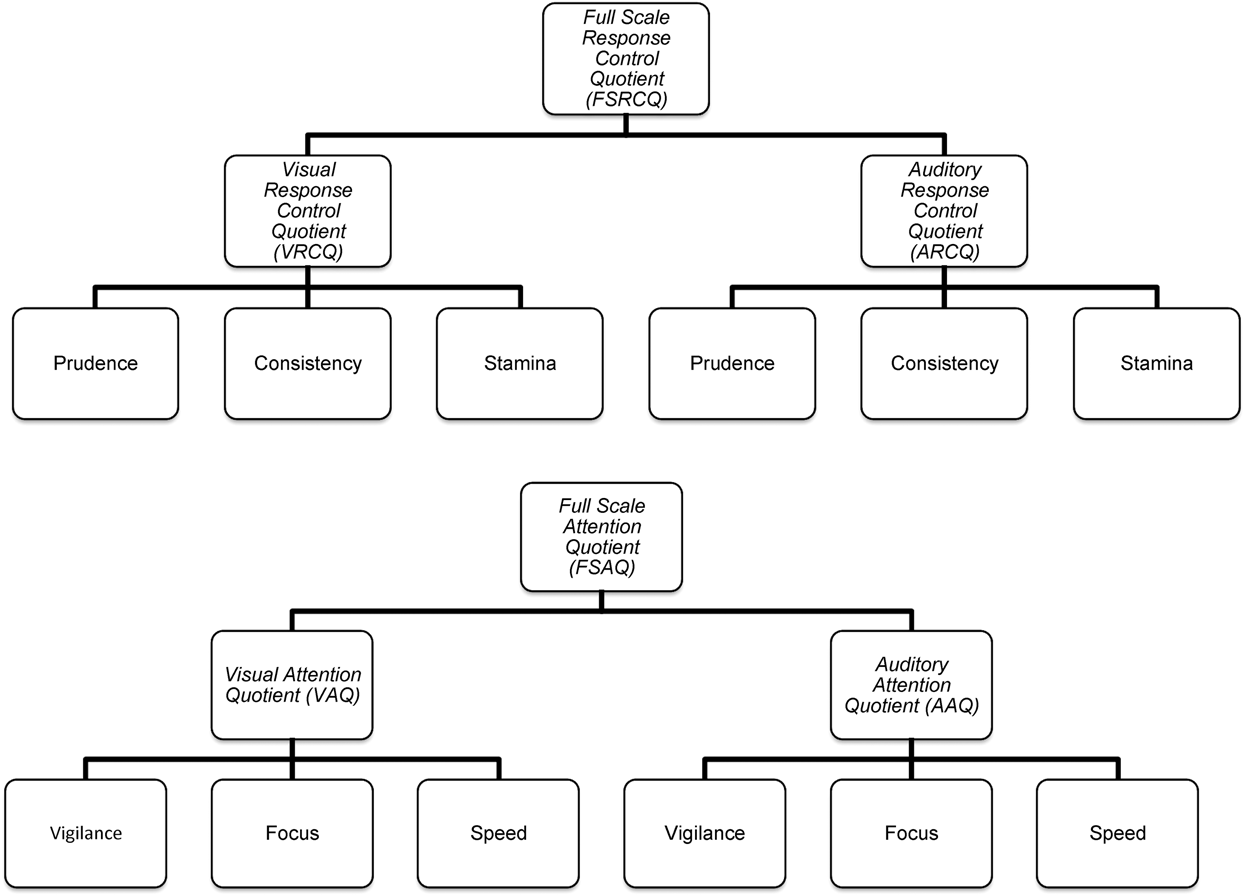
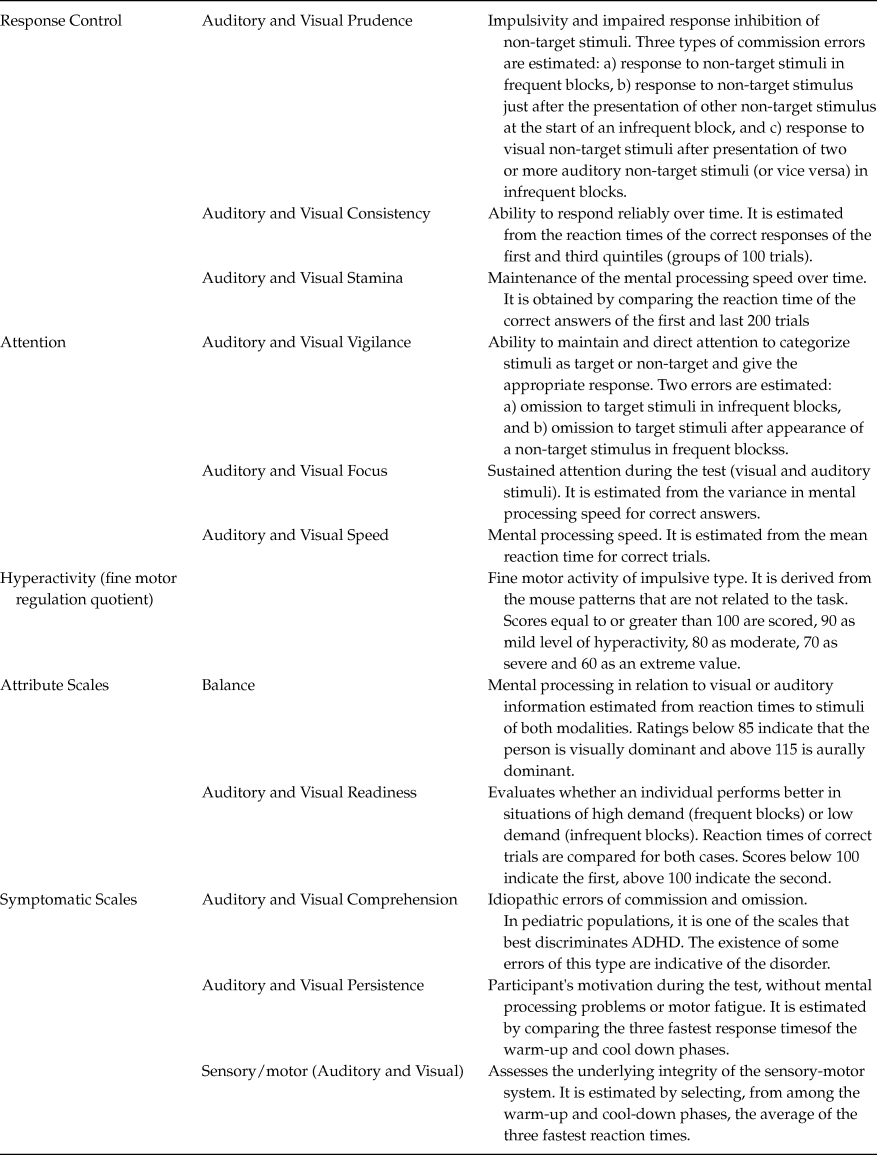
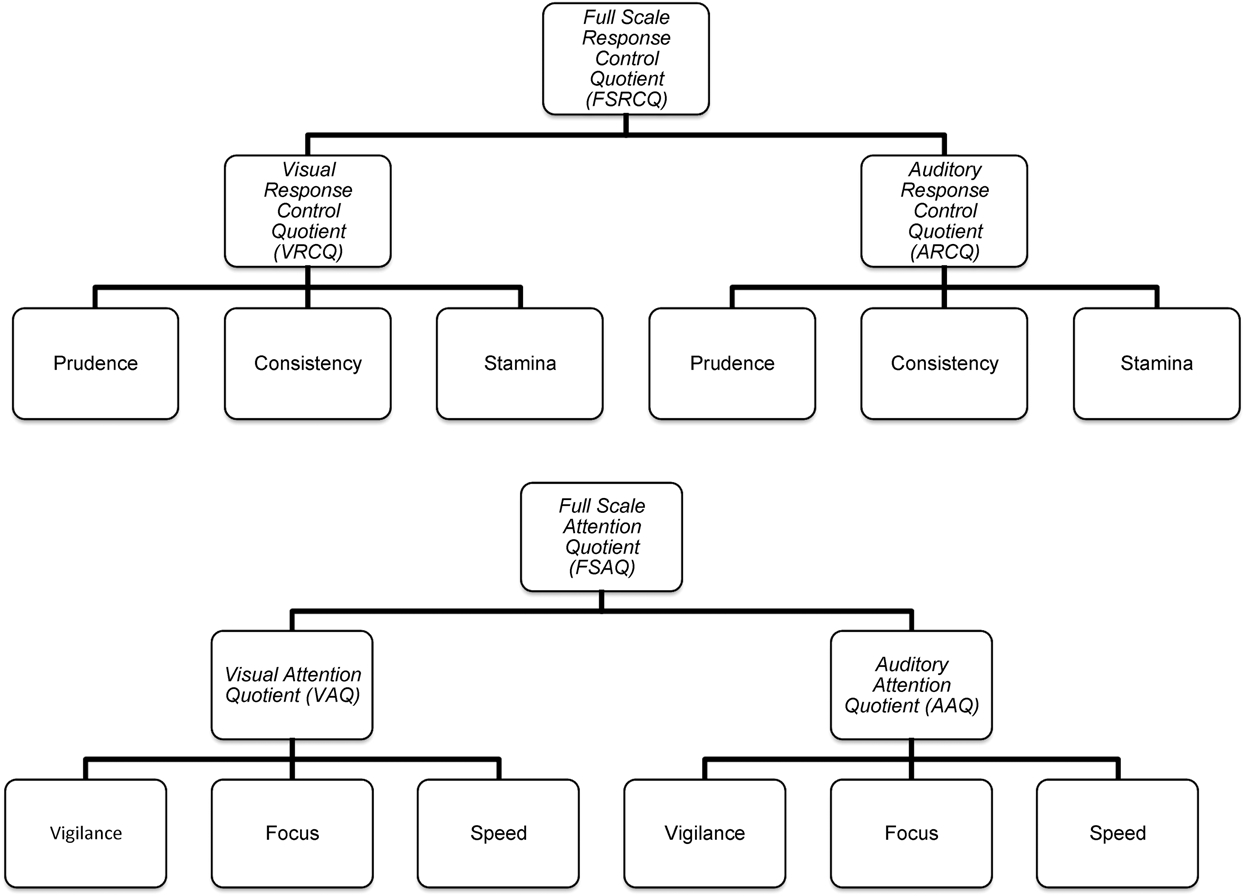
It evaluates attention and response control at an auditory and visual level. Its application time is 20 minutes and can be administered to children (from 6 years onwards), adolescents, and adults. It has a test-retest reliability between .37 and .75 on the various scales it is composed. When compared with other continuous performance tests (TOVA/CPT) or parent scales for the diagnosis of ADHD, the IVA/CPT shows a sensitivity of 92% and a 90% of specificity (Sandford & Turner, Reference Sandford and Turner2000). The test provides 28 scores related to 6 global indexes and 22 scales that allow to fully understand the nature of the deficits of the evaluated patient. All scales and ratios are positively defined, and results are presented as standardized ratios with a mean score of 100 and a standard deviation of 15. The 6 global indexes aim to summarize the overall performance of the evaluated child in terms of response control and attention (Figure 1). The 22 scales are conceptually grouped into four categories: (1) Scales regarding response control; (2) Scales that assess attention, serving in both, the visual and auditory dimension, depending on the nature of the stimulus presented; (3) Scales based on attributes (Balance and Readiness) show response patterns that provide insight into the learning styles of the subjects tested; and (4) Symptomatic scales and hyperactivity (Comprenhension, Persistence and Sensory/Motor) that evaluate the performance of the participants with regard to their understanding of the test, its implementation and cooperation shown during the execution of the task (Table 3).
Structure of the IVA/CPT. Six overall global indexes and primary scalesthat define the overall performancein response control and attention.
Source: Tinius (Reference Tinius2003).
Description and content of the studied variables. Corresponding to the 22 primary scales defined in the IVA/CPT (Sandford & Turner, Reference Sandford and Turner2000)

The scales that assess attention and response control are grouped into 6 primary scales (each with a score relative to the visual path and another score relative to the auditory path): Prudence, Consistency, Stamina, Vigilance, Focus, and Speed. In turn, these six primary scales are associated in 2 general coefficients and in 4 coefficients that arise from the subdivision of the general coefficients in their auditory and visual aspects. Therefore, Prudence, Consistency and Stamina form the Full Scale Response Control Quotient (FSRCQ), differentiating between Auditory Response Control Quotient and Visual Response Control Quotient, according to type of stimuli presented during the performance of such primary scales. Futhermore, Vigilance, Focus, and Speed conform the Full Scale Attention Control Quotient, which also distinguishes between the Auditory Attention Quotient and the Visual Attention Quotient (Figure 1).
The studied variables correspond to the ratios and scales defined in the IVA/CPT. Their description can be seen in Table 3.
Procedure
Following the selection of the participating children, inclusion in the respective groups was performed according to the following procedure. After the initial consultation, the pediatrician, after assessing the child's symptoms and determining there was suspicion of ADHD, administered the SNAP-IV scale (Swanson, Reference Swanson, Fine and Kotkin2003), using parents as informants. Once the ADHD suspicion was confirmed, the pediatrician gave parents the parents and teachers’ version of DuPaul et al.’s (Reference DuPaul, Power, Anastopoulos and Reid1998) ADHD-Rating Scales-IV (ADHD RS-IV), with a commitment to fullfill it before the evaluation of the child. In a later session, after explaining the procedure to parents, seekingtheir informed consent, collecting the completed scale (by both informants) and confirming the established criteria have been met, the evaluation of the child took place. Meanwhile, parents completed the Family Information questionnaire.
For the group without ADHD, when the child came to the clinic with some pediatric demand and met the defined inclusion/exclusion criteria, pediatricians proposed participation in the study to the parents. Both parents and child were given information about the study and the characteristics of the evaluation, while informed consent was requested. After their agreement and acceptance on behalf of the parents, the child’s evaluation took place, with an approximate duration of 30 minutes. Simultaneously, parents completed the Family Information questionnaire.
In all cases, the IVA/CPT was administered according to its instructions. While the original version presents written and audio instructions, there is no such option for versions in other languages. For this reason, in the Spanish version, instructions were provided by the evaluator.
Data Analyses
Statistical analyzes were performed using SPSS (version 20). Descriptive analyzes of both groups have been performed regarding the variables that assess attention and behavioral control, in order to know the average values of each scale that evaluates both aspects.
In order to analyze the existence of differences between the groups with ADHD and those without ADHD, a multivariate analysis of variance (MANOVA) was carried out to assess the measures related to attention and response control together (Overall indexes, visual and auditory scores). The statistic used was Wilks' Lambda. In order to identify the specific deficits in the attentional area, the Auditory Vigilance, Auditory Focus, Auditory Speed, Visual Vigilance, Visual Focus and Visual Speed variables were jointly analyzed. Post hoc analyses were performed, using the Bonferroni statistic, to determine which paired comparisons were significant between the variables. With the aim of identifying specific deficits in the response control area, the Auditory Prudence, Auditory Consistency, Auditory Stamina, Visual Stamina, Visual Prudence, and Visual Consistency variables were analyzed jointly. The existence of differences between the studied groups in other aspects evaluated by the continuous performance test IVA was also checked. An analysis of variance (ANOVA) was performed using Hyperactivity, Balance, Readiness and the symptomatic scales Visual and Auditory Comprehension, Visual and Auditory Persistence, and Visual and Auditory Sensory-motoras dependent variables.
Homogeneity of variances was assessed through the Levene statistic for all scales. When the assumption of homoscedasticity was met, ANOVA’s F statistical was used. However, in cases where there was heteroscedasticity, the robust Welch’s T measure was used.
Results
Given the defined objectives, with the purpose of comparing the performance of both groups in attention and behavioral control, the results corresponding to the analysis and comparison of the two groups across attentional variables, response control, hyperactivity, attributes and symptomatic scales are provided. For each case, data are presented taking into account any specific deficits in attentional and behavioral variables.
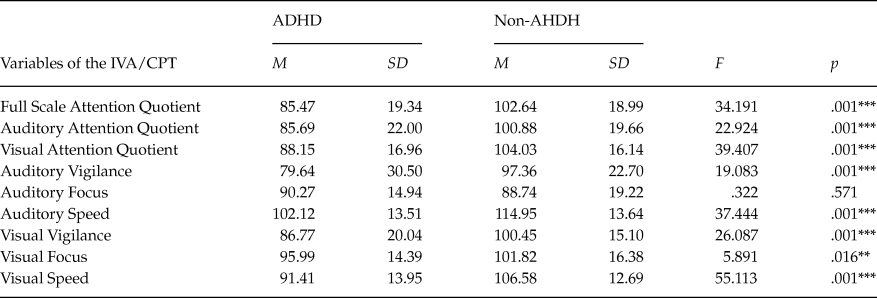
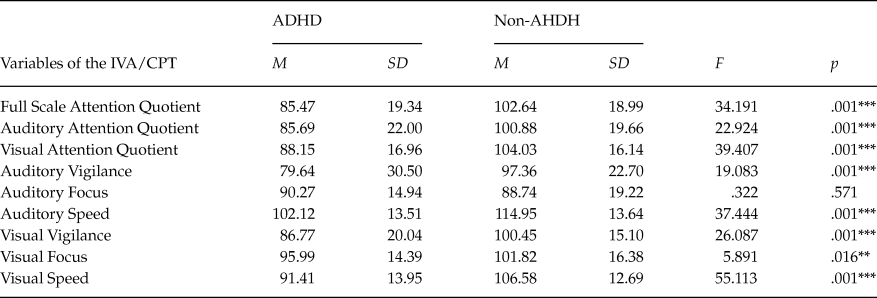
Next, the results for the comparison between groups, ADHD and non-ADHD, are presented, based on possible attentional deficits registered with visual and auditory stimulation (measured using the Full Scale Attention Quotient, Visual Attention Quotient and Auditory Attention Quotient) (Table 4).
Analysis of the differences between groups, ADHD and non-ADHD, for the attentional
Note: ** p ≤ .01; ***p < .001.
As can be observed, higher means were found in the group without ADHD for all indexes: Full Scale Attention Quotient, Auditory Attention Quotient and Visual Attention Quotient (Table 4). On the other hand, statistically significant differences were found between subjects with ADHD and without ADHD, F(3, 170) = 14.38, p < .001; Wilks’ Lambda = .80. Partial Eta Squared =.20. These differences can be observed when considering both, Global attention and Type of stimulus presented, i.e. Auditory attention and Visual attention, noting that children without ADHD obtained higher mean scores (Table 4).
After comparing both groups and specifically analyzing possible deficits in children with ADHD, results showed that the group without ADHD symptoms obtained higher means than the ADHD group in the ability to maintain attention to visual and auditory stimuli and to respond appropriately to them (Visual Vigilance and Auditory Vigilance). The mean scores obtained by the group without ADHD symptoms were also higher in the variables that assess sustained attention (Focus scales), especially in relation to visual stimuli, and with respect to the speed of mental processing observed with visual and auditory stimuli (Visual Speed and Auditory Speed scales) (Table 4). When the possible differences between the groups with ADHD and without ADHD were analyzed, taking all measures related to attention jointly (Auditory Vigilance, Auditory Focus, Auditory Speed, Visual Vigilance, Visual Focus, Visual Speed), results showed significant differences between group members, with ADHD and without ADHD, F(6, 165) = 11.25, p < .001; Wilks’ Lambda = .71, Partial Eta squared = .29. The differences between groups for all measures were significant, except when sustained attention to auditory stimuli (Auditory Focus) (p = .571) was evaluated. Children without ADHD obtained higher average scores for these variables, compared to ADHD group (Table 4).
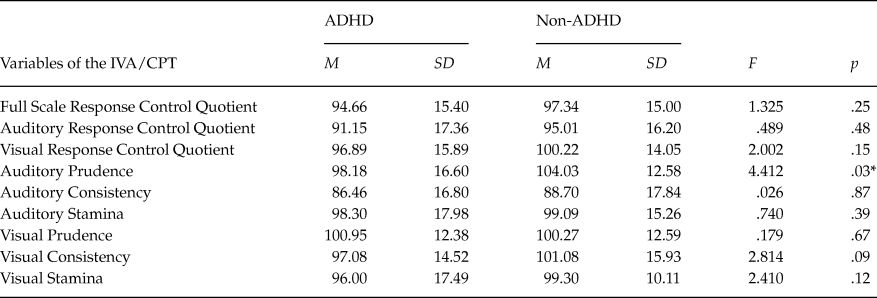
The data obtained regarding behavioral control, when stimuli presented are both, visual and auditory, showed that the group without ADHD symptoms obtained higher scores for all variables: Full Scale Response Control Quotient, Auditory Response Control Quotient, and Visual Response Control Quotient (Table 5). Considering all these measures together, in relation to response control, the data obtained in the multivariate analysis showed that there were significant differences observed between the groups of subjects with ADHD and those without ADHD, F(3, 170) = .93, p = .43; Wilks’ Lambda = .98. Partial Eta squared = .01.
Analysis of the differences between groups, ADHD and non-ADHD

Note: * p ≤ .05.
When results were analyzed and both groups were compared according to specific variables, related to impulsivity and motor inhibition to visual and auditory stimulation and sustained mental effort (Table 5), higher mean scores were observed for the non-ADHD group (Auditory Prudence and Visual Prudence, Auditory Consistency and Visual Consistence). Furthermore, the ADHD group obtained lower scores when regular issuance of responses during task execution was evaluated, both for visual (Visual Stamina) and auditory (Auditory Stamina) stimuli. However, considering such differences together, the multivariate analysis MANOVA showed they were non-significant, F(6, 167) = 2.14, p = .05; Wilks’Lambda = .93. Partial Eta squared = .07. However, as can be observed in the univariate contrast (Table 5), there was significant differences between Auditory Prudence and Visual Consistency variables.
The significant results found for the variables related to the characteristic symptoms of ADHD (major scales of the IVA/CPT) showed that the differences between both groups were related to attentional symptoms, observing differences for only one variable with respect to inhibition or behavior control of the performed tasks.
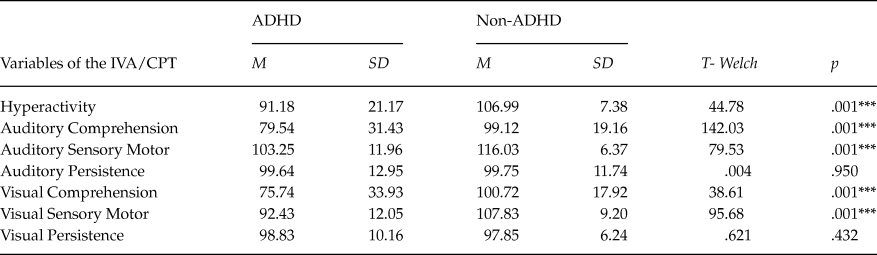
Moreover, the performance of children in both groups in specific variables related to attention, Hyperactivity, Attribute scales and Symptomatic scales were analyzed (Table 6). In the Hyperactivity scale, descriptive analyzes showed that the ADHD group obtained a lower average score than the non-ADHD group. These differences were statistically significant (Table 6).
Analysis of differences between groups, ADHD and non-ADHD

Note: ***p <.001.
Regarding the Attributes scales, specifically Balance, related to mental processing of stimuli (visual and auditory), the ADHD group obtained a higher mean (M = 113.71; SD = 14.53) than the non-ADHD group (M = 110.68; SD = 14.53), however, these differences were not statistically significant, F(1, 170) = 1.667, p = .198. In Readiness, regarding reaction times in situations of high and low response demand respectively, ANOVA analysis showed significant differences F(1, 184) = 8.673; p = .004, p < .05 between the two groups when auditory stimuli are presented (ADHD: M = 92.76, SD = 14.31 and non-ADHD: M = 99.34, SD = 15.92). However, no significant differences F(1, 171) = .041, p = .839 were obtained between the studied groups, for this variable when using visual stimuli (ADHD: M = 99.57, SD = 13.38 and non-ADHD: M = 99.14; SD = 13.80).
Results obtained regarding the symptomatic scales of the IVA/CPT showed lower mean scores of the ADHD group for the following variables: Visual Comprehension, Auditory Comprehension and Sensory-motor. These differences were statistically significant (Table 6). However, the ADHD group yielded higher scores for Visual Persistence and the same scores as the non-ADHD group for Auditory Persistence, although for both variables the differences were not significant (Table 6).
Discussion
Given the uneven influence of the hyperactive disorder according to variables such as sex and age, data from this study are consistent with previous research regarding distribution of children with ADHD, considering these variables. As evidenced by different studies, a higher incidence of hyperactive-attentional symptoms in men is found (Barkley, Reference Barkley1998; Graetz, Sawyer, & Baghurst, Reference Graetz, Sawyer and Baghurst2005). In this case, the proportion of boys and girls in the ADHD group (approximately 8:2) is consistent with the data provided by the literature on the boy-girl ratio in ADHD among children referred for clinical evaluation (Navarro-Pardo, Meléndez, Sales, & Sancerni, Reference Navarro-Pardo, Meléndez, Sales and Sancerni2012; Skounti, Philalithis, & Galanakis, Reference Skounti, Philalithis and Galanakis2007). In the group that does not have symptoms of this disorder, the 1:1 ratio between sexes is similar to that found in the population between 7 and 13 years in our country (Roldán, Reference Roldán2013).
Regarding the age variable, the average for children with ADHD is comparatively lower, fact that coincides with the evidence indicated by Navarro-Pardo et al., (Reference Navarro-Pardo, Meléndez, Sales and Sancerni2012), among others. According to these authors, in the period between 6 and 11 years of age, a greater amount of referrals to specialized Childhood and Adolescence mental health care units from pediatric services in primary caretaker place. In this regard, this confirms that the early years is a sensitive stage in the detection of significant number of cases with ADHD symptoms, especially in males.
When analyzing the performance of the studied children, depending on whether they exhibit ADHD symptoms or not, it is observed that there are deficits in the ADHD group for some of the studied variables, in comparison with the performance of children of the same sex and age of the sample used in the standardization of the instrument (Tinius, Reference Tinius2003). These deficits are especially focused on the attention to auditory stimuli and regarding the ability to sustain and direct attention to, classify and respond to auditory stimuli. However, the attentional performance of children with ADHD in other variables related to attention is within the normal range, as happens with all ratios and scales assessing attention in the group without ADHD.
It is important to stress that all measures of the ADHD group, with the exception of mental processing speed of auditory stimuli, are below the population reference mean (Sandford & Turner, Reference Sandford and Turner2000), with the group without ADHD obtaining in the Auditory Speed scale the highest scores among all attentional variables. Moreover, this group without ADHD symptoms obtained higher values than the ADHD group for all variables related to attention. With regard to behavioral control, the ADHD group obtained scores within normal range for all analyzed ratios and scales. Consequently, taking into account these children’s performance, regarding the normative population, no deficits were noted in this area. Similar results were exhibited by the group without ADHD symptoms, obtaining values within the normal range for all measures studied (Sandford & Turner, Reference Sandford and Turner2000).
Furthermore, when comparing the studied groups, it is observed that the results obtained regarding behavioral control are consistent with the findings relating to attention. When analyzing the performance of both groups, it is noted that, with the exception of the performance of consistent responses throughout the task, the ADHD group yielded lower values than the group without ADHD symptoms.
On the other hand, it is observed that children with ADHD exhibit deficits in attentional processes, studied through the analyses of their performance to visual and auditory stimulation. This group has obtained values below the scores of the group without ADHD symptoms.
If the primary scales are considered with the purpose of specifically knowing which attentional areas are deficient, it is observed that the comparison group without ADHD symptoms performed better in all variables, except for those related to sustained attention when stimulation was auditory. In this case, this group obtained scores similar to those of the ADHD group, making this the only variable in which no significant differences between groups were observed. These results are in agreement with those of previous studies that have also used the IVA/CPT to assess attention in children (Corbett & Constantine, Reference Corbett and Constantine2006; Corbett et al., Reference Corbett, Constantine, Hendren, Rocke and Ozonoff2009) and in adults (Quinn, Reference Quinn2003; Tinius, Reference Tinius2003) with and without ADHD diagnosis. In these studies, significant differences between groups were also observed for visual and auditory attention, disagreeing with this present study in the range of scores, which were lower for both groups when dealing with children. However, when adults were studied, no significant differences between the comparison groups were observed. Other studies provide conflicting data regarding this investigation. White, Hutchens, and Lubar (Reference White, Hutchens and Lubar2005) found no significant differences between groups in visual and auditory attention. Possibly, such results are related to the small size (N = 10) of the studied sample in that case.
Furthermore, the data reveal that the ADHD group presented deficits in the ability to maintain and direct attention to visual and auditory stimuli, as well as in the assessment and classification of such stimuli as target or non-target.
Judging by the results obtained regarding behavioral control, both groups’ (children with ADHD and children without ADHD symptoms) performance is similar in statistical terms, with mean values that are within normal limits. Both groups have similar abilities to inhibit their response to certain stimuli, to avoid errors of commission, to show a pattern of coherent responses and to maintain mental processing speed during the performance of the test. The results of Corbett and Constantine (Reference Corbett and Constantine2006) and Corbett et al. (Reference Corbett, Constantine, Hendren, Rocke and Ozonoff2009) agree with the findings of this present study. To date, these are the only studies that have evaluated a child population of similar characteristics using IVA/CPT, even though Corbett et al. (Reference Corbett, Constantine, Hendren, Rocke and Ozonoff2009) also included as a comparison group children with Autism Spectrum Disorder (ASD).
However, data from our study coincide with other studies that have evaluated adults with ADHD also using the IVA/CPT. No significant differences from normal population were observed in the control variables that measure global response to visual and auditory stimuli (Quinn, Reference Quinn2003; White, Hutchens, & Lubar, Reference White, Hutchens and Lubar2005). However, such findings may be related to the changes that are observed in adulthood in this disorder’s symptomatology. In this vital stage, attentional problems persist, while hyperactive-impulsive symptoms decrease. In any case, the results provided by Tinius (Reference Tinius2003) diverge from previous research. This author did find deficits in response control when comparing adults with and without ADHD, analyzing variables at a visual and auditory level.
In addition to the attention and response control registered with visual and / or auditory stimulation, the hyperactive behaviors that are explored in IVA/CPT through the Hyperactivity scale are of interest. According to the results found in the present study, the ADHD group showed fine motor problems, showing more behaviors unrelated to the proposed task and exhibiting a more hectic, chaotic and messy behavior. However, children without ADHD symptoms showed self-control and inhibition behaviors while performing the task. There are no available data reported by other studies regarding the Hyperactivity scale in a child population to verify whether the findings of this study are consistent with previous research. Tinius (Reference Tinius2003) is the only one to report on this measure, indicating statistically significant differences when comparing adults with and without ADHD, with values very similar to those found in this research.
The ability to mentally process visual and auditory stimuli, related to the learning style of the participants was also explored. The results showed better performance in both groups when auditory stimuli were presented. These results are in agreement with those provided by Tinius (Reference Tinius2003). The relevance of this finding stems from the following issues: a) Most of the continuous performance tests only have visual stimuli (Sandford & Turner, Reference Sandford and Turner2000). The IVA/CPT is a relevant instrument in this area as it evaluates key aspects of ADHD using stimulation other than visual. Thus, allowing for a greater understanding of the problems presented by children with this disorder when they must respond to auditory stimuli. Therefore, the presentation of stimuli of different nature to which the child has to respond, provides more information of cognitive functioning of children with ADHD, b) Secondly, these results provide important information for the design of intervention programs and educational strategies for this population, with special relevance for children with ADHD. According to these findings, efforts to improve the symptoms of the disorder and reduce attention deficits will improve their effectiveness when the presented stimuli are auditory in nature, and c) acknowledging that children who do not have inattention problems or hyperactivity-impulsivity problems accuse better mental processing when working with auditory stimuli can be decisive for programming educational contents.
On the other hand, judging by the results obtained by the ADHD group in the variables related to visual and auditory comprehension, these children exhibit moderate deficits compared to their peers without symptoms of the disorder and that do not accuse such deficits. Consideration of this variable is especially relevant, as it is one of the measures that best discriminates children with and without ADHD (Sandford & Turner, Reference Sandford and Turner2000). Quinn (Reference Quinn2003) reported severe deficits at a visual level and moderate deficits at an auditory level in a group of adults with ADHD, compared to the group without ADHD. These results are in agreement with those provided by Tinius (Reference Tinius2003), who observed significant differences in both scales among adults with and without ADHD.
Regarding the operation of the sensory-motor system, the findings show that the ADHD group exhibits deficits at a visual level. When the variable associated with participant’s motivation and possible mental processing problems during the execution of the test was analyzed, it was observed that there were no significant differences in fatigue resistance regardless of the visual or auditory nature of stimuli presented. Both groups exhibited continuous effort during testing.
However, this study has some limitations that refer to the following questions. It must be taken into consideration that the IVA/CPT is an instrument validated on a U.S. population, there are no validations for Spanish populations. This circumstance could skew the values obtained by decreasing or increasing the differences between groups. Moreover, in relation to the comparison groups, this study has analyzed a sample from the pediatric services in primary care, the group without ADHD was assessed the same day they attended the clinic for various different pediatric demands. Such circumstances could perhaps have influenced the assessment of aspects such as attention, behavioral control and mental processing. For these reasons, it would be advisable to conduct further studies to enable the validation of the instrument on the Spanish population and extend its application to other groups of children with different pathologies. Although the unequal distribution of groups based on gender was previously justified, this issue could be considered a limitation of the study, due to its comparative nature. However, this circumstance is caused by the differential distribution of ADHD disorder by gender, as previously explained, more prevalent in men.
Even considering these limitations, this study provides information on specific scales for which, to date, there are no studies with children and no prior Spanish research samples. It is framed within current research on this instrument, one of the most researched nowadays in the field of attentional assessment and therapeutic effectiveness, especially related to Neurofeedback and Pharmacological Treatment administered to individuals with ADHD. Furthermore, this work responds to the interest in analyzing and comparing the performance and behavior of children with ADHD, relative to their peers, in this case, normally developing children.
The implications derived from the extracted results extend to the educational and therapeutic environment. The results suggest programming of learning strategies consistent with the attentional impairments of ADHD, more sensitive to visual stimulation, without distinguishing different educational measures to promote behavioral inhibition specifically in these cases. At a therapeutic level, the findings reveal the suitability of implementing interventions essentially aimed at reducing attentional deficits experienced by children with ADHD, incorporating measures of behavioral inhibition in specific cases with associated behavior alterations.
In conclusion, based on the assessment using the continuous performance test IVA/CPT, is possible to say that the ADHD group has, in comparison to children without ADHD symptoms, attentional deficits related to visual and auditory stimulation, essentially problems of inattention, mental processing speed and distraction from visual stimuli. It is not possible to conclude that there are deficits in the control of visual or auditory behavior. With regard to learning style, a greater ability to pay attention to auditory stimuli has been observed in participants.
This research study has been funded by Plan Nacional I+D+i [National Research, Development and Innovation Program] (PSI2008–06008-C02–01).