Quantitative studies of the structure of personality consistently report that positive emotionality (PE) and negative emotionality (NE) are two “superfactors” that account for the largest amount of variance in personality (Clark, Watson, & Mineka, Reference Clark, Watson and Mineka1994; Costa & McCrae, Reference Costa and McCrae1980; Watson & Tellegen, Reference Watson and Tellegen1985). PE encompasses a tendency to experience affects such as joy, interest, and excitement. NE is characterized by a tendency to experience negative emotions such as sadness, anxiety, fear, and anger. PE and NE are hypothesized to be orthogonal dimensions (Clark & Watson, Reference Clark, Watson, Pervin and John1999; Watson & Tellegen, Reference Watson and Tellegen1985); therefore, an individual can be high or low on one, the other, or both.
Both PE and NE have been hypothesized to play a role in the development of major depressive disorder (MDD; Clark & Watson, Reference Clark and Watson1991; Shankman & Klein, Reference Shankman and Klein2003). Specifically, individuals who are high on NE and/or low on PE have been posited to be at increased risk for MDD. Consistent with this hypothesis, these two traits have been shown to predict onset of MDD (although the findings for NE are generally stronger) and NE has been shown to have a shared genetic liability with depression (Kendler et al., Reference Kendler, Neale, Kessler, Heath and Eaves1993; Kendler, Gatz, Gardner, & Pederson, Reference Kendler, Gatz, Gardner and Pedersen2006a, Reference Kendler, Gatz, Gardner and Pedersen2006b; Middeldorp, Cath, Van Dyck, & Boomsma, Reference Middeldorp, Cath, Van Dyck and Boomsma2005; Ormel, Oldehinkel, & Vollebergh, Reference Ormel, Oldehinkel and Vollebergh2004).
Although most investigations of personality and depression have focused on adults, a growing literature has examined the personality–depression association in preschool age children. Caspi, Moffitt, Newman and Silva (Reference Caspi, Moffitt, Newman and Silva1996) reported that children rated as inhibited, socially reticent, and having difficulty concentrating at age 3 were more likely to develop mood disorders by age 21. Although Caspi et al. found that the inhibition–psychopathology link was specific to depression, others have reported that behavioral inhibition also predicts later anxiety disorders, particularly social phobia (Chronis-Tuscano et al., Reference Chronis-Tuscano, Degnan, Pine, Perez-Edgar, Henderson and Diaz2009; Fox, Henderson, Marshall, Nichols, & Ghera, Reference Fox, Henderson, Marshall, Nichols and Ghera2005; Hirshfeld-Becker et al., Reference Hirschfeld-Becker, Micco, Henin, Bloomfield, Biederman and Rosenbaum2008; Kagan & Snidman, Reference Kagan and Snidman1999). Several studies from our lab have shown that low PE in preschool-aged children is associated with higher rates of maternal depression (Durbin, Klein, Hayden, Buckley, & Moerk, Reference Durbin, Klein, Hayden, Buckley and Moerk2005) and predicted higher levels of depressotypic cognitive styles at age 7 and depressive symptoms at age 10 (Dougherty, Klein, Durbin, Hayden, & Olino, Reference Dougherty, Klein, Durbin, Hayden and Olino2010; Hayden, Klein, Durbin, & Olino, Reference Hayden, Klein, Durbin and Olino2006). Although there are important methodological and conceptual complexities in these and similar studies (e.g., equating temperament with adult personality, distinguishing temperament and psychopathology; Tackett, Reference Tackett2006), taken together, these lines of research suggest that low PE and high NE may represent temperamental precursors/risk factors for depression in preschool-age children.
Another approach to exploring the role of temperamental risk factors in depression is to examine whether NE and PE are associated with biological correlates of the condition. For example, we recently reported an association between low PE in preschool-aged children and elevated morning cortisol levels (Dougherty, Klein, Olino, Dyson, & Rose, Reference Dougherty, Klein, Olino, Dyson and Rose2009). Another biomarker for depression that has received a great deal of interest is an asymmetry of EEG recorded while at rest. Several studies have reported abnormal EEG asymmetries in adults with depression (Bruder et al., Reference Bruder, Fong, Tenke, Leite, Towey and Stewart1997; Henriques & Davidson, Reference Henriques and Davidson1991; Shankman, Klein, Tenke, & Bruder, Reference Shankman, Klein, Tenke and Bruder2007), those who have recovered from depression (Gotlib, Ranganath, & Rosenfeld, Reference Gotlib, Ranganath and Rosenfeld1998; Henriques & Davidson, Reference Henriques and Davidson1990), and children with a family history of depression (Bruder et al., Reference Bruder, Tenke, Warner, Nomura, Grillon and Hille2005; Bruder, Tenke, Warner, & Weissman, Reference Bruder, Tenke, Warner and Weissman2007; Dawson, Frey, Panagiotides, Osterling, & Hessl, Reference Dawson, Panagiotides, Klinger and Spieker1997; Jones, Field, Fox, Lundy, & Davalos, Reference Jones, Field, Fox, Lundy and Davalos1997; Tomarken, Dichter, Garber, & Simien, Reference Tomarken, Dichter, Garber and Simien2004). However, there have also been several inconsistencies in the literature. For example, Reid, Duke, and Allen (Reference Reid, Duke and Allen1998) failed to find an association between depression and resting frontal EEG asymmetry, a finding possibly due to the heterogeneity of depression (Bruder et al., Reference Bruder, Fong, Tenke, Leite, Towey and Stewart1997; Pizzagalli et al., Reference Pizzagalli, Nitschke, Oakes, Hendrick, Horras and Larson2002).
EEG asymmetries have been shown to have moderate stability in adults with depression (over 8 weeks, intraclass correlations [ICCs] = 0.41–9.77; over 16 weeks, ICCs = 0.33–0.85; Allen, Urry, Hitt, & Coan, Reference Allen, Urry, Hitt and Coan2004) and low to moderate stability in preschool-aged children (for frontal regions, ICCs = 0.21–9.48; for parietal regions, ICCs = 0.21–0.27; Jones, Field, Davalos, & Pickens, Reference Jones, Field, Davalos and Pickens1997; Vuga, Fox, Cohn, Kovacs, & George, Reference Vuga, Fox, Cohn, Kovacs and George2008). Several studies have also reported that EEG asymmetries have a significant genetic component (Anokhin, Heath, & Myers, Reference Anokhin, Heath and Myers2006; Smit, Posthuma, Boomsma, & DeGeus, Reference Smit, Posthuma, Boomsma and De Geus2007), although this has never been examined in young children. In addition, Pössel, Lo, Fritz, and Seemann (Reference Pössel, Lo, Fritz and Seemann2008) reported that EEG asymmetries in adolescents (13–15 years old) predicted self-reported depression 12 months later. Taken together, these findings present suggestive evidence that EEG asymmetries may be a potential endophenotype for depression (Allen, Reference Allen2009).
The EEG asymmetry–depression relationship is not uniform across all cortical areas and has been shown to differ at frontal versus posterior regions. Frontal EEG asymmetry has often been explained using the approach–withdrawal model (Davidson, Reference Davidson1994; Davidson et al., Reference Davidson, Lewis, Alloy, Amaral, Bush and Cohen2002), which posits that individuals predisposed to depression exhibit a dispositional tendency to be less likely to seek reward. Accordingly, this “low approach affective style” is associated with a frontal brain asymmetry due to decreased activity in the left frontal region.
Posterior EEG asymmetries have received less attention than anterior asymmetries in the depression literature. The posterior asymmetry in depression is posited to be the result of decreased activity in the right posterior region, which has been associated with decreased emotional arousal (Heller, Nitschke, & Miller, Reference Heller, Nitschke and Miller1998) and general processing of emotional information (Bruder, Reference Bruder, Hugdahl and Davidson2003; Heller, Reference Heller, Stein, Leventhal and Trabasso1990). Many studies have reported posterior EEG asymmetries in individuals with depression (Bruder et al., Reference Bruder, Fong, Tenke, Leite, Towey and Stewart1997; Kentgen et al., Reference Kentgen, Tenke, Pine, Fong, Klein and Bruder2000; Reid et al., Reference Reid, Duke and Allen1998), those who have recovered from depression (Henriques & Davidson, Reference Henriques and Davidson1990), and college students with elevated depressive symptoms (Blackhart, Minnix, & Kline, Reference Blackhart, Minnix and Kline2006). However, several studies have produced contradictory findings. For example, Mathersul, Williams, Hopkinson, and Kemp (Reference Mathersul, Williams, Hopkinson and Kemp2008) found that, compared to controls, individuals with depression had relative increased right posterior activation. In addition, Pössel et al. (Reference Pössel, Lo, Fritz and Seemann2008) found that relative increased right posterior activation predicted depression at a 12-month follow-up, even adjusting for baseline depressive and anxiety symptoms. Last, Metzger et al. (Reference Metzger, Paige, Carson, Lasko, Paulus and Pitman2004) found that although depressive symptoms were not associated with a posterior EEG asymmetry, they moderated the association between arousal and posterior asymmetry in that arousal had a stronger association with a relative right posterior asymmetry when depression was high.
Given that both temperamental emotionality traits and EEG asymmetries may tap somewhat stable predispositions for mood disorders with a genetic basis, it stands to reason that these two domains of risk may be related to one another. Several studies have found associations between these or related traits and EEG asymmetries in adults (Jacobs & Synder, 1996; Schmidtke & Heller, Reference Schmidtke and Heller2004; Tomarken, Davidson, Wheeler, & Doss, Reference Tomarken, Davidson, Wheeler and Doss1992) and young children (Calkins, Fox, & Marshall, Reference Calkins, Fox and Marshall1996; Fox, Henderson, Rubin, Culkins, & Schmidt, Reference Fox, Henderson, Rubin, Calkins and Schmidt2001) for frontal and/or posterior regions. In a previous report, we also found an association between childhood PE and posterior asymmetry, but not frontal asymmetry (Shankman et al., Reference Shankman, Tenke, Bruder, Durbin, Hayden and Klein2005). Specifically, children classified using a standardized behavioral observation procedure (Goldsmith, Reilly, Lemery, Longley, & Prescott, Reference Goldsmith, Reilly, Lemery, Longley and Prescott1995) as having low PE at age 3 exhibited a posterior EEG asymmetry of less relative right posterior activity at age 5–6.
Several methodological aspects of previous studies limit them as thorough tests of the relation between childhood temperamental/personality risk factors and EEG asymmetry. First, the sample sizes of previous reports are relatively small. Second, several reports are based on selecting groups that are high or low in dimensions of temperament (e.g., Shankman et al., Reference Shankman, Tenke, Bruder, Durbin, Hayden and Klein2005), and this limits the conclusions one can make about the full range of temperament traits. Third, several studies did not measure temperament and EEG at the same age (McManis, Kagan, Snidman, & Woodword, Reference McManis, Kagan, Snidman and Woodward2002; Shankman et al., Reference Shankman, Tenke, Bruder, Durbin, Hayden and Klein2005). Fourth, although this may not be a limitation, but instead may be a different approach to assessing temperament, some studies relied on self-report or parental report of personality rather than observational measures of personality/temperament (Tomarken, Davidson, Wheeler, & Kinney, Reference Tomarken, Davidson, Wheeler and Kinney1992). Therefore, the present study will address these limitations by examining the association of EEG asymmetries and observationally based measures of PE and NE in over 300 preschool-aged children.
Given that both PE and NE are proposed to play a role in the development of depression, it is also important to examine whether the two dimensions have additive or interactive effects on risk instead of just exploring the separate effects of the two dimensions. This interaction could assume several possible forms (Gerhsuny & Sher, 1998). PE and NE may interact in that experiencing positive emotions may moderate (or buffer) the effects of stress reactivity and negative emotions on EEG asymmetry (Tugade & Fredrickson, Reference Tugade and Fredrickson2004; Wichers et al., Reference Wichers, Myin-Germeys, Jacobs, Peeters, Kenis and Derom2007). Alternatively, either low PE or high NE may be associated with greater risk than having both high PE and low NE (i.e., low risk on both dimensions), but the combination of low PE and high NE (i.e., high risk on both dimensions) may not confer greater risk than either trait alone. This would be consistent with the hypothesis that both low PE and high NE are sufficient to confer risk, although neither trait is necessary (Gershuny & Sher, Reference Gershuny and Sher1998; Shankman & Klein, Reference Shankman and Klein2003). Another aim of the present study is to therefore determine whether and how the interaction of PE and NE is associated with EEG asymmetries.
Last, EEG asymmetry has also been shown to differ between men and women. Most investigations examining EEG asymmetry and depression have been comprised of female participants (Thibodeau, Jorgensen, & Kim, Reference Thibodeau, Jorgensen and Kim2006). Of interest, in the few studies that have included at least a moderate number of men, depressed males' EEG asymmetries differed from those of females (Jacobs & Snyder, Reference Jacobs and Snyder1996; Miller et al., Reference Miller, Fox, Cohn, Forbes, Sherrill and Kovacs2002). Therefore, a final aim of this investigation is to examine whether preschool-aged boys and girls exhibit different patterns of association between temperament and EEG asymmetry.
Method
Participants
The sample consisted of 559 3-year-olds from a suburban community who participated in a larger study of child temperament and risk for psychopathology. Potential participants were identified using commercial mailing lists and screened by telephone. Children were included if they lived with at least one English-speaking biological parent and did not have any significant medical conditions or developmental disabilities.
All 559 children were invited to participate in the EEG portion of the study but 104 children refused, 9 parents refused, and 41 children failed to complete the EEG assessment. An additional 22 and 52 children were excluded, respectively, because they had too much artifact in their EEG data (see Data Analysis Section) or because they were sinistral (as indicated by performing at least three of six tasks [throwing a ball, drawing, pretending to cut with scissors, open a jar, kick a ball, look through a toy telescope] with their left hand/eye/foot). Finally, two more children were excluded who met DSM-IV criteria for a specific mood disorder, based on parent report from the Preschool Age Psychiatric Assessment (Egger, Ascher, & Angold, Reference Egger, Ascher and Angold1999). This yielded a final total of 329 children. Those who were in the final EEG analysis did not differ from those who were not on race; social status (Hollingshead, Reference Hollingshead1975); whether the child lived with both biological parents; whether the mother worked outside the home; Peabody Picture Vocabulary Test (PPVT; Dunn & Dunn, Reference Dunn and Dunn1997) score; and child PE, NE, and anger. However, children in the final analysis did have higher fear and sadness ratings, were slightly older and were more likely to be female (p < .05).
The mean age of the final sample was 42.5 months (SD = 3.15), and 153 (46.5%) were male. The sample was predominantly (85.7%) Caucasian and middle class. On the Hollingshead (Reference Hollingshead1975) Four Factor Index of Social Status, which is arguably the most widely used index of socioeconomic status (SES; Cirino et al., Reference Cirino, Chin, Sevcik, Wolf, Lovett and Morris2002), the sample's mean score was 2.2 (SD = 0.90).Footnote 1 The Hollingshead is a weighted average of the occupational prestige and educational level of both parents. The continuous score is often broken down into five categories, ranging from high (Class I) to low (Class V). In our sample, the proportions of the families in social Classes I–V were 21.0%, 45.3%, 25.2%, 7.6%, and 0.9%, respectively. Forty-six percent of fathers and 56.8% of mothers had at least a bachelor's degree. The demographic characteristics of the sample were consistent with the larger county from which it was drawn. Most children (95.1%) lived with both biological parents, and 46.5% of the mothers worked outside the home part- or full-time. Children were of average cognitive ability as indexed by the PPVT (M = 102.64, SD = 13.33).
Child temperament
Each child and a parent (95.1% mothers) visited the laboratory for a 2-hr observational assessment of temperament that included a standardized set of 12 episodes selected to elicit a range of temperament-relevant behaviors. Eleven episodes were from the Laboratory Temperament Assessment Battery (LAB-TAB; Goldsmith et al., Reference Goldsmith, Reilly, Lemery, Longley and Prescott1995) and one was adapted from a LAB-TAB episode. The LAB-TAB is a standardized temperament assessment battery that has been used in numerous studies with preschoolers over the last 25 years (see http://psych.wisc.edu/goldsmith/researchers/GEO/lab_tab.htm). Using an independent sample, we previously reported moderate associations between LAB-TAB ratings and home observations, and moderate stability of laboratory ratings of temperament over four years (Durbin, Hayden, Kelin, & Olino, 2007). Each task was videotaped through a one-way mirror and later coded. Episodes were ordered so as to prevent carryover effects in that no episodes presumed to evoke similar affective responses occurred consecutively, and each was followed by a brief play break to allow the child to return to a baseline emotional state. The parent remained in the room with the child for all episodes except Stranger Approach and Box Empty (see below). The parent was instructed not to interact with the child (except in Pop-Up Snakes) and was seated facing at a right angle from the experimenter and child and given questionnaires to complete.
The episodes in order of presentation were (a) Risk Room: the child explored a set of novel and ambiguous stimuli, including a Halloween mask, balance beam, and black box; (b) Tower of Patience: the child and the experimenter alternated turns in building a tower, and the experimenter took increasing amounts of time before placing her block on the tower during each turn; (c) Arc of Toys: the child played independently with toys for 5 min before the experimenter asked the child to clean up the toys; (d) Stranger Approach: the child was left alone briefly in the room before a male accomplice entered, speaking to the child while slowly walking closer; (e) Make that Car Go: the child and the experimenter raced remote-controlled cars; (f) Transparent Box: the experimenter locked an attractive toy in a transparent box, leaving the child alone with a set of nonworking keys. After a few minutes, the experimenter returned and told the child that she had left the wrong set of keys. The child used the new keys to open the box and play with the toy. (g) Exploring New Objects: the child was given the opportunity to explore a set of novel and ambiguous stimuli, including a mechanical spider, a mechanical bird, and sticky water-filled soft gel balls; (h) Pop-up Snakes: the child and experimenter surprised the parent with a can of potato chips that actually contained coiled snakes; (i) Impossibly Perfect Green Circles: the experimenter repeatedly asked the child to draw a circle on a large piece of paper, mildly criticizing each attempt; (j) Popping Bubbles: the child and experimenter played with a bubble-shooting toy; (k) Snack Delay: the child was instructed to wait for the experimenter to ring a bell before eating a snack. The experimenter systematically increased the delay before ringing the bell; and (l) Box Empty: the child was given an elaborately wrapped box to open under the impression that a toy was inside. After the child discovered the box was empty, the experimenter returned with several toys for the child to keep.
Coding procedures
PE and NE were coded using an extensive manual developed for previous studies by Durbin et al. (Reference Durbin, Klein, Hayden, Buckley and Moerk2005, Reference Durbin, Hayden, Klein and Olino2007). Discrete emotions (positive affect/exuberance, anger, sadness, and fear) were assessed by separately coding each display of facial, vocal, and bodily indicators of the emotion in each episode on a 3-point scale (ambiguous/low intensity, definite/moderate intensity, definite/high intensity). Coding of facial expressions and their intensity used the AFFEX system (Izard, Dougherty, & Hembree, Reference Izard, Dougherty and Hembree1989). For example, to assess positive affect, the intensity of each instance of smiling, positive verbalizations (e.g., a squeal of joy, or “that was fun!” stated in an enthusiastic tone), and bodily movements suggesting positive affect (e.g., jumping for joy; vigorous approach-oriented movements) were coded. Ratings were summed separately within each channel (facial, bodily, vocal) across the 12 episodes, standardized (z scored), and summed across the three channels to derive total scores for positive affect, fear, sadness, and anger. Thus, the affect codes reflect both the frequency and the intensity of the emotion. Following Durbin et al. (Reference Durbin, Klein, Hayden, Buckley and Moerk2005, Reference Durbin, Hayden, Klein and Olino2007), interest was rated on a single global 4-point scale (none, low, moderate, and high) for each episode, based on the child's comments about the activity and how engaged the child was in play. Interest ratings were then summed across the 12 episodes. PE consisted of the sum of the standardized total positive affect and interest variables (mean Z = 0.08, SD = 0.52). NE was the sum of the standardized total sadness, fear, and anger variables (mean Z = −0.03, SD = 0.51).
PE and NE had adequate internal consistency (α = 0.82 and 0.74, respectively; ICC = 0.89 and 0.82, respectively; N = 35). For the three facets of NE, the internal consistencies and interrater reliabilities (N = 35) were the following: anger, α = 0.68, ICC = 0.79; sadness, α = 0.81, ICC = 0.73; and fear, α = 0.63, ICC = 0.64. NE and its facets were positively skewed, so we natural log transformed these variables. Similar to our previous study on EEG and temperament (Shankman et al., Reference Shankman, Tenke, Bruder, Durbin, Hayden and Klein2005), PE and NE were relatively orthogonal (r = −.07, ns), and PE was also not correlated with any of the facets of NE (ps > .16). The two facets of PE (interest and positive affect) were highly correlated with each other (r = .65). In contrast, the three facets of NE had relatively low intercorrelations (rs = .08–.33); hence, we also analyzed the NE facets separately (sadness, anger, fear). Demographic variables were largely unrelated with PE, NE, and the three facets of NE, with the small exceptions of SES and paternal education being negatively correlated with anger (r = −.14, p < .01; r = −.12, p < .05, respectively) and girls displaying higher fear t (327) = 2.46, p < .05.
Procedures
EEG assessment
The child was shown the recording chamber, which was decorated to look like a space shuttle (adapted from Fox et al., Reference Fox, Rubin, Calkins, Marshall, Coplan and Porges1995). The walls and ceiling of the room were lined with black fabric and covered with stickers of stars and planets and the recording chair was decorated to look like an astronaut command chair. The child was told that he/she would be pretending to be an astronaut and going on missions with an experimenter in the room.
Data were acquired using the Active Two system (Biosemi, Amsterdam, The Netherlands). A stretch Lycra cap was placed on the child's head and 32 silver/silver chloride tipped electrodes arranged according to the international 10/20 labeling system (American Electroencephalographic Society, 1994). In addition, data were recorded from VEOG and HEOG (bipolar leads) to monitor vertical and horizontal eye movements, respectively. The offsets of all electrodes were between ±20 µV and both the EEG and EOG were sampled at a rate of 512 Hz, with high- and low-pass filters set at 0.16 and 40 Hz, respectively. All data was referenced offline to a nose reference. Because different reference montages can yield different results (see Hagemann, Reference Hagemann2004; Tenke & Kayser, Reference Tenke and Kayser2005), the EEG and EOG (epoched data) were also rereferenced offline to the average signal and reference was included as a repeated-measures factor in our analyses (see below). Although many studies have examined hemispheric asymmetries using a Cz reference (e.g., Dawson, Panagiotides, Klinger, & Spieker, 1997; Jones et al., Reference Jones, Field, Davalos and Pickens1997), there is evidence that this reference is problematic and that results obtained with it differ from those obtained using other reference montages (Allen, Coan, & Nazarian, Reference Allen, Coan and Nazarian2004; Hagemann, 2004; Tenke & Kayser, Reference Tenke and Kayser2005).
Scalp EEG was recorded while participants sat quietly in the recording chamber with an experimenter and, when necessary, their mother, during six 1-min blocks, with the order of the eyes open or closed conditions counterbalanced across subjects. Subjects were instructed to sit as still as possible during the recording period and to either fixate on a simple schematic of a space shuttle or sit quietly with their eyes closed until the experimenter indicated the end of the block. They were told that if they sat very still, they would receive a prize following each block.
EEG analyses
EEG files were converted from Biosemi to Neuroscan 4.1 (Charlotte, NC) formats using the program PolyRex (Kayser, Reference Kayser2003). The data were baseline corrected and then segmented into consecutive 1.024-s epochs every 0.512 s (50% overlap). We excluded from the analyses epochs that were contaminated with eye or movement artifacts by direct visual inspection of the raw epoched data (e.g., blink artifacts in frontal electrodes, obvious movement related artifacts in all channels, etc.). Given how difficult it is for preschool-aged children to sit still, direct visual inspection and manual artifact rejection is likely to be superior to automatic rejection or correction procedures (Hagemann, Reference Hagemann2004; Somsen & van Beek, Reference Somsen and van Beek1998). Children had an average of 85.84 (SD = 35.1) and 73.57 (SD = 37.1) epochs during the eyes open and closed conditions, respectively. The EEG was tapered over the entire 1.024-s epoch by a Hanning window to suppress spectral side lobes. By overlapping the epochs by 50%, data that were attenuated at the beginning and end of an epoch were preserved in adjacent (overlapping) epochs.
Power spectra were computed offline from the EEG data using a fast Fourier transform. Analyses focused on the alpha band to be consistent with prior EEG studies (Bruder et al., Reference Bruder, Fong, Tenke, Leite, Towey and Stewart1997; Jones et al., Reference Jones, Field, Davalos and Pickens1997) and because this band has been shown to be inversely correlated with other measures of brain activity such as positron emission tomography (Oishi et al., Reference Oishi, Mima, Ishii, Bushara, Hiraoka and Uekl2007; although see Tenke & Kayser, Reference Tenke and Kayser2005). Moreover, it is unclear how to define the other frequency bands (delta, theta, beta) in children this age given the developmental changes in EEG frequency spectra (Fisch, Reference Fisch1999). For each electrode, alpha power was averaged for artifact-free epochs and then integrated over a 6- to 10-Hz band, the recommended frequency band to define alpha in children of this age (Marshall, Bar-Haim, & Fox, Reference Marshall, Bar-Haim and Fox2002). Visual inspection of a subset of data files revealed a discernable alpha peak in the middle of this range.
Statistical analyses
To normalize the data, each electrode was natural log transformed. We then created asymmetry scores (ln[left] – ln[right]) for homologous pairs in anterior (AF3/4, F3/4, F7/8) and posterior regions (PO3/4, P3/4, P7/8). Using the heuristic of alpha being inversely related to activity (Allen, Coan, et al., 2004), these asymmetry indices reflect the degree of relative right activity. EEG asymmetry studies typically focus on F3/4, F7/8, P3/4, and P7/8 (Allen, Coan, et al. 2004; Shankman et al., Reference Shankman, Tenke, Bruder, Durbin, Hayden and Klein2005); but we wanted to include these additional sites to examine the regional specificity of the findings. We also conducted hemisphere analyses to determine the contribution of each hemisphere to the asymmetry score.
To examine the relation between temperament and EEG asymmetry, we ran separate mixed linear models (SPSS 16.0; Coan, Allen, & McKnight, Reference Coan, Allen and McKnight2006; Stewart, Bismark, Towers, Coan, & Allen, Reference Stewart, Bismark, Towers, Coan and Allen2009). Individual asymmetry scores for eyes (open, closed), reference (nose, average), and region (three regions listed above) were “stacked” resulting in a maximum of 12 cases for each anterior and posterior model. This approach allows for modeling of multiple within-subjects factors, and it is more powerful than traditional generalized linear model as it allows for missing observations (J. Allen & J. Coan, personal communication, April 2009). It is important to note that, because some children yielded clean data with their eyes open but not closed (and vice versa), this approach allowed us to include children who only had clean data in one “eyes” condition.
As expected, there was a main effect for eyes (more alpha when eyes were closed), but this factor did not interact with any of the temperament variables (ps > .62) for any of the analyses, suggesting that the findings did not vary by whether the child had their eyes open or closed. Thus, it was not included as a fixed effect in subsequent models, although it still was a repeated variable in the data structure. There were significant or marginally significant interactions between the temperament variables and region, and thus results are reported separately for the three regions within anterior and posterior sites. Although some might argue that including “anterior/posterior” (i.e., AF3/4, F3/4, F7/8 vs. PO3/4, P3/4, P7/8) as an additional repeated-measures factor would test the specificity of the effect, we feel that this would be inappropriate given that anterior and posterior asymmetries are proposed to reflect distinct mechanisms.
All temperament variables were centered as per Aiken and West's (1991) guidelines on testing interactions. As outliers are particularly problematic for hypothesized interactions, we carefully screened our data and scatterplots for outliers. When outliers were removed, the below results were nearly identical.
In order to examine whether activity in right or left regions drove any asymmetry findings, we calculated alpha power scores for each of the hemispheres (e.g., P3 and P4). This was done by residualizing alpha power for each eyes condition and recording reference as a function of whole-head alpha power for that condition/reference, and then using these residualized scores as dependent variables. This approach removes overall differences in power due to anatomical factors such as scalp thickness while preserving topography (Allen, Coan, et al., 2004; Davidson, Jackson, & Larson, Reference Davidson, Jackson, Larson, Cacioppo, Tassinary and Berntson2000).
Results
Anterior sites
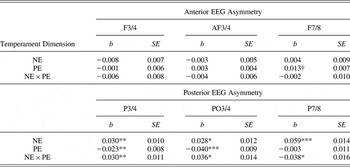
To examine the relationship between temperament and frontal asymmetry, PE, NE, and their interaction were entered as between-subjects variables in separate models with each of the three anterior asymmetries as the dependent variables. The results are presented at the top of Table 1.
Associations between temperament variables and anterior and posterior EEG asymmetries

Note: The b values are unstandardized estimates of the association of the temperament dimension and EEG asymmetry. EEG asymmetries are coded such that higher values indicate greater relative right activity (e.g., ln[P3 alpha] – ln[P4 alpha]). NE, negative emotionality; PE, positive emotionality.
†p < .10. *p < .05. **p < .01. ***p < .001.
PE and NE were not significantly related to anterior asymmetries for any of the regions, although there was a trend for PE to be associated with the F78 asymmetry, with relative greater right activity associated with more PE (b = 0.013, SE = 0.007, p < .10). The interaction of PE and NE also was not related to any anterior EEG asymmetries.Footnote 2
When reference (average reference vs. nose reference) was included as a repeated measure factor in the above models, the results remained the same, suggesting that the findings were not moderated by reference.
Posterior sites
We next repeated the above analyses but using the three posterior asymmetries as the dependent variables (see results on bottom of Table 1). These results indicate that both PE and NE were independently associated with posterior asymmetries in at least two of the three regions. Specifically, using the heuristic that alpha is inversely related to activity, NE was associated with P3/4, P7/8, and PO3/4 such that higher NE was related to greater relative right posterior activity. PE was associated with P3/4 and PO3/4 such that lower PE was related to greater relative right posterior activity.
The interaction of PE and NE was also related to P3/4, P7/8, and PO3/4, although the direction of the interaction term differed for P78 compared to the other two regions. However, the PE × NE interaction for P78 was moderated by reference at a trend level (PE × NE × reference: b = 0.057, SE = 0.032, p < .08), whereas the PE × NE interaction was not moderated by reference for the other two regions (both ps > .55). Follow-up analyses to this three-way interaction showed there was no PE × NE interaction in P7/8 for the nose reference (p > .56), but a PE × NE interaction for the average reference (p < .01). Given that data from lateral electrodes (such as P7/8) are affected by artifact more than medial electrodes, the pattern of results for main effects and interactions was different for P7/8 compared to the other two regions, and the asymmetry for P7/8 was only present in one reference, we have chosen to interpret the interactions for P3/4 and PO3/4, rather than P7/8.
To probe the P3/4 and PO3/4 interactions further, we employed the method proposed by Aiken and West (Reference Aiken and West1991; also see Holmbeck, Reference Holmbeck2002). First, we computed two conditional moderators, high PE and low PE, for 1 SD above or below the mean, respectively. Second, we examined the simple slope of each of these regression lines. This approach is superior to doing a median split on PE as it is more powerful and allows for clearer interpretation of intercepts and slopes.
When PE was low, NE was unrelated to posterior asymmetry (P3/4: b = 0.002, SE = 0.015, ns; PO3/4: b = −0.005, SE = 0.017, ns). However, when PE was high, NE was related to posterior asymmetry such that increasing NE was associated with greater relative right activity (P3/4: b = 0.058, SE = 0.015, p < .001; PO3/4: b = 0.061, SE = 0.018, p < .01). In other words, NE was only correlated with posterior asymmetry for children with high PE.
Gender
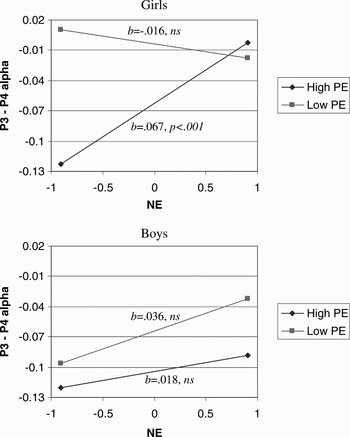
Given that previous studies have found that men and women at risk for depression exhibit different asymmetries (Jacobs & Snyder, Reference Jacobs and Snyder1996; Miller et al., Reference Miller, Fox, Cohn, Forbes, Sherrill and Kovacs2002), we ran models with NE, PE, gender, and their interactions for P3/4, PO3/4, and P7/8 asymmetries. The PE × NE × Gender interactions were significant for P3/4 (b = −0.050, SE = 0.024, p < .05) and PO3/4 models (b = −0.102, SE = 0.034, p < .001), although not for the P7/8 model (b = −0.019, SE = 0.035, ns).Footnote 3 For P3/4 and PO3/4, follow-up analyses demonstrated that the PE × NE interactions were not significant for boys (both ps > .17), but were significant for girls (both ps < .001). Figure 1 illustrates the PE × NE interaction for girls and boys separately for P3/4. These results suggest that the overall PE × NE interaction described above was driven by the effects in girls. For low PE girls, NE was unrelated to posterior asymmetry (b =− 0.016, SE = 0.016, ns), but for high PE girls, NE was related to posterior asymmetry (b = 0.067, SE = 0.016, p < .001). The regression lines for boys were statistically flat. A similar pattern was found for PO3/4.
The relation between negative emotionality (NE) and P3/4 asymmetry as moderated by positive emotionality (PE) for girls and boys presented separately. The dependent variable is coded such that higher values indicate greater relative right activity (e.g., ln[P3 alpha] – ln[P4 alpha]).

NE facets
We also explored which of the three facets of NE (sadness, fear, and anger) were driving the above PE × NE interactions for the P3/4 and PO3/4 asymmetries. For P3/4, there was a significant PE × Sadness interaction (b = 0.026, SE = 0.008, p < .01), a trend for PE × Fear (b = 0.017, SE = 0.009 p < .07), but no significant PE × Anger interaction (b = 0.005, SE = 0.008, ns). For PO3/4, there was a similar pattern of results, although slightly weaker. When reference was included in these models, the results were nearly identical and reference did not moderate the results. Also, similar to the above gender analyses for global NE, the results were driven by differences in females.
Hemisphere
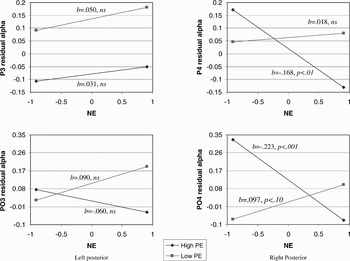
The previous results indicate that NE and PE interact to predict posterior asymmetries, but as the asymmetry is a difference score, these analyses cannot address whether the interaction is associated with activity in the right posterior, left posterior, or both hemispheres (Tomarken & Keener, Reference Tomarken and Keener1998). Following Allen, Coan, et al. (2004), we residualized alpha activity in the right (P4, PO4) and left (P3, PO3) posterior sites as a function of whole-head alpha power and used these residualized scores as dependent variables in our PE × NE models. The PE × NE interaction was significantly associated with alpha power in P4 (b = −0.102, SE = 0.041 p < .05) and PO4 (b = −0.177, SE = 0.045 p < .001), but not P3 (b = −0.011, SE = 0.041 ns) and at a trend for PO3 (b = −0.086, SE = 0.045 p < .10). Figure 2 illustrates these results for these sites using the Aiken and West (Reference Aiken and West1991) simple slope approach. For high PE children, as NE increased, right posterior activity increased (i.e., alpha decreased) in P4 (slope: b = −0.168, SE = 0.053 p < .01) and PO4 (slope: b = −0.223, SE = 0.058 p < .001). For low PE children, NE was not associated with activity in P4 (slope: b = 0.018, SE = 0.050, ns) and was related to a trend for decreased activity in PO4 (slope: b = 0.097, SE = 0.054 p < .10). For the left posterior sites (P3 and PO3), the slopes were all statistically flat. Similar to the asymmetry analyses for gender, the findings were driven by PE × NE interactions for females, not males.
Regression lines for relation between negative emotionality (NE) and left (P3 and PO3) and right (P4 and PO4) activity as moderated by positive emotionality (PE). The dependent variable is coded such that higher values indicate less activity (i.e., alpha is the inverse of activity).

Discussion
Researchers have long been interested in whether children with particular temperamental traits are at risk for depression. Using a large and well-characterized sample of preschoolers, this study examined whether individual differences on the temperamental dimensions of PE and NE predicted asymmetries in resting EEG activity in frontal and posterior regions, putative markers for risk for depression (Bruder et al., Reference Bruder, Fong, Tenke, Leite, Towey and Stewart1997; Davidson, Reference Davidson1998; Heller et al., Reference Heller, Nitschke and Miller1998). We found that low PE and high NE independently predicted greater relative right posterior activity. In addition, we found that PE and NE interacted to predict a posterior asymmetry.
The direction of the interaction is particularly interesting. For children with greater PE, increasing levels of NE were related to greater relative right posterior activity. For children with lower levels of PE, variation in NE was unrelated to posterior asymmetry. It has been well documented that high levels of NE and (to a lesser extent) low levels of PE predict depression (Clark et al., 1994; Kendler et al., Reference Kendler, Gatz, Gardner and Pedersen2006a, Reference Kendler, Gatz, Gardner and Pedersen2006b) but the literature is unclear as to how (or if) the two traits interact to predict risk (Shankman & Klein, Reference Shankman and Klein2003). One possible interpretation of the present finding is that both low PE and high NE are sufficient for conferring risk for depression, although neither trait is necessary to confer risk. In addition, these results may suggest that children with both low PE and high NE have similar risk for depression compared to children who have either trait alone (although this last point may have been due to a ceiling effect on EEG asymmetry). Of interest, these results are consistent with other findings from this sample that examined the interaction of PE and NE in predicting parental history of depression (Olino, Klein, Dyson, Rose, & Durbin, Reference Olino, Klein, Dyson, Rose and Durbin2010). That study found that compared to children with high PE and low NE, children with higher levels of NE, lower levels of PE, and the combination of high NE and low PE all had higher rates of parental depression, but these three latter subgroups did not differ from one another.
The interaction of PE and NE on posterior asymmetry appeared to be largely due to differences in right as opposed to left posterior regions. Neuropsychological and neurophysiological studies have often found that greater relative right posterior activity has been associated with increased emotional arousal and reduced processing of emotional stimuli (i.e., the “right hemisphere hypothesis;” Borod, Reference Borod1992; Heller et al., Reference Heller, Nitschke and Miller1998; Kayser, Bruder, Tenke, Stewart, & Quitkin, Reference Kayser, Bruder, Tenke, Stewart and Quitkin2000). For example, a functional magnetic resonance imaging study (Killgore & Yurgelun-Todd, Reference Killgore and Yurgelun-Todd2007) presented masked emotional faces to each hemisphere and concluded that right posterior regions may be involved in the processing of emotional stimuli regardless of valence even if the emotional stimuli are processed nonconsciously. Another study by McManis and colleagues (Reference McManis, Kagan, Snidman and Woodward2002) found that 4-month-olds characterized as highly emotionally “reactive” (i.e., greater motor activity and frequent fretting and crying) exhibited greater relative right parietal activity at age 10 compared to nonreactive infants. Taken together with our findings, it is possible that high NE and low PE temperaments may be associated with abnormalities in right posterior regions (and therefore risk for depression) because these children process affective stimuli abnormally and/or have difficulty regulating emotional arousal.
In contrast, the purported “right hemisphere hypothesis” has not always been supported and has often been criticized (Canli, Desmond, Zhao, Glover, & Gabrieli, 2001; Demaree, Everhart, Youngstrom, & Harrison, Reference Demaree, Everhart, Youngstrom and Harrison2005). In addition, whereas our main effect for NE is consistent with the hypothesis that right posterior regions are associated with increased arousal, our main effect for PE suggests that low PE is also associated with increased arousal. Although this may have been due to the difficulty in interpreting main effects in the presence of the PE × NE interaction, one possible explanation is that our “at-rest” condition might not have been a true rest condition. In adult resting EEG studies, participants are typically instructed to relax and sit still. In order to ensure that our children sat still and yielded relatively artifact free data, we told our children that if they sat still, they would receive prizes. This may have inadvertently increased social pressure (Scullin & Bonner, Reference Scullin and Bonner2006) and anxiety/negative affect in our low PE children and possibly increased their right posterior activity. A similar argument was made by Mathersul et al. (Reference Mathersul, Williams, Hopkinson and Kemp2008) in interpreting their finding that depressed mood was associated with abnormally high right posterior activity even compared to anxious mood. To fully test this hypothesis, future studies are needed in which EEG is recorded during different induced moods in order to elucidate the exact processes mediated by right posterior regions in low PE and high NE temperaments (Coan et al., Reference Coan, Allen and McKnight2006).
Our results also suggest that the PE × NE interaction was driven by the NE facet of sadness and (to a lesser extent) fear, not anger. The result for fear is consistent with findings that relative increased activity in right posterior regions is associated with anxiety disorders (Heller et al., Reference Heller, Nitschke and Miller1998; Metzger et al., Reference Metzger, Paige, Carson, Lasko, Paulus and Pitman2004; Nitschke, Heller, Palmeiri, & Miller, Reference Nitschke, Heller, Palmieri and Miller1999), and may suggest that the posterior asymmetry observed in our study reflects risk for comorbid depression and anxiety (Bruder et al., Reference Bruder, Fong, Tenke, Leite, Towey and Stewart1997; Heller & Nitschke, 1998; although for contrary evidence, see Kentgen et al., Reference Kentgen, Tenke, Pine, Fong, Klein and Bruder2000). This may also relate to the finding that childhood anxiety disorders have been shown to be precursors for particularly severe depression later in life (Reinherz, Paradis, Giaconia, Stashwick, & Fitzmaurice, Reference Reinherz, Paradis, Giaconia, Stashwick and Fitzmaurice2003; Weissman et al., Reference Weissman, Wickramaratne, Nomura, Warner, Verdeli and Pilowsky2005). Regarding sadness, one may argue that this result is inconsistent with the view that sadness is a low arousal negative emotion (Russell, Reference Russell1980). However, a study comparing the psychophysiological profiles of sadness and fear found that the two emotions yielded similar patterns on several indicators of arousal (Kreibig, Wilhelm, Roth, & Gross, Reference Kreibig, Wilhelm, Roth and Gross2007). In addition, sadness has been associated with increased adrenocortical activation (Ottowitz et al., Reference Ottowitz, Dougherty, Sirota, Niaura, Rauch and Brown2004), a finding that may be particularly true in preschoolers (Lewis, Ramsay, & Sullivan, Reference Lewis, Ramsay and Sullivan2006) whose sadness expressions tend to be especially activated.
We also found that the PE × NE interaction on posterior asymmetry was specific to girls. Given that females are at far greater risk for depression than males (Nolen-Hoeksema & Hilt, Reference Nolen-Hoeksema, Hilt, Gotlib and Hammen2009), it is important to look at whether temperament plays a role in this disparity (Hankin & Abrahmson, Reference Hankin and Abramson1999). Of interest, there are conflicting results as to whether NE and PE have a similar relation to depression in boys versus girls (Chorpita, Reference Chorpita2004; Jacques & Mash, Reference Jacques and Mash2004; Ollendick, Seligman, Goza, Byrd, & Singh Reference Ollendick, Seligman, Goza, Byrd and Singh2003; Wetter & Hankin, Reference Wetter and Hankin2009). Although speculative, it is possible that a posterior asymmetry may only connote risk for depression in girls and not boys. As we follow up this sample through adolescence, it will be important to examine whether EEG asymmetry can elucidate the gender disparities in depression that appear in adolescence (Hankin et al., Reference Hankin, Abramson, Moffitt, Silva, McGee and Angell1998).
Similar to our previous report (Shankman et al., Reference Shankman, Tenke, Bruder, Durbin, Hayden and Klein2005), we did not find an association between temperament and frontal asymmetry. There are several possible explanations for this finding. First, frontal asymmetries may be more likely to be associated with depression/temperament in adult EEG studies because certain areas of the prefrontal cortex, such as the dorsolateral prefrontal cortex (Davidson et al., Reference Davidson, Lewis, Alloy, Amaral, Bush and Cohen2002), do not fully develop until adolescence. However, there is no evidence to suggest that the prefrontal cortex has to be fully developed in order to exhibit the hypothesized asymmetry. For example, Fox and colleagues have found differences in frontal EEG asymmetry between infants defined as criers versus noncriers (Davidson & Fox, Reference Davidson and Fox1989; Fox, Bell, & Jones, Reference Fox, Bell and Jones1992) and in infants of depressed versus nondepressed mothers (Jones et al., Reference Jones, Field, Davalos and Pickens1997). However, these studies differed from the present study as they typically employed selected samples. Second, our failure to find a significant frontal asymmetry may be because this asymmetry is only low to moderately stable (Tomarken et al., Reference Tomarken, Davidson, Wheeler and Doss1992) and can be influenced by state variables (Blackhart, Kline, Donohue, LaRowe, & Joiner, Reference Blackhart, Kline, Donohue, LaRowe and Joiner2002; Shankman et al., Reference Shankman, Klein, Tenke and Bruder2007). Third and finally, studies that have found frontal asymmetries in children at risk for depression defined risk as having a parent with depression (Dawson et al., Reference Dawson, Frey, Self, Panagiotides, Hessl and Yamada1999; Field, Pickens, Fox, & Nawrocki, Reference Field, Pickens, Fox and Nawrocki1995) while we defined it on the basis of child temperament in this and our previous report (Shankman et al., Reference Shankman, Tenke, Bruder, Durbin, Hayden and Klein2005).
This study had several strengths. First, the sample is quite large, particularly for a psychophysiological study in children. This allowed us to exclude left-handed children and examine interactions, which is often not done in EEG studies in children. Second, temperament was defined using a comprehensive laboratory observation measure (i.e., LAB-TAB; Goldsmith et al., Reference Goldsmith, Reilly, Lemery, Longley and Prescott1995). Third, we examined the effect of recording reference (nose and average reference), a variable often used as an indicator of signal noise in EEG studies (Coan et al., Reference Coan, Allen and McKnight2006). As our primary results were not moderated by reference, this argues for the robustness of our findings.
The present study had several limitations as well. First, the children in the present sample had lower sadness and fear scores than the larger sample in our study. Our results may therefore not generalize to temperament in the general population. However, sadness and fear were significantly related to asymmetries in this sample, despite the more restricted range in this group relative to the larger sample. Second, as discussed above, because children were told that they would receive a prize if they would sit still, it may be difficult to compare our results to other studies in which EEG was recorded “at rest.” This, however, was necessitated by the young age of our sample in order to ensure relatively artifact-free data.
In summary, our results suggest that low PE and high NE interact in predicting a posterior asymmetry, and not an anterior asymmetry. Using EEG asymmetry as a marker for depression, the direction of the interaction suggests that children with low PE or high NE are at risk for depression and children with both temperamental traits are not at greater risk than those with only one. As we are following up this sample of preschoolers, it will be important to examine whether these temperamental traits continue to predict markers for depression as well as the development of the disorder. Such results would suggest that these temperamental traits may be good targets for preventative strategies (Garber, Reference Garber2006; Karevold, Røysamb, Ystrom, & Mathiesen, Reference Karevold, Røysamb, Ystrom and Mathiesen2009).