Introduction
Establishing the parental melt is one of the prime goals of petrologists investigating intrusive cumulate complexes as these have important implications for our understanding of the geotectonic environment in which these complexes were generated, and it is critical for understanding and modelling magmatic mineralisation processes (e.g. Barnes et al., Reference Barnes, Maier and Curl2010; Jagoutz et al., Reference Jagoutz, Müntener, Burg, Ulmer and Jagoutz2006; McCallum, Reference McCallum and Cawthorn1996). This is especially acute for Archean cratons such as the North Atlantic Craton in SW Greenland where the dominating tonalite–trondhjemite–granodiorite (TTG) orthogneisses (Garde, Reference Garde1997; Nutman et al., Reference Nutman, Bennett, Friend, Yi and Lee2015) dominate the rock record. There is important geological information hidden in the older subordinate ultramafic–mafic layered complexes, both in terms of geodynamic setting (Myers, Reference Myers1985; Szilas et al., Reference Szilas, Kelemen and Rosing2015b, Reference Szilas, Hoffmann, Schulz, Hansmeier, Polat, Viehmann and Münker2016, Huang et al., Reference Huang, Polat, Fryer, Appel and Windley2012; McIntyre et al., Reference McIntyre, Pearson, Szilas and Morishita2019) and economic aspects (Szilas et al., Reference Szilas, van Hinsberg, McDonald, Næraa, Rollinson, Adetunji and Bird2018; Waterton et al., Reference Waterton, Hyde, Tusch, Hollis, Kirkland, Kinney and Szilas2020).
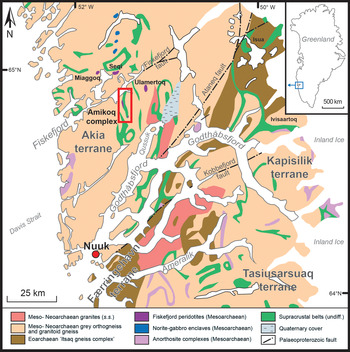
One such complex is the Amikoq Layered Complex, the largest in the Fiskefjord region (Fig. 1; e.g. Szilas et al., Reference Szilas, Kelemen and Bernstein2015a), dominated by plagioclase-orthopyroxene noritic sequences and subordinate ultramafic rocks (Aarestrup et al., Reference Aarestrup, Jørgensen, Armitage, Nutman, Christiansen and Szilas2020; Garde, Reference Garde1997) and its reef-like platinum-group element (PGE) occurrences, albeit economically unviable at present (Harmer, 2009). The Amikoq Layered Complex rock associations and reef-like PGE occurrence compare well with major mineralised intrusive complexes such as Stillwater, USA (McCallum, Reference McCallum and Cawthorn1996; Irvine et al., Reference Irvine, Keith and Todd1983) and Bushveld, South Africa (Barnes et al., Reference Barnes, Maier and Curl2010; Eales and Cawthorn, Reference Eales and Cawthorn1996) and studies of the Amikoq Layered Complex hold the potential to provide insight into the petrogenesis of such rock associations from the Archean and their economic prospects.
Simplified regional geological map of SW Greenland, location indicated by the blue square on the small inset. Red square indicates the Amikoq Layered Complex, and outlines the extent of the detailed map in Fig. 2. Other nearby and possibly co-magmatic ultramafic complexes are also shown. Modified after Szilas et al. (Reference Szilas2018) based on mapping by the Geological Survey of Denmark and Greenland (GEUS).

This study presents major- and trace-element whole-rock data for a large suite of rocks from the Amikoq Layered Complex and the hosting amphibolites. The very systematic variation in composition of the noritic rocks allows characterisation of their parental melt as having boninitic traits. Simple fractionation and cumulate models nevertheless fail in satisfactorily reproducing the trace-element trends of the noritic rocks, and a contaminant/mixing agent of island-arc-tholeiite (IAT)-like affinity is required. Furthermore, the modelling presented here indicates that some of the ultramafic rocks cannot be co-magmatic with the noritic rocks, and a contemporaneous relation is dubious.
Geological background
North Atlantic Craton
Southwest Greenland consists of several discrete Archean tectonostratigraphic terranes dominated by TTG orthogneisses amalgamated during the late Mesoarchean to Neoarchean (Dziggel et al., Reference Dziggel, Kokfelt, Kolb, Kisters and Reifenröther2017; Friend et al., Reference Friend, Nutman, Baadsgaard, Kinny and McGregor1996; Garde, Reference Garde1997; Nutman et al., Reference Nutman, Bennett, Friend, Yi and Lee2015; Polat et al., Reference Polat, Wang and Appel2015). From north to south these terranes consist of the Tuno terrane (mostly 2860–2730 Ma, similar to Tasiusarsuaq), Akia terrane (c. 3250–2940 Ma), Færingehavn terrane (>3600 Ma), Isukasia terrane (>3600 Ma), Kapisilik terrane (c. 3075–2960 Ma, granites of c. 2970–2960 Ma), Tre Brødre terrane (c. 2840–2800 Ma) and the Tasiusarsuaq terrane (c. 2950–2810 Ma) (Dziggel et al., Reference Dziggel, Kokfelt, Kolb, Kisters and Reifenröther2017; Friend and Nutman, Reference Friend and Nutman1994; Friend et al., Reference Friend, Nutman, Baadsgaard, Kinny and McGregor1996; Garde, Reference Garde1997, Reference Garde, Friend, Nutman and Marker2000, Reference Garde2007; Kirkland et al., Reference Kirkland, Yakymchuk, Szilas, Evans, Hollis, McDonald and Gardiner2018; Nutman et al., Reference Nutman, Friend, Bennett and McGregor2004, Reference Nutman, Bennett, Friend, Yi and Lee2015; Szilas et al., Reference Szilas, van Hinsberg, McDonald, Næraa, Rollinson, Adetunji and Bird2018). The metamorphic conditions range from amphibolite to granulite facies, with evidence of polymetamorphic events including hydration/dehydration and anatexis (e.g. Dziggel et al., Reference Dziggel, Kokfelt, Kolb, Kisters and Reifenröther2017; van Hinsberg et al., Reference Van Hinsberg, Crotty, Roozen, Szilas and Kisters2018; Peters et al., Reference Peters, Szilas, Sengupta, Kirkland, Garbe-Schönberg and Pack2020; Yakymchuk et al., Reference Yakymchuk, Kirkland, Hollis, Kendrick, Gardiner and Szilas2020).
The Archean terrane collage is bounded to the north and south by Paleoproterozoic orogens (Escher and Watt, Reference Escher and Watt1976; Nutman et al., Reference Nutman, Friend, Bennett and McGregor2004). Paleoproterozoic events have so far been recorded as several generations of dyke swarms, the c. 2500 Ma Kilarsaarfik dykes, the c. 2370–2360 Ma Grædefjord dykes, c. 2215–2210 Ma boninitic norite dykes (Nutman et al., Reference Nutman, Hagiya and Maruyama1995) and the contemporaneous c. 2040 Ma Kangâmiut and c. 2050–2030 Ma MD3 dykes (Hall and Hughes, Reference Hall and Hughes1987; Nilsson et al., Reference Nilsson, Söderlund, Ernst, Hamilton, Scherstén and Armitage2010, Reference Nilsson, Klausen, Söderlund and Ernst2013).
The Akia Terrane
Western Akia (Fig. 1) hosts the oldest part of the terrane and is composed of c. 3200 Ma dioritic and mafic tonalitic gneisses (Garde, Reference Garde1997). Amphibolitic enclaves as well as minor anorthosite and leucogabbro enclaves have been observed in the diorites (Garde, Reference Garde1997). The magmatic phase responsible for the dominant Akia grey orthogneiss of TTG and minor dioritic character occurred between 3058 and 3022 Ma, possibly lasting until 3000 Ma on the basis of the ages of inherited zircon grains (Garde, Reference Garde1997, Reference Garde, Friend, Nutman and Marker2000; Yakymchuk et al., Reference Yakymchuk, Kirkland, Hollis, Kendrick, Gardiner and Szilas2020). It has recently been proposed that Eoarchean mafic crust was involved in the c. 3.2 Ga diorite and 3.0 Ga tonalite Akia crust forming events on the basis of zircon Hf-isotopic evidence (Gardiner et al., Reference Gardiner, Kirkland, Hollis, Szilas, Steenfelt, Yakymchuk and Heide-Jørgensen2019, Reference Gardiner, Kirkland, Hollis, Cawood, Nebel, Szilas and Yakymchuk2020). The grey tonalitic orthogneisses common to the Fiskefjord area, central Akia, are probably a second magmatic phase contemporaneous with the voluminous Taserssuaq tonalite in NE Akia (2982 ±7 Ma; Garde, Reference Garde1990; Garde et al., Reference Garde, Friend, Nutman and Marker2000; Steenfelt et al., Reference Steenfelt, Hollis, Kirkland, Sandrin, Gardiner, Olierook, Szilas, Wateron and Yakymchuk2020; Olierook et al., Reference Olierook, Kirkland, Szilas, Hollis, Gardiner, Steenfelt, Jiang, Yakymchuk, Evans and McDonald2020). This is supported by recent zircon U–Pb radiometric age determination of the tonalitic orthogneiss (2978 ±8 and 2969 ±5 Ma) that host and cut the ultramafic Seqi Complex (Szilas et al., Reference Szilas, van Hinsberg, McDonald, Næraa, Rollinson, Adetunji and Bird2018; Whyatt et al., Reference Whyatt, Peters, Pack, Kirkland, Balic-Zunic and Szilas2020). The second magmatic phase was essentially contemporaneous with the emplacement of the Qugssuk granite and Igánánguit granodiorite domes (2975 ±5 Ma and 2975 ±15 Ma, respectively) in turn intruded by post-kinematic diorite plugs (2976 ±16 Ma; Garde et al., Reference Garde, Friend, Nutman and Marker2000).
Both magmatic phases intruded as sheets resulting in an intercalation with subordinate amphibolitic successions of MORB affinity and minor ultramafic–mafic complexes of probable cumulate origin (Garde, Reference Garde1997; Garde et al., Reference Garde, Friend, Nutman and Marker2000; Guotana et al., Reference Guotana, Morishita, Yamaguchi, Nishio, Tamura, Tani, Harigane, Szilas and Pearson2018; Szilas et al., Reference Szilas, Kelemen and Bernstein2015a, Reference Szilas2018; Waterton et al., Reference Waterton, Hyde, Tusch, Hollis, Kirkland, Kinney and Szilas2020). The amphibolites can be subdivided into dominantly homogenous and subordinate heterogeneous types where the former might represent subvolcanic intrusives and the latter volcanic given the common association with metasedimentary rocks (Garde, Reference Garde1997).
Initial metamorphic conditions, as determined from the Akia sillimanite-garnet metasedimentary rocks, consisted of prograde amphibolite and peak granulite facies with zircon U–Pb ages of 3035 ±3 Ma and 2999 ±4 Ma, respectively (Friend and Nutman, Reference Friend and Nutman1994). Metamorphic overgrowths on igneous zircons have ages ranging to c. 2975 Ma (Yakymchuk et al., Reference Yakymchuk, Kirkland, Hollis, Kendrick, Gardiner and Szilas2020) demonstrating that peak granulite-facies conditions of ~800°C and ~8 kbar (Riciputi et al., Reference Riciputi, Valley and McGregor1990) culminated in the period 3000–2975 Ma (Kirkland et al., Reference Kirkland, Yakymchuk, Szilas, Evans, Hollis, McDonald and Gardiner2018, Reference Kirkland, Yakymchuk, Gardiner, Szilas, Hollis, Olierook and Steenfelt2020). Retrogression to amphibolite facies followed, although constrained principally to central Akia (e.g. Garde, Reference Garde1990).
Amikoq Layered Complex: Geology and previous work
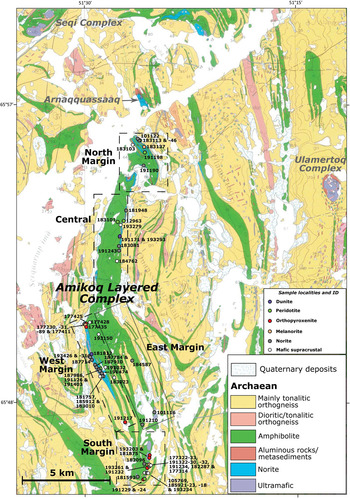
Nunaminerals A/S conducted several field expeditions to the Amikoq area exploring for PGE occurrences in the Amikoq mafic–ultramafic complex, (Fig. 2), and melanorite-hosted ‘Rhodium Zone’ at South Margin (Armitage, 2009; Harmer, 2009). Field observations from these reports are included below. Note that ‘melanorite’ used in this work also encompasses ‘feldspathic pyroxenite’ used in these reports as plagioclase contents can exceed 10 vol.% (Aarestrup et al., Reference Aarestrup, Jørgensen, Armitage, Nutman, Christiansen and Szilas2020; Le Maitre et al., Reference Le Maitre, Streckeisen, Zanettin, Le Bas, Bonin, Bateman, Bellieni, Dudek, Efremova, Keller and Lamere2002). Similarly, ‘norite’ also encompass ‘leuconorite’. As all the rocks investigated have been metamorphosed the prefix ‘meta’ is taken as being implicit.
Geological map of the Amikoq Layered Complex divided into zones. Dots indicate sample locations. Smaller ultramafic bodies and satellites occur in the vicinity of the complex. Structurally, the complex is composed of a doubly plunging fold notable at the North- and South Margins. Base map modified from Aarestrup et al. (Reference Aarestrup, Jørgensen, Armitage, Nutman, Christiansen and Szilas2020), which is after Garde (Reference Garde1989).

General geology
Szilas et al. (Reference Szilas, Kelemen and Bernstein2015a) included Amikoq ultramafic samples in their regional study of Fiskefjord peridotites. These authors favoured a cumulate origin for the Fiskefjord peridotites rather than as mantle fragments on the basis of negative Ir-anomalies and high bulk-rock MgO and FeOtot. They considered the parental melt to have been of high-Mg and low-CaO/Al2O3 character, possibly boninitic given U-shaped trace-element patterns. A co-genetic link between peridotites and Amikoq norites was suggested based on prevalent negative Eu anomalies in the peridotites and negative Rh anomalies possibly related to the Rh-mineralisation at Amikoq (Armitage, 2010).
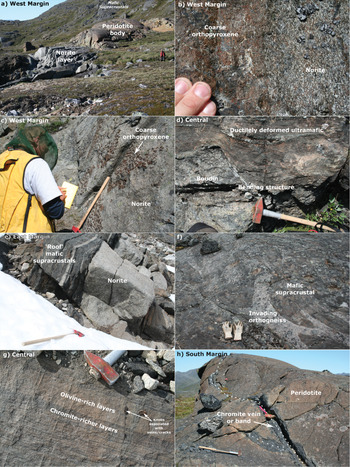
Zircon mega-crysts (cm scale) in quartzo-feldspathic pockets hosted in orthopyroxene-dominated Amikoq Layered Complex lithologies have yielded U–Pb ages of 2990 ±13 Ma (Nilsson et al., Reference Nilsson, Söderlund, Ernst, Hamilton, Scherstén and Armitage2010) and 3004 ±9 Ma (Aarestrup et al., Reference Aarestrup, Jørgensen, Armitage, Nutman, Christiansen and Szilas2020). The latter authors favoured these zircons to be associated with anatectic melts and consequently interpreted the ages to reflect peak metamorphic conditions or the waning stages thereof. Irrespective of origin, the ages yield a minimum age of c. 3 Ga for the complex as a whole. The Amikoq Layered Complex is subdivided into areas termed West-, South-, East-, Central- and North Margins (WM, SM, EM, CM and NM, respectively; Fig. 2), and the majority of samples included in this study are derived from the West and South Margins. The complex is presently ~20 km long and consists of discontinuous norite–melanorite sheets up to 150 m thick containing subordinate ultramafic bodies with near-vertical layering (Fig. 3a–c; Armitage, 2010; Garde, Reference Garde1997). The ultramafic bodies are elongated-to-lensoid in shape (Garde, Reference Garde1997) and are usually accommodated centrally in the sequences, except at the South Margin where they may constitute the bottom of the sequence and are more prevalent than elsewhere in the complex (Harmer, 2009). Bending structures in ultramafic rocks associated with boudins are occasionally observed indicating deformation in the ductile regime (Fig. 3d). Structurally, the complex consists of an approximately N–S trending doubly plunging synform with a southern closure south of the South Margin (Aarestrup et al., Reference Aarestrup, Jørgensen, Armitage, Nutman, Christiansen and Szilas2020). Mafic–ultramafic sequences are exposed on the flanks and in the hinge zones (Garde, Reference Garde1997).
Field photos and observations. (a) West Margin norite-peridotitic succession with near-vertical layering and mafic host rock (amphibolite) in the background. Note that such amphibolites are typically called ‘supracrustal rocks’ in the literature on this region. However, for simplicity we use the term ‘mafic host rock’ throughout this study. (b) Close up of West Margin norites. The typical norite on the right shows a transition to markedly coarser orthopyroxene with interstitial plagioclase. (c) West Margin noritic succession with patches containing very coarse orthopyroxene. (d) Ultramafic rocks at Central Amikoq. This outcrop displays typical bending structures interpreted as boudinage, characteristic of ductile deformation. (e) Transition from roof mafic host rock to norite observed at East Margin. Hammer for scale. (f) Relationship between host amphibolites and the regional orthogneiss. Tonalitic intrusion into the host amphibolite, now present as slivers, demonstrate the younger age of the former. (g) Layered ultramafic outcrop from Central Amikoq with layers varying in olivine/chromite ratio. Coarse knobs of orthopyroxene may be caused by percolating SiO2-rich fluids. (h) Ultramafic body at the South Margin with a thick discordant chromitite vein. Note the abruptly stopping aphophysis.

Norite–melanorite sequences
Drill core logs from South and Western Margins are available (Armitage, 2009; 2010), but because they cannot be correlated, even with close positioning, they are included for reference in Fig. S4 in Supplementary materials (see below).
TTG-type grey gneiss has been observed to cut mafic host rocks, whereas inclusions of amphibolite are also cross-cut by the ALC (Figs 3e,f, S1) indicating a relative chronology of mafic host rocksoldest → ALC → TTGyoungest. Noritic sequences can host ‘tectonised norite’ units; however, these are most probably intercalated mafic host rocks (Aarestrup et al., Reference Aarestrup, Jørgensen, Armitage, Nutman, Christiansen and Szilas2020).
Metamorphic overprint
The metamorphic conditions experienced by the Amikoq Layered Complex and the mafic host rocks were investigated by Aarestrup et al. (Reference Aarestrup, Jørgensen, Armitage, Nutman, Christiansen and Szilas2020) using mineral compositions of representative samples. The ALC experienced granulite facies (garnet-cordierite, ~820°C and ~7.5 kbar, sillimanite-garnet-cordierite gneiss) followed by retrogression to amphibolite facies conditions ending at ~560°C and ~3.0 kbar (biotite-garnet). Minor metamorphic overprinting was characterised as chlorite at the expense of olivine, orthopyroxene, spinel ± Ca-amphibole in ultramafic rocks, (Fe,Mg,Mn)-amphibole + magnetite at the expense of orthopyroxene and plagioclase in noritic rocks and pale green high-Al Ca-amphibole ± quartz ± chlorite at the expense of plagioclase and orthopyroxene or green Ca-amphibole in noritic and mela-hornblende gabbro lithologies, respectively. Igneous textures and primary mineralogy of the noritic lithologies are particularly well preserved, albeit equilibrated, with metamorphic overprinting that is restricted principally to high-strain zones, which allowed the influx of fluids and subsequent formation of hydrous minerals that are locally present. Noritic green Ca-amphibole geochemistry indicates an igneous provenance supported by plagioclase-hornblende and orthopyroxene-biotite thermometry results of ~800–1070°C as well as textural evidence (Aarestrup et al., Reference Aarestrup, Jørgensen, Armitage, Nutman, Christiansen and Szilas2020). Amphibole was suggested to have formed by melt + orthopyroxene reactions and to have been a minor intercumulus phase, whereas the rarity or indeed near-absence of clinopyroxene lithologies led Aarestrup et al. (Reference Aarestrup, Jørgensen, Armitage, Nutman, Christiansen and Szilas2020) to infer that clinopyroxene was an insignificant igneous crystallising phase.
Magmatic sequences
We have adopted the igneous nomenclature of the International Union of Geological Sciences (IUGS), (Le Maitre et al., Reference Le Maitre, Streckeisen, Zanettin, Le Bas, Bonin, Bateman, Bellieni, Dudek, Efremova, Keller and Lamere2002) for rocks of the Amikoq Layered Complex and the metamorphic IUGS nomenclature (Fettes and Desmon, Reference Fettes and Desmons2011) for host rocks where the mafic MORB-like rocks are of amphibolitic and retrogressed mafic granulite types (Aarestrup et al., Reference Aarestrup, Jørgensen, Armitage, Nutman, Christiansen and Szilas2020). The term mafic ‘supracrustal rocks’ (Garde, Reference Garde1997) refers to host amphibolites of MORB-like character, which represent the mafic basement into which the ALC suite was intruded.
Amikoq olivine-orthopyroxene-plagioclase-amphibole compositional data (Aarestrup et al., Reference Aarestrup, Jørgensen, Armitage, Nutman, Christiansen and Szilas2020; Szilas et al., Reference Szilas, Kelemen and Bernstein2015a) are summarised in Fig. S2 and a schematic illustration of the currently available stratigraphy of West, South and North Margins are available in Fig. S3 in the Supplementary materials. Minerals from individual samples have homogenous compositions indicative of metamorphic equilibration, except for a melanorite from the South Margin with poikilitic and zoned plagioclase of relict igneous origin (Aarestrup et al., Reference Aarestrup, Jørgensen, Armitage, Nutman, Christiansen and Szilas2020). The most magnesian minerals are observed in the ultramafic lithologies, especially at the North Margin, and forsterite (Fo) and enstatite (En) compositions are generally identical on a sample scale indicating subsolidus re-equilibration. Samples from an ultramafic body at the West Margin show decreasing En and Fo compositons in the sequence orthopyroxenite-olivine orthopyroxenite-dunite/harzburgite.
The anorthite content (An) of norite plagioclase is generally high, and higher than the En content of coexisting orthopyroxene; a reverse relationship seems to occur in melanorite from the South Margin, whereas a melanorite from West Margin displays a similar An-En relation as norite though less extreme. Low orthopyroxene En in the West Margin noritic lithologies coincide with these norites having the lowest bulk-rock Mg# and Cr contents, in contrast noritic lithologies from elsewhere in the complex have higher Mg# and Cr contents. The sparse noritic samples from the South and North Margins have orthopyroxene En contents overlapping those of the ultramafic samples, whereas South Margin noritic orthopyroxene have considerably lower En contents. Amphibolite samples are clearly distinguishable from the Amikoq Layered Complex samples as they have much lower orthopyroxene En and plagioclase An contents and clinopyroxene is common (not shown). Note that olivine and plagioclase have not been found to coexist.
The most abundant lithologies are orthopyroxene and plagioclase dominated, and range in modal composition from fine-to-medium-grained hornblende leuconorite to hornblende melanorite and through to coarse hornblende feldspathic orthopyroxenite (Aarestrup et al., Reference Aarestrup, Jørgensen, Armitage, Nutman, Christiansen and Szilas2020). Plagioclase/orthopyroxene modal content varies on a metre-scale and units of e.g. norite, can be tens of metres thick (Fig. S4), bearing some resemblance to rhythmic layering. Rare melanorite autoliths hosted in a plagioclase-orthopyroxene pegmatoid (Fig. S4) suggest that the ALC was intruded itself, possibly at a late magmatic stage.
Clinopyroxene-abundant rocks also occur, especially at the West Margin, including gabbronoritic lithologies although they are considerably less common than the orthopyroxene-dominated lithologies. However, on the basis of whole-rock and mineral data, the gabbronorites are probably part of the mafic host sequence and not part of the Amikoq Layered Complex and will not be considered part of the ‘noritic’ term used henceforth; which is used when no distinction is made between melanorite and norite. Plagioclase has been reported as a cumulus and an intercumulus phase in the noritic lithologies, whereas it is only present as intercumulus in the melanorite lithologies (Fig. 3b,c). Modal layering on a cm-scale has been observed in the field (Aarestrup et al., Reference Aarestrup, Jørgensen, Armitage, Nutman, Christiansen and Szilas2020). Mapping indicates that pyroxenite layers tend to taper out laterally, i.e. along strike, but whether this is a magmatic or tectonic feature is unclear.
Ultramafic sequences
These ultramafic olivine-rich and orthopyroxene-rich elongated, lensoid bodies (Garde, Reference Garde1997) have the modal mineralogy of peridotites (dunites, harzburgites, orthopyroxene hornblende peridotite) to pyroxenites/hornblendites (olivine orthopyroxenite, olivine orthopyroxene hornblendite) (Aarestrup et al., Reference Aarestrup, Jørgensen, Armitage, Nutman, Christiansen and Szilas2020). However, the most common ultramafic lithologies seem to be (hornblende) dunite-harzburgite-olivine orthopyroxenite–orthopyroxenite. ‘Peridotitic’ is used here when no distinction is made between the olivine-rich rocks and for simplicity includes dunites. Weathered surfaces commonly reveal layering parallel to the strike of the body and some bodies display characteristic knobbly weathering surfaces (Fig. S1c) as also observed in the nearby Seqi peridotite body (Szilas et al., Reference Szilas, van Hinsberg, McDonald, Næraa, Rollinson, Adetunji and Bird2018). The peridotitic-norite transition is commonly marked by a coarse orthopyroxenite layer/unit although peridotitic bodies also occur in direct contact with norite displaying both sharp and gradational contacts (Garde, Reference Garde1997). Some of these contacts may be tectonic (Armitage, 2010). Additionally, a coarsening of the peridotitic unit has been observed towards the norite at the Westen Margin, whereas the centre of the peridotitic body at the North Margin contains large orthopyroxene oikocrysts. Chromite mineralisation is common in the peridotitic bodies and occasionally forms distinct layering traceable over hundreds of metres (Fig. 3g,h; Lassen, Reference Lassen2006; Armitage, 2010).
Analytical methods
Whole-rock major and trace elements
Geochemical data were obtained at Cardiff University for major and trace elements by inductively coupled plasma optical emission spectrometry and mass spectrometry using the methods described by McDonald and Viljoen (Reference McDonald and Viljoen2006). Following measurement of the loss on ignition by standard gravimetric methods, samples of the ignited powder (0.1 g) were fused with Li-metaborate on a Claisse Fluxy system and the resulting melts dissolved in 2 vol.% HNO3 for analysis. The accuracy of the major- and trace-element analysis was assessed by analysis of the certified reference materials (CRMs) JB1a, JP1 and BIR-1, and approved by the laboratory staff at Cardiff University.
Results
Whole-rock major and trace elements
The results are available in Supplementary Data Table S1. All major elements referred to in this work have been recast from Fe2O3tot to FeOtot and are on a volatile free basis.
Major elements and selected transitional metals
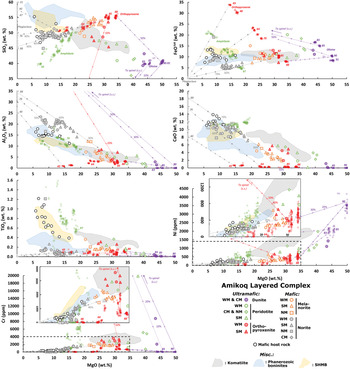
The highest MgO content and lowest SiO2 is observed in dunites and peridotites (28.3–43.8 and 36.1–47.5 wt.%, respectively; Fig. 4) together with the highest Ni (769–1979 ppm) in the dataset, although Cr content is highly variable (770–19,874 ppm). FeOtot is high (9.6–20.2 wt.%), whereas slight elevations of CaO and Al2O3 occur (0.2–5.8 and 0.9–6.8 wt.%, respectively). Both TiO2 and P2O5 are low (0.03–0.37 and 0.0–0.03 wt.%, respectively; Figs 4, S5).
Major-element, Ni and Cr content of the Amikoq Layered Complex and mafic host rocks. In general, the ALC samples display trends consistent with significant mineral controls, principally plagioclase-orthopyroxene±amphibole for noritic lithologies. Olivine-orthopyroxene with some spinel (evident from SiO2–MgO) define the peridotitic and orthopyroxenite samples, but elevated CaO–TiO2 suggest contribution from a CaO–TiO2 phase. The mafic host rocks are clearly distinct from the complex by their negative FeO–MgO trend, high TiO2, low Al2O3 and high Cr at similar MgO contents to norites. Translucent symbols indicate plagioclase (grey), green Ca-amphibole (green), orthopyroxene (red) and olivine (purple) mineral compositions from the ALC. Coloured numbers adjacent to mineral compositions indicate anorthite, amphibole Mg#, enstatite and forsterite contents. Tie lines connect minerals and cumulate rocks should plot on these lines or in a triangular region in conjuction with a third major mineral. Purple tie lines trending towards low SiO2, high Al2O3–FeO–Cr connect to spinel (s.s.). The dashed square in the Ni and Cr plots indicates the region of the close up. Abbreviations: WM – West Margin, CM – Central Margin, NM – North Margin, SM – South Margin, AN-1 – Amikoq noritic parental melt. IAT – Island-arc tholeiite. SHMB – Silicious high-Mg basalt. Data sources: Aarestrup et al. (Reference Aarestrup, Jørgensen, Armitage, Nutman, Christiansen and Szilas2020), Gale et al. (Reference Gale, Dalton, Langmuir, Su and Schilling2013), Garde (Reference Garde1997), Gardiner et al. (Reference Gardiner, Kirkland, Hollis, Szilas, Steenfelt, Yakymchuk and Heide-Jørgensen2019), König et al. (Reference König, Münker, Schuth and Garbe-Schönberg2008, Reference König, Münker, Schuth, Luguet, Hoffmann and Kuduon2010), Sossi et al. (Reference Sossi, Eggins, Nesbitt, Nebel, Hergt, Campbell, O'Neill, Van Kranendonk and Davies2016), Sun et al. (Reference Sun, Nesbitt, McCulloch and Crawford1989), Szilas et al. (Reference Szilas, Kelemen and Bernstein2015a), Taylor et al. (Reference Taylor, Nesbitt, Vidal, Harmon, Auvray and Croudace1994), Todd et al. (Reference Todd, Gill and Pearce2012).

Orthopyroxenites and melanorites have intermediate major-element contents as illustrated by FeOtot (7.3–15.1 wt.%) that correlate positively with MgO (21.6–31.5 wt.%) although SiO2 has the highest values (47.5–55.0 wt.%). Although CaO and Al2O3 generally overlap (1.9–6.2 and 3.4–12.2 wt.%, respectively) the orthopyroxenites have higher CaO at a given MgO content. Similarly to CaO, the Cr content tends to be elevated in the orthopyroxenites (2670–3577 ppm) relative to the melanorites (1431–2285 ppm) whereas Ni and TiO2 overlap (221–660 ppm and 0.05–0.36 wt.%, respectively). P2O5 is negligible in the orthopyroxenites (0.00–0.03 wt.%) and essentially absent in melanorites (≤0.01 wt.%; Fig. S5).
The norites from the West Margin are distinct from all other Amikoq norites, as they are more evolved, with lower MgO (7.5–12.7 wt.%) and higher FeOtot (8.0–10.4 wt.%) relative to all other unaltered norites (10.2–18.8 and 4.5–9.6 wt.%, respectively). This is also demonstrated by their low Ni and Cr content (70–118 and 1–14 ppm, respectively, excluding anomalous norite 193426 with 168 and 378 ppm, respectively) relative to all other unaltered norites (135–351 and 43–1699 ppm, respectively; Fig. 4). TiO2 shows a similar trend and is elevated in samples from the West Margin (0.12–0.18 wt.%) relative to the rest of the complex (0.02–0.12 wt.%, except for one anomalous sample (181593) with 0.26 wt.%). Nevertheless, CaO and Al2O3 generally overlap (7.1–11.5 and 14.2–23.3 wt.%, respectively; Fig. 4).
The mafic host rocks define a tholeiitic Fe enrichment trend (Fig. S6) and plot as basalts in the total alkali vs. silica (TAS) diagram (Le Maitre et al., Reference Le Maitre, Streckeisen, Zanettin, Le Bas, Bonin, Bateman, Bellieni, Dudek, Efremova, Keller and Lamere2002; not shown) with the exception of samples 183103 and 193279, which may be termed picrites on the basis of high MgO (13.4 and 16.5 wt.%, respectively) though this could be caused by the addition of cumulus olivine or local alteration. The mafic host rocks generally overlap with the West Margin norites in terms of SiO2, MgO and Ni and Cr (Fig. 4). However the mafic host rocks tend to have higher FeOtot (7.5–13.6 wt.%) that correlates negatively with MgO, whereas the norites show a positive correlation. Relative to the systematic variation of CaO, Al2O3 and MgO in the norites, CaO (8.1–13.9 wt.%) is considerably less systematic in the mafic host rocks whereas Al2O3 (11.2–17.8 wt.%) is lower in the latter lithologies. Furthermore, the mafic host rocks are clearly distinct from all other rock types in their high TiO2 and P2O5 contents (0.4–1.2 and 0.01–0.09 wt.%, respectively; Fig. 4).
Trace elements
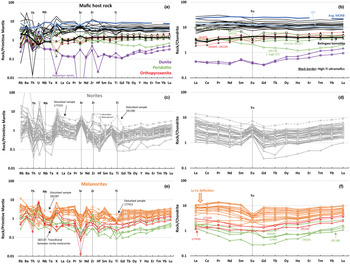
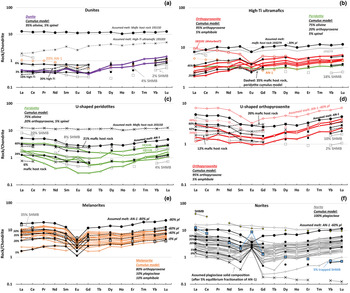
With the exception of a few anomalous norites, the dunites and peridotites are the most trace-element depleted samples and generally display flat-to-convex up (U-shaped) primitive mantle (Palme and O'Neill, Reference Palme, O'Neill, Turekian and Holland2003) and chondrite (Anders and Grevesse, Reference Anders and Grevesse1989) normalised patterns (Fig. 5), yielding low DyN/YbN ratios (0.38–0.95, except for sample 183101 with 1.32; N = chondrite-normalised values and are used throughout this work). The majority of the dunites and peridotites show positive primitive-mantle-normalised Zr anomalies however the peridotites display slight negative Sr anomalies (Sr/Sr*: 0.3–0.7, except for samples 191217 and 193261 with 1.2 and 1.9, respectively; Sr/Sr* = SrN / $\surd$ (PrN*NdN)) uncorrelated with Eu anomalies (Fig. 6). Nb-Ta anomalies are minimal (La/Nb: 0.9–2.1) relative to the distinctly elevated Nb-Ta (La/Nb: 0.5) in our two dunites (Fig. 5). Uranium is erratic, causing significant scatter in Th/U ratios (0.4–7.4, one outlier of 26.8; avg. MORB: 3.4; Gale et al., Reference Gale, Dalton, Langmuir, Su and Schilling2013).
Primitive-mantle- (a, c, e) and chondrite-normalised (b, d, f) trace-element diagrams. (a and b) Plot of mafic host rocks, relatively flat patterned high-Ti ultramafic rocks and dunites compared to IAT (light blue) average MORB (dark blue) and a Belingwe komatiite (heavy black line). Note that the high-Ti ultramafic rocks overlap consistently with komatiite. (c and d) Amikoq Layered Complex norites, depicting a coherent U-shaped pattern except for a few disturbed samples. The pattern is complementary to that of the melanorites. (e and f) Amikoq Layered Complex melanorites and ultramafic rocks with U-shaped patterns. The negative La–Ce deflection is complementary to the seemingly elevated La in the norites. Abbreviations: IAT – Island-arc tholeiite. Data sources: Anders and Grevesse (Reference Anders and Grevesse1989), Gale et al. (Reference Gale, Dalton, Langmuir, Su and Schilling2013), Palme and O'Neill (Reference Palme, O'Neill, Turekian and Holland2003), Sossi et al. (Reference Sossi, Eggins, Nesbitt, Nebel, Hergt, Campbell, O'Neill, Van Kranendonk and Davies2016), Todd et al. (Reference Todd, Gill and Pearce2012).

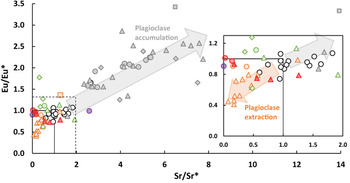
Eu-Sr anomalies of the Amikoq Layered Complex and mafic host rocks. Full black lines indicate no anomalies, the dashed square indicates the region enlarged in the inset. Large positive Sr anomalies are observed in the norites indicative of plagioclase accumulation, whereas negative anomalies are present in the melanorites indicative of plagioclase extraction. Except for positive Sr anomalies in some mafic host rocks, most depict no anomalies. The ultramafic rocks vary considerably in composition. Symbols and references as in Fig. 4.

In normalised trace-element distribution patterns the orthopyroxenites range from flat to slightly heavy rare-earth-element (HREE) enriched with some having a convex up pattern, and DyN/YbN ratios range from 0.6 to 1.3. Some possess distinct negative Sr and slight Eu anomalies (Sr/Sr*: 0.0–1.3; Eu/Eu*: 0.7–1.0; Eu/Eu* = EuN / $\surd$ (SmN*GdN)) albeit not necessarily correlated (Fig. 6). In common with the peridotites there are no conspicuous Nb-Ta anomalies (La/Nb: 0.7–1.8) with erratic U contents (Th/U: 0.1–3.7). The orthopyroxenites show no Zr anomaly (Fig. 5).
The melanorites have higher trace-element concentrations than the orthopyroxenites, peridotites and dunites, have a higher abundance of trace elements and display weakly U-shaped primitive-mantle-normalised trace-element distribution patterns, with slightly enriched HREE (DyN/YbN: 0.70–0.96; Fig. 5). Chondrite-normalised distribution patterns are weakly convex up with apparent depletion in the lightest light-REE (LREE): La and Ce, relative to Pr. Regardless of the slight La depletion (relative to Pr), a negative Nb-Ta anomaly is apparent (La/Nb: 0.9–3.6) as well as distinct negative Ti and Sr anomalies (Sr/Sr*: 0.1–1.3) of which the latter correlate positively with negative Eu anomalies (Eu/Eu*: 0.4–1.4; Fig. 6). Uranium contents are erratic but to a lesser degree than observed in other lithologies (Th/U: 0.3–6.3, two outliers of 16.8 and 17.1). The norites are complementary to the melanorites and exhibit lower overall trace-element abundances, a HREE enrichment relative to middle-REE (MREE; DyN/YbN: 0.37–0.96) and LREE enrichment relative to MREE yielding a distinct convex up (i.e. U-shaped) chondrite-normalised trace-element pattern. Positively correlated positive Sr and Eu anomalies (Sr/Sr*: 1.6–13.9; Eu/Eu*: 0.9–3.4) and negative Nb-Ta anomalies (La/Nb: 1.3–14.9) are conspicuous (Figs 5, 6) whereas Ti and Zr anomalies are variable and may be positive, negative or absent. In common with all other rocks, the norites have erratic U (Th/U: 0.02–6.6, three outliers of 13.5, 22.4, 76.4)
The mafic host rocks host the highest trace-element abundances at Amikoq. The normalised trace-element distribution patterns are flat (DyN/YbN: 0.97–1.15) and similar in shape, though slightly depleted, relative to present day average MORB (and D-MORB, not shown; Gale et al., Reference Gale, Dalton, Langmuir, Su and Schilling2013). This slight depletion is similar to modern primitive island-arc-tholeiites (Fig. 5; Todd et al., Reference Todd, Gill and Pearce2012). Some samples display pronounced LREE enrichment whereas others have LREE depletion (LaN/SmN: 0.51–1.65; Fig. 5). Anomalies of Sr and Eu are generally minor and not correlated or absent entirely (Sr/Sr*: 0.6–1.8, Eu/Eu*: 0.7–1.1, Fig. 6). In common with the norites, Zr and Ti anomalies are variable and may be negative, positive or absent, whereas Nb tend to show no conspicuous anomaly (La/Nb: 0.9–1.9, except for sample 183103 with a value of 4.0). Thorium and U are highly variable and one or both elements tend to be significantly depleted relative to Nb-Ta.
Discussion
The primary objective of this paper is to provide constraints on the Amikoq Layered Complex parental melt. Using major- and trace-element geochemistry, we will demonstrate that some cumulate rocks contain a significant melt component from which a parental melt composition can be tentatively determined. Prior to this discussion, we briefly comment on the mafic host host rocks as these, in conjunction with the Amikoq Layered Complex inferences, have the potential to provide constraints on geodynamic settings.
Reliability of the mafic host-rock trace-element signature
Several geochemical proxies provide clear evidence that the mafic host host rocks (including ‘gabbronorites’, amphibolites, mafic granulites etc.; Aarestrup et al., Reference Aarestrup, Jørgensen, Armitage, Nutman, Christiansen and Szilas2020) and the Amikoq Layered Complex are not co-magmatic. The hosting mafic host rocks have lower bulk rock Mg# (50.6–75.5) than the undisturbed complex lithologies (65.0–89.3), a feature also reflected in their more evolved mineral compositions (Fig. S2). Had the host rocks been representative of late stage, evolved melts associated with the crystallisation of the plagioclase-rich noritic units, distinctive positive or negative Sr-Eu anomalies, would be expected. However, such anomalies are absent/minimal (Fig. 6), demonstrating that host rocks and the Amikoq Layered Complex are not co-magmatic. This is also supported by amphibolitic blocks hosted in norites (Fig. S1) suggestive of an intrusive relationship.
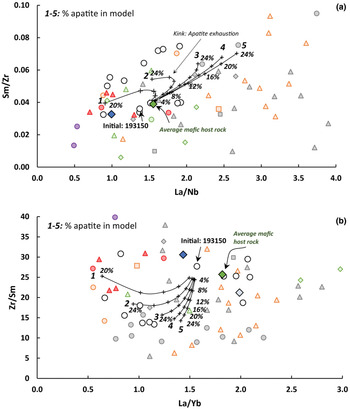
Granulite facies metamorphic conditions might have facilitated partial melting of the host rocks as has been suggested elsewhere in Akia (Yakymchuk et al., Reference Yakymchuk, Kirkland, Hollis, Kendrick, Gardiner and Szilas2020). Sample 193150 is assumed as the starting composition and is similar to the average Archean mafic tholeiitic amphibolite sample of Szilas (Reference Szilas2018). The modelled residual rock after partial melt extraction is plotted in Fig. 7 (see details in the supplementary materials). The modelling demonstrates that extraction of a partial melt is capable of producing the trending of the mafic host rocks, such as positive Sm/Zr vs. La/Nb ratios and the low La/Yb at low Zr/Sm ratios, although a lower La/Nb (~1) initial ratio of the rock might be required. The bulk rock P2O5 (0.01–0.09 wt.%) does not allow more than ~0.03–0.22% modal apatite (assuming 41 wt.% P2O5 in apatite). The model indicates that the Zr–Sm–Nb–La–Yb relationships of the mafic host rocks can be explained as residues after ~5–26% melt extraction. This probably explains the common significant Th depletion of the mafic supracrustal rocks. This puts into question whether the mafic host rock trace-element patterns represent protolith compositions, as also pointed out by Szilas (Reference Szilas2018). Indeed, the slightly elevated La/Nb ratios (i.e. >1) could be a product of superimposed crustal anatexis, rather than a primary mantle melt signature.
Mafic host melt extraction models in La–Nb–Zr–Sm–Yb space. (a) Sm/Zr vs. La/Nb. (b) Zr/Sm vs. La/Yb. The modelling indicates that some of the trending exhibited by the mafic host rocks might be a restite trend (black lines) with variable apatite content in the initial rock. High apatite content will tend to stabilise the REE content in the restite yielding near-constant La/Yb ratios. Black crosses indicate composition of the restite in 4% melt extraction increments. Model parameters: Sample 193150 was assumed as initial and subjected to non-modal batch melt extraction. Mineralogy was assumed as orthopyroxene–clinopyroxene–amphibole–plagioclase–apatite and varied from 12:12:31:45:0 to 12:12:31:40:5, with an assumed melting mode of 5:20:35:10:30. Silicic partition coefficients are taken from Bacon and Druitt (Reference Bacon and Druitt1988) with Nb assumed equal to Ta. Average North American Craton mafic supracrustal rock shown for reference (Szilas, Reference Szilas2018). Other symbols and references as in Fig. 4.

Secondary effects/impact on the Amikoq Layered Complex trace elements
In common with the Fiskenæsset intrusive complex (Myers, Reference Myers1985; Huang et al., Reference Huang, Polat, Fryer, Appel and Windley2012), the noritic parts of the Amikoq Layered Complex are remarkably well preserved with relict igneous textures and mineralogy (Aarestrup et al., Reference Aarestrup, Jørgensen, Armitage, Nutman, Christiansen and Szilas2020), an observation which is supported by very systematic and coherent trace-element patterns (Fig. 5). A well-defined linear relationship is even observed between the extremely mobile Cs and immobile TiO2 in melanorites from the South Margin (see Fig. S7). Some minor overprint may nevertheless be present but is difficult to filter confidently from igneous processes. The highly variable U content is most probably caused by secondary disturbances, as Th–U should co-vary in igneous processes (unless zircon is fractionated) and U is quite mobile under oxidising conditions, possibly associated with fluid infiltration. Nevertherless, Th–Nb–Ta–Ti–REE relationships of the noritic lithologies suggest an overall good preservation for the protolith characteristics of these samples, with a few obvious exceptions.
The ultramafic samples are the most difficult to assess owing to their much more variable trace-element distribution patterns. As opposed to the noritic parts, most ultramafic samples seem to have been subjected to metamorphic fluids, resulting in formation of chlorite (± amphibole?), and it is doubtful whether any igneous textures are preserved (Aarestrup et al., Reference Aarestrup, Jørgensen, Armitage, Nutman, Christiansen and Szilas2020; Szilas et al., Reference Szilas, Kelemen and Bernstein2015a, Reference Szilas, van Hinsberg, McDonald, Næraa, Rollinson, Adetunji and Bird2018). Samples such as the dunites have unusually low La/Nb (~0.5) and low La/SmN (0.8–0.9) ratios which could indicate LREE loss. The conspicuous positive Zr anomalies of many ultramafic samples probably reflects local migration of residual liquid in the interstices of the cumulate pile. Thus, the distribution of this element can still be considered directly related to the melt evolution, and can therefore be determined by the AFC modelling. Zirconium is immobile, so it is unlikely to have been overprinted during post-magmatic processes. Peridotite 183101 is unusually enriched in LREE and is consequently suspected to have been disturbed. Such selective metasomatism of ultramafic rocks has been widely reported within the Akia terrane (e.g. Yakymchuk and Szilas, Reference Yakymchuk and Szilas2018; Whyatt et al., Reference Whyatt, Peters, Pack, Kirkland, Balic-Zunic and Szilas2020; van Hinsberg et al., Reference van Hinsberg, Yakymchuk, Jepsen, Kirkland and Szilas2021). Therefore, the interpretation of the trace-element geochemistry of the ultramafic rocks of the Amikoq Layered Complex must be considered with such potential overprinting in mind.
Norite sample 191190 has unusually high TiO2 (1.2 wt.%) contents akin to those of the mafic host rocks, which, together with low SiO2, high FeOtot, V and different trace-element distribution pattern suggest alteration and potential mobility of Fe. Armitage (2010) reported ‘rusty amphibolites’ and it is possible that the fluid responsible for such 'rusty' zones also resulted in disturbance of some Amikoq Layered Complex samples in certain high-strain zones acting as fluid pathways (Aarestrup et al., Reference Aarestrup, Jørgensen, Armitage, Nutman, Christiansen and Szilas2020). Melanorite sample 177411 shows unusually high V (506 ppm), Ti and low La, whereas 182287 has unusually high Nb, Ta, Zr and Hf contents, possibly also reflecting a secondary process.
Characterisation of a melt phase: Major- and trace-element evidence
Major-element compositions of the Amikoq Layered Complex rocks are broadly explicable in terms of the observed mineral phases (Fig. 4), suggesting a cumulate origin. In this case, the noritic rocks are explained as mixtures of plagioclase + orthopyroxene + subordinate hornblende with a greater proportion of plagioclase in (leuco-)norite relative to a dominant proportion of orthopyroxene in the melanorites to feldspathic orthopyroxenites. A role for hornblende is indicated by the TiO2 contents of melanorites. The ultramafic samples are mainly explicable as mixtures of olivine + orthopyroxene + spinel, where especially the SiO2 and Cr content of olivine rocks reveal a spinel contribution (Fig. 4). Note that the high FeO content of these rocks (9.6–20.2 wt.%, except for one outlier of 7.4 wt.%) exclude them as mantle fragments, given that mantle peridotites overwhelmingly have <9 wt.% FeO (Bodinier and Godard, Reference Bodinier, Godard, Turekian and Holland2014). Aside from the dominating orthopyroxene, the bulk composition of the orthopyroxenites also require the presence of a subordinate CaO–TiO2–Cr phase. These data seem to indicate that the Amikoq Layered Complex rocks are dominated by cumulus minerals with little room for the effect on the bulk-rock compositions of an interstitial melt component.
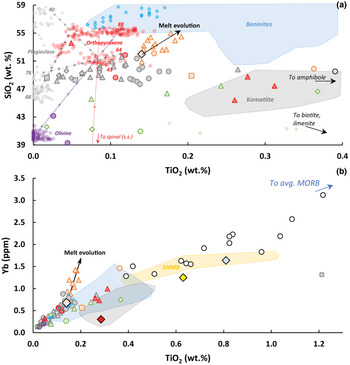
However, a plot of SiO2–TiO2 abundances reveals a melt component. This is because whereas the norites are explainable by plagioclase-orthopyroxene(-hornblende) accumulation, as indicated by their triangular spread in Fig. 8, the melanorites clearly define a positive trend at the end of which is no plausible mineral phase. This strongly indicates a melt component at >56 wt.% SiO2 and >0.2 wt.% TiO2. Furthermore, a plot of Al2O3–TiO2 (Fig. S8) reveals increasing SiO2–TiO2 and decreasing Al2O3 which would be consistent with fractional crystallisation of plagioclase. Linear extrapolation of the melanorite compositional array to low-SiO2 indicates that it is dominated by a plagioclase control line. This is supported by the presence of Eu*-Sr* anomalies (Fig. 6), where the melanorite array trends away from a locus of no anomalies and towards negative anomalies, the opposite trend being observed in the norites.
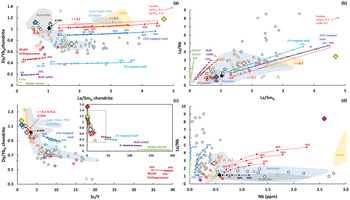
SiO2 and Yb as a function of TiO2. (a) SiO2 vs. TiO2. The melanorites form a trend towards high SiO2 and elevated TiO2, which cannot be explained by the presence of any of the observed mineral phases, implying the presence of a melt phase. Implicitly, the parental melt must lie at the start of the melt evolution trend, estimated as 52 wt.% SiO2 and 0.14 wt.% TiO2. (b) Yb vs. TiO2. All the melanorite trace elements follow a trend similar to SiO2 (see Fig. S8), exemplified here with Yb, which is interpreted as a melt evolution trend. The AFC model uses an initial AN-1 melt contaminated by an IAT-like composition; increments are 5% with a few representatives labelled. Symbols for the starting/model compositions as in Fig. 9, other symbols and references as in Fig. 4.

Two important implications arise: the first is that the noritic rocks are clearly cogenetic. The Eu*-Sr* anomalies and major-element data suggest that a plagioclase component was extracted from the melanorites, which now resides in the more leucocratic norites, a scenario supported locally by the higher anorthite content of the norites relative to melanorites (Fig. S2). Plagioclase extraction is most probably also responsible for the ‘overly’ positive La–Ce in the norites, reflected in the melanorites as slight La–Ce deficiencies (Fig. 5), the result of higher partition coefficients for the LREE in plagioclase relative to HREE, the reverse of the observations for the ferromagnesian minerals (e.g. Dunn and Sen, Reference Dunn and Sen1994). Extraction probably results from the flotation of low-density plagioclase relative to orthopyroxene (Müntener et al., Reference Müntener, Kelemen and Grove2001; Polat et al., Reference Polat, Longstaffe and Frei2018). However, rather than floating to the apex of the magma chamber, the plagioclase could have aggregated into rafts or layers at points of neutral buoyancy, a concept similar to that proposed for the plagioclase 'rockbergs' of the Stillwater complex (Wall et al., Reference Wall, Scoates, Weis, Friedman, Amini and Meurer2018). This hypothesis may explain the alternation of norite–melanorite layers at Amikoq (Fig. S4). Specifically, it seems that this sequestration of plagioclase in places may have been rather random or ineffective (Fig. 3b). Trace-element concentrations between the norites (lower abundances) and melanorites (higher abundances) preclude that melt + plagioclase was squeezed out of a crystal pile in which case, the norites should contain the higher concentrations of incompatible elements.
The second implication is that as the melanorite array is dominated by a plagioclase control line (Figs 6, 8), the parental melt to the noritic rocks must necessarily lie on this line, i.e. in between the melanorites and the norites. In SiO2–TiO2 space, this implies a parental melt with ~52 wt.% SiO2 and ~0.14 wt.% TiO2. Applying the same reasoning to all major- and trace-elements and using incompatible TiO2 as a proxy (Fig. 8), a possible parental melt composition can be estimated. This melt estimation approach is essentially similar to that of Jagoutz et al. (Reference Jagoutz, Müntener, Burg, Ulmer and Jagoutz2006). For elements where the compositional gap or trend between norites and melanorites is diffuse (i.e. P2O5, MgO, CaO, U, Eu, Ba, Sr, Cr, Zr, Sc, V, Cu), the melt composition is not as well constrained but represents the best possible estimate (see Table S2). Note that plagioclase extraction alone cannot account for the REE–TiO2 trend (Fig. 8, S8), implying either fractionation of diverse phases (plagioclase + orthopyroxene ± hornblende) and/or another magmatic process.
The absence of Sr-Eu anomalies indicates that the estimated melt composition represents that of a melt unaffected by plagioclase fractionation. In general, the trace elements are probably constrained better than the major elements as these should be more prone to the effects arising from accumulating minerals. A good example of this is the Th/U ratio, which varies considerably throughout the complex as a consequence of U mobility, however the Amikoq noritic melt has a Th/U of 3.33, which is very reasonable for a parental melt composition. Whether the resulting melt has been affected by olivine and/or orthopyroxene fractionation during ascent is difficult to preclude unambiguously, i.e. some fractionation might have occurred, but the very high Mg# (83.5), Ni (310 ppm) and Cr (1800 ppm) contents are well within the limits of a primary mantle-derived melt composition.
Type of noritic parental melt: Komatiite, contaminated komatiite or boninite?
Supplementary Data Table S2 and Fig. S9 compares the estimated Amikoq Noritic parental melt (AN-1) with magnesian melt compositions from the literature, chosen to include a range of geodynamic settings, such as fluid-flux melting at convergent plate boundaries, Archean high-degree of decompression melting in a plume and post-Archean layered intrusions in a continental setting. Thus the suites are Archean komatiites (~3.48–2.7 Ga; Sossi et al., Reference Sossi, Eggins, Nesbitt, Nebel, Hergt, Campbell, O'Neill, Van Kranendonk and Davies2016), modern boninites (Cameron et al., Reference Cameron, McCulloch and Walker1983; König et al., Reference König, Münker, Schuth and Garbe-Schönberg2008, Reference König, Münker, Schuth, Luguet, Hoffmann and Kuduon2010; Taylor et al., Reference Taylor, Nesbitt, Vidal, Harmon, Auvray and Croudace1994; Todd et al., Reference Todd, Gill and Pearce2012), and the average B-1 Bushveld marginal rock, thought to be parental to the orthopyroxene-plagioclase dominated Lower Zone, Lower Critical Zone and partly the Upper Critical Zone of the intrusion (Barnes et al., Reference Barnes, Maier and Curl2010; Eales and Cawthorn, Reference Eales and Cawthorn1996; Hatton and Sharpe, Reference Hatton, Sharpe and Crawford1989).
In terms of major elements, the Amikoq noritic parental melt has TiO2, Al2O3, FeO, MgO, CaO and alkalis comparable to both komatiites and boninites, although the low Al2O3 in Barberton komatiite and high CaO in Troodos and Fiji/Tonga boninite provide poor analogues to this melt. However, the very low TiO2 and high SiO2 of the Amikoq noritic parental melt are distinct from the komatiites and more comparable with Chichi-jima (Izu-Bonin) boninites. The relatively low Ni (310 ppm), Cr (1800 ppm) and high Sc (40 ppm) contents of the Amikoq noritic parental melt (AN-1) are also more comparable to the boninite suite (146–609, 669–2155 ppm and 27–40, respectively) than the komatiites (919–1882, 2605–2709 and 14–29 ppm, respectively). A key trait of the Amikoq noritic parental melt is the U-shaped chondrite- and primitive-mantle-normalised REE patterns, which compare favourably with Chichi-jima boninites and are quite distinct from the flat REE (Barberton-type) to slightly LREE depleted patterns (Beligwe and Munro types) of the komatiites.
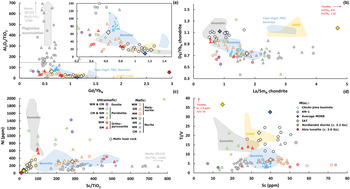
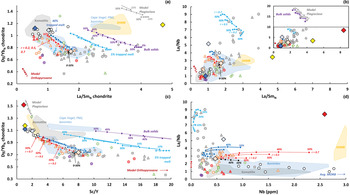
These fundamental geochemical differences are further emphasised by the major- and rare-earth-element plots of Al2O3/TiO2 vs. Gd/YbN-Chon, Dy/YbN vs. La/SmN and transition-metal plots of Ni vs. Sc/TiO2 Sc vs. Ti/V (Fig. 9). The superchondritic Al2O3/TiO2 and subchondritic Gd/YbN ratios of the parental melt (AN-1) (64.3 and 0.63, respectively) overlap those of Chichi-jima boninites. These characteristics are typical for boninites and reflect derivation from a highly depleted source, whereas Archean komatiites tend to have Gd/YbN ≤ 1 and Al2O3/TiO2 ≤ 24 suggesting derivation from a more undepleted source (Arndt, Reference Arndt2003). Similarly, subchondritic Dy/Yb (0.74) and superchondritic La/Sm (1.74) ratios clearly distinguishes the Amikoq norite parental melt from the komatiites but overlap with those of the Chichi-jima boninites. Lower Ni contents of boninites relative to komatiites could be a product of melting processes in which komatiites principally receive melt contributions from olivine + clinopyroxene + garnet (Walter, Reference Walter1998), whereas most boninites receive a significant melt contribution from the incongruent melting of orthopyroxene (Crawford et al., Reference Crawford, Falloon, Green and Crawford1989; Pearce and Reagan, Reference Pearce and Reagan2019). In boninite petrogenesis, Sc is usually inferred to be controlled by the presence of clinopyroxene in the source with the highest Sc melt concentrations reflecting a higher proportion of residual clinopyroxene (Crawford et al., Reference Crawford, Falloon, Green and Crawford1989). As such, high Sc in the Amikoq noritic parental melt might indicate a role for residual clinopyroxene in the source, possibly in accord with modest SiO2, but at variance with low CaO and CaO/Al2O3, which indicate low clinopyroxene contents in the source (Crawford et al., Reference Crawford, Falloon, Green and Crawford1989; Falloon et al., Reference Falloon, Green, McCulloch and Crawford1989).
Key major-element, REE and transition-metal characteristics. (a) Al2O3/TiO2 vs. Gd/Yb ratios normalised to chondrite. The norites trend towards high Al2O3/TiO2 ratios indicative of plagioclase accumulation. Dashed square indicates region expanded in inset. (b) Chondrite normalised ratios of Dy/Yb vs. La/Sm. The Amikoq Layered Complex depicts a trend from low La/Sm and flat HREE (Dy/Yb of unity) towards higher La/Sm and lower Dy/Yb ratios. This trend is similar to that observed for boninites, but is distinct from komatiites and siliceous high-Mg basalts. (c) Ni (ppm) vs. Sc/TiO2 ratios. The Amikoq Layered Complex mafic and a few ultramafic samples depict relatively low Ni at high Sc/TiO2 ratios typical of boninites, whereas the high-Ti ultramafic rocks have slightly elevated Ni with low Sc/TiO2 ratios. (d) Ti/V vs. Sc (ppm). The high-Ti ultramafic rocks have elevated Ti/V ratios at low Sc, comparable to komatiites. Low Ti/V ratios and high Sc contents are a characteristic of boninites and the mafic Amikoq complex rocks. Other symbols and references as in Fig. 4.

The occurrence of bona fide boninites in the Precambrian is debated intensely and many Precambrian ‘boninites’ might actually be misidentified low-Ti basalts or siliceous high-Mg basalts with the latter owing their boninite-like geochemistry to an origin as komatiite contaminated by continental crust (Crawford et al., Reference Crawford, Falloon, Green and Crawford1989; Pearce and Reagan., Reference Pearce and Reagan2019; Sparks, Reference Sparks1986; Sun et al., Reference Sun, Nesbitt, McCulloch and Crawford1989). For instance, the so-called boninitic-norite dykes of southern West Greenland (Hall and Hughes, Reference Hall and Hughes1987) have been suggested by Pearce and Reagan (Reference Pearce and Reagan2019) to represent siliceous high-Mg basalts, although these authors suggested the boninite-like rocks from the Isua greenstone belt (Polat et al., Reference Polat, Hofmann and Rosing2002) represent low-Ti basalts. Similarly, how the high SiO2–MgO, low-TiO2 B-1 boninite-like magma of the Bushveld complex obtained its composition has been a subject of much debate (Barnes, Reference Barnes1989; Barnes et al., Reference Barnes, Maier and Curl2010; Eales and Cawthorn, Reference Eales and Cawthorn1996; Hatton and Sharpe, Reference Hatton, Sharpe and Crawford1989; Maier et al., Reference Maier, Arndt and Curl2000; Pearce and Reagan, Reference Pearce and Reagan2019; Sparks, Reference Sparks1986). Thus, the Amikoq norite parental melt (AN-1) could potentially have an origin as siliceous high-Mg basalts.
Sun et al. (Reference Sun, Nesbitt, McCulloch and Crawford1989) critically evaluated the differences between a selection of Archean and Proterozoic siliceous high-Mg basalts and bona fide Phanerozoic boninites. They found that such siliceous high-Mg basalts typically depict a continuous increase in REE content from Lu to Gd and might have strong enrichments in LREE, traits unlike boninite trace-element signatures that tend to be U-shaped (Fig. S9). The proposed Amikoq norite parental melt is clearly distinct from both typical siliceous high-Mg basalt and the Bushveld B-1 ‘boninitic’ melt. Furthermore, significant Sr-Zr anomalies tend to be absent in siliceous high-Mg basalts yielding subchondritic Sr/Nd ratios (<17.2; Anders and Grevesse, Reference Anders and Grevesse1989), and low Sc and V contents resulting in low Sc/Y (<3) and high Ti/Sc (>73), Ti/V (>13) ratios relative to boninites (23–114, 3–21, 11–74, 2.8–13.3, respectively; König et al., Reference König, Münker, Schuth and Garbe-Schönberg2008, Reference König, Münker, Schuth, Luguet, Hoffmann and Kuduon2010; Taylor et al., Reference Taylor, Nesbitt, Vidal, Harmon, Auvray and Croudace1994; Todd et al., Reference Todd, Gill and Pearce2012). However positive Sr-Zr anomalies are absent in the Amikoq norite parental melt (Sr/Nd = 17, Zr/Sm = 22.2), and the high Sc and V contents coupled with low Ti result in high Sc/Y (8), low Ti/Sc (21) and Ti/V (7), ratios.
It was noted by Crawford et al. (Reference Crawford, Falloon, Green and Crawford1989) that siliceous high-Mg basalts tend to have elevated TiO2 (>0.55 wt.%) and total alkali (2–3 wt.%), generally matched by contamination models (0.4–0.7 and 1.0–2.8 wt.%, respectively; Sparks, Reference Sparks1986). Further, the Al2O3/TiO2 ratios of siliceous high-Mg basalts are low (12–31; Sun et al., Reference Sun, Nesbitt, McCulloch and Crawford1989) consistent with contamination modelling results (22–32; Sparks, Reference Sparks1986), and comparable to Archean komatiites (10–25; Sossi et al., Reference Sossi, Eggins, Nesbitt, Nebel, Hergt, Campbell, O'Neill, Van Kranendonk and Davies2016) but distinct from boninites (26–114; e.g. Arndt, Reference Arndt2003; König et al., Reference König, Münker, Schuth, Luguet, Hoffmann and Kuduon2010; Fig. 9). TiO2, total alkali and Al2O3/TiO2 ratios of the Amikoq norite parental melt (0.14, 0.7 wt.% and 64, respectively) together with most of the other above discussed proxies indicate strongly that this is neither a komatiite nor a siliceous high-Mg basalt and is boninitic. This is corroborated by the revised boninite-identification scheme recently proposed by Pearce and Reagan (Reference Pearce and Reagan2019) which is based on Si–Mg–Ti relationships. According to this scheme, the Amikoq norite parental melt consistently plots as a low-silica boninite (Fig. S8), whereas according to the IUGS nomenclature (Le Maitre et al., Reference Le Maitre, Streckeisen, Zanettin, Le Bas, Bonin, Bateman, Bellieni, Dudek, Efremova, Keller and Lamere2002) it falls right on the border between komatiite and boninite, as a consequence of the estimated SiO2 content of 52 wt.%. The low CaO of the Amikoq norite parental melt (5 wt.%) resulting in low CaO/Al2O3 (0.56) ratios might best be reconciled with Type 3 low-Ca boninites of Crawford et al. (Reference Crawford, Falloon, Green and Crawford1989) of which the Bonin Islands and Mariana Arc boninites are typical, and consistent with the trace-element inferences (Figs 9, S8, S9). However, Type 3 low-Ca boninites tend to have high SiO2 (>54 wt.%) unlike the Amikoq norite parental melt. Only the high-Ca boninites have low SiO2 (Crawford et al., Reference Crawford, Falloon, Green and Crawford1989), but provide a poor fit to the Amikoq norite parental melt with respect to all other trace-element aspects (Fig. S9).
Constraints from the crystallising assemblage
The most primitive olivine is observed in dunite/harzburgite from the North Margin (Fo89.7–92.1), where the most primitive orthopyroxene is also observed, though not from the same rock (En87.4–88.7; Szilas et al., Reference Szilas, Kelemen and Bernstein2015a), indicating initial olivine + orthopyroxene (+chromite?) crystallisation. It is possible that olivine crystallised initially. Primary magmatic spinel has not been observed in the noritic rocks, although metamorphic magnetite in cracks are quite common, and the only oxide of probable magmatic origin is minor ilmenite hosted as inclusions in orthopyroxene. Some ilmenite occurs at orthopyroxene–amphibole boundaries suggesting exsolution. As the spinel record is overprinted a unifying geochemical picture cannot be obtained from the spinels.
Olivine is never observed to coexist with plagioclase (i.e. no troctolitic lithologies; Figs S2–S4), suggesting that olivine was replaced on the liquidus by plagioclase, or that orthopyroxene was the only major silicate phase on the liquidus for a brief period, as perhaps also illustrated by orthopyroxenites with trace-element characteristics similar to those of the olivine-dominated ultramafic lithologies. Orthopyroxene-dominated cumulates with interstitial plagioclase, i.e. the melanorites, contain orthopyroxene with higher En contents and plagioclase with lower An content relative to norite (Aarestrup et al., Reference Aarestrup, Jørgensen, Armitage, Nutman, Christiansen and Szilas2020). Igneous green amphibole crystallised as an interstitial phase, as a late orthopyroxene-replacement phase and occasionally as a minor (i.e. unimportant) cumulus phase.
As such, the Amikoq layered complex crystallisation sequence may be inferred as:
olivine (±chromite) →
olivine + orthopyroxene + spinel (s.l.) ± clinopyroxene (+ ?amphibole)intercumulus ?→?
?orthopyroxene (+ amphiboleintercumulus) ?→?
orthopyroxenemelanorite + plagioclasenorite (+ amphibole)intercumulus →
orthopyroxenenorite + plagioclasemelanorite + ilmenite (+ amphibole)intercumulus.
This roughly corresponds to a cumulate succession of dunite → harzburgite → olivine orthopyroxenite ?→? orthopyroxenite ?→? melanorite → norite/leuconorite.
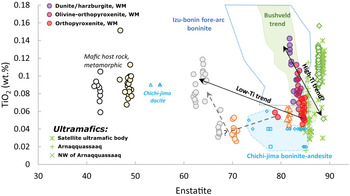
This sequence rests upon the assumption that all of the observed lithologies are co-magmatic. Exposed lower crustal intrusions reveal that this may not necessarily be correct as some ultramafic lithologies might be melt-rock derivatives, e.g. melt + olivine → pyroxene, rather than cumulates (Jagoutz et al., Reference Jagoutz, Müntener, Burg, Ulmer and Jagoutz2006). This hypothesis might also be valid for some of the layered ultramafic lithologies. Incompatible (i.e. TiO2) minor elements in minerals that appear to occur ubiquitously throughout the sequence provide the best means to track melt evolution (e.g. Eales and Cawthorn, Reference Eales and Cawthorn1996). Orthopyroxene occurs throughout the complex and orthopyroxene TiO2 contents reveals two distinct populations in which peridotitic orthopyroxene generally has higher En and TiO2 contents relative to the noritic lithologies that follow a shallow TiO2-enrichment trend (Fig. 10). The relatively steep TiO2 trend of the peridotitic orthopyroxenes is akin to the trend exhibited by orthopyroxene of the Lower Zone, Lower Critical Zone and Upper Critical Zone of Bushveld (Eales et al., Reference Eales, Botha, Hattingh, De Klerk, Maier and Odgers1993). This suggests that the noritic orthopyroxene originated from a parental melt with lower TiO2 content than at least some of the peridotitic orthopyroxene, possibly of Chichi-jima boninitic affinity (Fig. 10).
Orthopyroxene TiO2 (wt.%) vs. enstatite content. Two distinct trends are observable at the Amikoq layered complex; a low Ti trend typical of the noritic orthopyroxene and a high-Ti trend associated with orthopyroxene in ultramafic rocks. The former trend might be similar to a Chichi-jima orthopyroxene trend with low TiO2, whereas the high-Ti trend overlap with Bushveld orthopyroxene. It is possible that the high-Ti trend could be a melt–rock reaction trend, for which an olivine rock reacted with a high Si-Mg, low Ti melt similar to the Amikoq noritic parental melt. Orthopyroxene data sources: Aarestrup et al. (Reference Aarestrup, Jørgensen, Armitage, Nutman, Christiansen and Szilas2020), Eales et al. (Reference Eales, Botha, Hattingh, De Klerk, Maier and Odgers1993), Szilas et al. (Reference Szilas, Kelemen and Bernstein2015a), Taylor et al. (Reference Taylor, Nesbitt, Vidal, Harmon, Auvray and Croudace1994), Van der Laan et al. (Reference Van der Laan, Arculus, Pearce and Murton1992). Other symbols and references as in Fig. 4.

The crystallising assemblage can be envisaged in the olivine–plagioclase–clinopyroxene–quartz tetrahedron (Presnall et al., Reference Presnall, Dixon, Dixon, O'donnell, Brenner, Schrock and Dycus1978; Van der Laan et al., Reference Van der Laan, Flower and Koster van Groos1989). The inferred crystallising assemblage suggests a parental melt relatively depleted in a clinopyroxene component and enriched in silica, similar to what has been inferred or envisaged for the Ultramafic Series and the Lower Banded Series of the Stillwater Complex (McCallum, Reference McCallum and Cawthorn1996), the Lower Zone and the Critical Zones of the Bushveld Complex (Barnes et al., Reference Barnes, Maier and Curl2010; Eales and Cawthorn, Reference Eales and Cawthorn1996; Irvine et al., Reference Irvine, Keith and Todd1983) and more recently for Sudbury (Latypov et al., Reference Latypov, Chistyakova, Grieve and Huhma2019). Hence, the absence, or at least rarity of clinopyroxene, suggest that much of the crystallisation of the Amikoq layered complex proceeded until the plagioclase–orthopyroxene–clinopyroxene eutectic point was reached.
Pressure significantly changes phase relations in the evolution of mantle-derived magmas, providing constraints on the depths of their emplacement. Experiments have established that increasing pressure expands the clinopyroxene stability field at the expense of olivine, orthopyroxene and especially plagioclase (e.g. Baker and Eggler, Reference Baker and Eggler1983; Presnall et al., Reference Presnall, Dixon, Dixon, O'donnell, Brenner, Schrock and Dycus1978; Villiger et al., Reference Villiger, Ulmer and Müntener2007). This observation probably implies that the plagioclase-rich and clinopyroxene-poor Amikoq was a shallow intrusion, in agreement with inferences for similar plagioclase-orthopyroxene dominated intrusions e.g. Stillwater (<5 kbar; McCallum, Reference McCallum and Cawthorn1996; Wall et al., Reference Wall, Scoates, Weis, Friedman, Amini and Meurer2018) and the Lower and Lower Critical Zones of the Bushveld Complexes (3 kbar; Barnes et al., Reference Barnes, Maier and Curl2010).
Igneous hornblende implies that the Amikoq magma was hydrous, as amphibole stability requires >4.5 wt.% H2O in basaltic melts (Baker and Eggler, Reference Baker and Eggler1983; Berndt et al., Reference Berndt, Koepke and Holtz2005). Anorthite-rich plagioclase (An83–91; Fig. S2) also indicates crystallisation from a H2O-bearing melt as$\;{\rm Kd}_{{\rm pl}/{\rm melt}}^{{\rm Ca}/{\rm Na}}$ vary from essentially unity at anhydrous conditions and up to 3.4–5.5 in hydrous systems containing 4–6 wt.% H2O (Berndt et al., Reference Berndt, Koepke and Holtz2005; Sisson and Grove, Reference Sisson and Grove1993). The very primitive nature of Amikoq rocks (high MgO, Ni and Cr content) suggest crystallisation from a primitive melt. Primitive basaltic melts usually have liquidus phase crystallisation commencing at ~1250–1300°C (e.g. Müntener et al., Reference Müntener, Kelemen and Grove2001; Villiger et al., Reference Villiger, Ulmer and Müntener2007) and even higher in komatiitic systems (~1400–1600°C; Barr et al., Reference Barr, Grove and Wilson2009). This seems at odds with the igneous crystallisation of amphibole, albeit late, which is only stable at temperatures <1100°C (Adam and Green, Reference Adam and Green2006; Baker and Eggler, Reference Baker and Eggler1983; LaTourrette et al., Reference LaTourrette, Hervig and Holloway1995; Niida and Green, Reference Niida and Green1999). However, another well-documented effect of H2O is depression of all liquidus temperatures of silicate phases relative to anhydrous conditions (e.g. Danyushevsky, Reference Danyushevsky2001; Sisson and Grove, Reference Sisson and Grove1993; Van der Laan et al., Reference Van der Laan, Flower and Koster van Groos1989). In komatiitic systems, addition of ~4 wt.% H2O has been observed to lower the liquidus temperature by ~200°C (Barr et al., Reference Barr, Grove and Wilson2009). As such, both the presence of igneous amphibole and relatively high An content in plagioclase suggest that the complex crystallised from a H2O-bearing melt at relatively low temperatures.
Significance of high-Ti ultramafic rocks: A komatiitic melt?
Five ultramafic samples (183101, 191217, 181875, 191229 and 193203) are distinct from all other Amikoq samples in having relatively high TiO2 content although they are not restricted spatially. This group is evident in plots of trace elements vs. TiO2, where the elements covary, but at higher concentrations, relative to the rest of the complex (0.24–0.37 wt.% TiO2; Figs 4, 8–9, S8). They are characterised by unfractionated to slightly fractionated HREE (Dy/YbN: 0.92-0.99), LREE depletion (La/SmN: 0.55–0.71; except for sample 183101 with 1.32 and 1.39, respectively), and REE concentrations close to primitive mantle values (0.65–3.25 PM-normalised values). This suggest that these rocks cannot be considered simply as cumulates, and that they host a significant melt component. These samples generally overlap with komatiites in all element plots (Figs 4–5, 8–9, S8) and fall in-between komatiites from Belingwe and Munro (Sossi et al., Reference Sossi, Eggins, Nesbitt, Nebel, Hergt, Campbell, O'Neill, Van Kranendonk and Davies2016). This is well illustrated in their compatible element content where the five ultramafic samples have low V and Sc at high TiO2 resulting in high Ti/Sc (59–120) and Ti/V (13.3–21.1) ratios. Nickel is also high, especially in sample 183101, which overlaps with komatiites, whereas the other four samples are intermediate between the noritic rocks and komatiites (Fig. 9, S8). Accumulation of olivine + orthopyroxene + spinel cannot explain these rocks as all of their constituent minerals have <0.4 wt.% TiO2 (Aarestrup et al., Reference Aarestrup, Jørgensen, Armitage, Nutman, Christiansen and Szilas2020). It is only plausible to explain their Ni contents if significant amphibole accumulated, however this should result in high Sc contents as this element is compatible in amphibole (${\rm D}_{{\rm Sc}}^{{\rm Amp}/{\rm melt}}$ ≈ 1.6–9.5; Tiepolo et al., Reference Tiepolo, Oberti, Zanetti, Vannucci, Foley, Hawthorne, Oberti, Della Ventura and Mottana2007).
The primitive-mantle-normalised trace-element distribution pattern of ultramafic sample 191224 is essentially unity, which combined with low Sc and V (17.4 and 77.7 ppm) and high Ni and Cr (991 and 2489 ppm) contents results in this sample being similar to the previously discussed high-Ti ultramafic rocks. The high Ti/Sc (59.6) ratio makes it especially unlikely that this sample was formed by accumulation of orthopyroxene and/or amphibole, which appears to be the case for low-Ti ultramafic rocks with Ti/Sc ratios of 7.6–31.0 (Fig. 9, S8). The low TiO2 of sample 191224 (0.17 wt.%), together with the mostly flat trace-element distributon pattern suggests that it is similar to Barberton-type aluminium-undepleted komatiites (~0.2 wt.% TiO2; Sossi et al., Reference Sossi, Eggins, Nesbitt, Nebel, Hergt, Campbell, O'Neill, Van Kranendonk and Davies2016).
The elevated TiO2 contents distinguishes these samples from all other rocks of the complex and suggests that a melt of komatiitic affinity, distinct from the Amikoq noritic parental melt, was also present in the complex. This hypothesis is supported by the TiO2 content of orthopyroxene, which suggests two separate trends (Fig. 10). Nevertheless, the LREE-enriched nature of 183101 and intermediate Ni contents of the other high-Ti ultramafic rocks (relative to komatiites from the literature and estimated Amikoq noritic parental melt; Fig. 9) suggest that they are not pristine komatiites.
The Amikoq parental melt: Constraints from trace-element modelling
In the following, we model the trace-element systematics of the Amikoq layered complex in order to assess the petrogenesis of these rocks. We use two distinct approaches: (1) mixing models of melt and cumulus assemblages, and (2) assimilation fractional crystallisation (AFC) modelling. Full details of our modelling are provided in the Supplementary Materials and only the main conclusions are presented below.
Cumulate modelling
It is important to test whether the trace-element characteristics of the complex could be caused by cumulate processes, e.g. the U-shaped trace-element distribution pattern could in principle result simply from the accumulation of cumulus phases where the HREE-enrichment is caused by the preference for ferromagnesian minerals to incorporate the HREE (e.g. Kennedy et al., Reference Kennedy, Lofgren and Wasserburg1993; Stracke et al., Reference Stracke, Zindler, Salters, McKenzie, Blichert-Toft, Albarède and Grönvold2003), and the moderate LREE enrichment from the presence of small amounts of interstitial LREE-enriched trapped melt. We begin this investigation with simple end-member cumulate models for which three assumed melts are: boninitic, komatiitic and contaminated komatiite (siliceous high-Mg basalt) [i.e. the Amikoq noritic parental melt; high-Ti ultramafic sample 193203; and Mt. Hunt sample 331/626 of Sun et al., Reference Sun, Nesbitt, McCulloch and Crawford1989, respectively], which are mixed with cumulus minerals assumed to be in equilibrium with the respective melt. Though no single model reproduces the sample variation perfectly (see primitive-mantle-normalised models, Fig. S9) reasonable approximations are obtained (Fig. 11).
Cumulate models with trapped melt in chondrite-normalised trace-element distribution plots; primitive-mantle-normalised versions are available in Fig. S10. Preferred models are shown by black lines with filled black circles. The simple cumulate models assume a melt and a solid assemblage (the cumulus model) in equilibrium with this melt. Percentages for each model indicate the amount of trapped assumed melt (vol.%), i.e. in (a) ‘3%’ corresponds to 3% trapped melt of mafic host-rock melt (193150) and 97% solids composed of 95% olivine and 5% spinel. Three overall models were tested: a komatiite model melt (assumed as high-Ti ultramafic 193203), a siliceous high-Mg basalt (SHMB) melt (sample 331/626 of Sun et al., Reference Sun, Nesbitt, McCulloch and Crawford1989) and a boninite model (estimated Amikoq noritic parental melt (AN-1)) – plagioclase extraction was undertaken in some cases as indicated by ‘-20% pl’. (a) Dunite models. Melts involving a type of mafic host rock with small quantities of trapped liquid reproduce the observed rocks reasonably well. A SHMB model yields a much too high La/Sm ratio. (b) High-Ti ultramafic models. Trace-element concentrations are similar to both komatiite (e.g. Barberton, Belingwe) and the Amikoq noritic parental melt making cumulate models with these melts unviable. A close match is obtained using a ferromagnesian melt with some plagioclase fractionation. At appropriate HREE, a SHMB model has much too high LREE contents and La/Sm ratio. (c) U-shaped distribution patttern peridotite models. The AN-1 models reproduce the peridotites relatively well but require a large amount of trapped melt (~24–60%). Mafic host rock models hold some potential but require a slightly LREE-enriched melt. SHMB-models are too LREE enriched at appropriate HREE contents. (d) U-shaped distribution pattern orthopyroxenite models. No model reproduces the steep HREE and moderate LREE enrichment, but the best approximation is obtained from an AN-1 melt. SHMB model results are similar to (c). (e) Melanorite models. These samples probably reflect various stages of plagioclase removal, thus no single melt can reproduce these rocks. An Amikoq noritic parental melt with significant melt extraction is illustrated, and the overall pattern can be reproduced with various stages of plagioclase removal (0–80%) as indicated by dashed lines. (f) Norite models. The preferred model assumes accumulation of plagioclase with the indicated composition, corresponding to 5% equilibrium plagioclase crystallisation from AN-1, mixed with the same parent melt, which has undergone 60% plagioclase fractionation. The overall pattern is reproduced with some La-Ce discrepancy. An SHMB model (plagioclase assumed in equilibrium) cannot reproduce the norites. Partition coefficients are from: Chauvel and Blichert-Toft (Reference Chauvel and Blichert-Toft2001); Elkins et al. (Reference Elkins, Gaetani and Sims2008); McKenzie and O'Nions (Reference McKenzie and O'nions1991), Kennedy et al. (Reference Kennedy, Lofgren and Wasserburg1993) and the compilation of Pilet et al. (Reference Pilet, Baker, Müntener and Stolper2011). Other symbols as in Fig. 4.

The trace-element patterns of the dunites are apprioximated with ~80% accumulation of olivine and spinel (95:5) and ~20% interstitial melt assumed as the high-Ti ultramafic 193203. It is important to note that the relatively high concentration of HREE preclude an origin from Barberton aluminium-undepleted type komatiites, because these have very low trace-element concentrations.
The peridotites with U-shaped trace-element distributon patterns (191126, 12963, 191198, 193261, 183146) can be approximated by an olivine–orthopyroxene–spinel cumulate model (75:20:5) assuming both siliceous high-Mg basalt and Amikoq noritic parental type melt (Fig. 11). The boninitic Amikoq noritic parental melt model (~24–60% trapped melt) suitably reproduces the general trace-element pattern with a slight underestimation of the lightest REE, whereas the basalt model (~4% trapped melt) reproduces the LREE well but underestimates the HREE. No melts with LREE depletion or flat trace-element distributon patterns, e.g. komatiites, can reproduce those of the peridotites.
Orthopyroxenites with U-shaped trace-element distribution patterns (177425, −35, 191232) cannot be reproduced in a komatiitic parental melt model as they are too enriched, exemplified by supra-chondritic Lu for the orthopyroxenites relative to the approximately chondritic Lu in aluminium-undepleted Barberton komatiite (Sossi et al., Reference Sossi, Eggins, Nesbitt, Nebel, Hergt, Campbell, O'Neill, Van Kranendonk and Davies2016). Close approximations are obtained in an orthopyroxene–amphibole cumulate model (95:5) with an Amikoq noritic parental melt (~42–60% trapped melt). The distinct negative Sr-anomalies may require plagioclase extraction from this melt, which results in higher overall trace-element abundances, and in lower amounts of estimated trapped melt (~24–40%, Fig 11).
As previously noted, the high-Ti ultramafic rocks share many characteristics with komatiites. However, an alternative hypothesis is that they represent cumulates associated with a magma similar to that which formed the mafic host rocks to the complex. Support for this scenario is seen in the slight negative Sr-Eu anomalies, suggestive of minor plagioclase fractionation, and the weakly subchondritic Gd/YbN (0.80–0.86) ratios. Plagioclase is not expected to fractionate from a primitive komatiite and the rocks can more easily be reconciled with a ferromagnesian melt. Furthermore, both the forsterite and the Ni content of olivine of the Western Margin peridotite (Fo82–85, 1620–2330 ppm; Aarestrup et al., Reference Aarestrup, Jørgensen, Armitage, Nutman, Christiansen and Szilas2020) is significantly lower than expected for average komatiite olivine (Fo89, 3400 ppm Ni; Arndt, Reference Arndt1994). Using ${\rm D}_{\rm Ni}^{{\rm ol}/{\rm melt}}$ ≈ 8 (Canil and Fedortchouk, Reference Canil and Fedortchouk2001) would yield a melt Ni content of ~200–290 ppm consistent with that of some of the host rocks (Table S1). However, recent modelling of olivine crystallising from high-MgO melts (20–30 wt.% of primary melt; Herzberg, Reference Herzberg, Vidito and Starkey2016) suggest that the West Margin Fo-Ni content of olivine could be consistent with crystallisation from a komatiite liquid, as could most olivine from ultramafic complexes of the Fiskefjord region (Fig. S11; Szilas et al., Reference Szilas, Kelemen and Bernstein2015a, Reference Szilas, van Hinsberg, McDonald, Næraa, Rollinson, Adetunji and Bird2018; Guotana et al., Reference Guotana, Morishita, Yamaguchi, Nishio, Tamura, Tani, Harigane, Szilas and Pearson2018; Nishio et al., Reference Nishio, Morishita, Szilas, Pearson, Tani, Tamura, Szilas and Guotana2019).
To model the melanorites, plagioclase is extracted from Amikoq noritic parental melt (Fig. 6) using Rayleigh fractionation. However, this does not imply that plagioclase was the only liquidus phase, and is merely undertaken to simulate plagioclase extraction. The various samples probably reflect various stages of plagioclase removal and fractionation steps of 40–60–80% have been modelled. This large range in fractionation results in an equally large estimate of trapped melt ranging from 5% to 100%, where the cumulate assemblage is modelled as orthopyroxene with subordinate plagioclase and amphibole (80:10:10). The resulting model reproduces the melanorite trace-element distribution pattern well, although minor deviations are evident, such as the absence of Zr and Ti anomalies. The Ti anomaly could be remedied by minor Fe–Ti oxide fractionation.
Some norites have relatively high trace-element concentrations relative to the Amikoq noritic parental melt, implying an overall more evolved melt composition that is approximated here as this melt after 60% fractional crystallisation of plagioclase. Such a scenario could be related physically to the local expulsion of the crystallising melt and seems to have been a more random or episodic process, judging from the large range in La/Nb, La/SmN and SiO2–TiO2 ratios of norites relative to the systematic trend and limited range in melanorites (Figs 8, 9, S8). To simulate plagioclase aggregation, a plagioclase composition is assumed as the bulk composition of solids after 5% equilibrium plagioclase crystallisation from an unfractionated Amikoq noritic parental melt. A solid composition equal to 40% equilibrium crystallisation of plagioclase will result in models with slightly higher maximum La/Nb ratios (9.8 vs. 7.7) at 50% trapped melt. The 5% equilibrium plagioclase best reproduces the Eu-Sr anomalies. These models reproduce the composition of the norites well with a trapped melt range of ~5–50%, although the La/SmN ratio is slightly underestimated in the most trace-element enriched norites owing to the slight La-Ce depletion of the assumed plagioclase-fractionated trapped noritic parental melt.
AFC modelling
The cumulate-liquid mixing models presented above might not be able to reproduce the expected variation resulting from crustal contamination of a komatiite. To test this scenario, we model contamination of a Barberton-type komatiite with a flat REE distribution pattern (Sossi et al., Reference Sossi, Eggins, Nesbitt, Nebel, Hergt, Campbell, O'Neill, Van Kranendonk and Davies2016) by an average Akia tonalite (Gardiner et al., Reference Gardiner, Kirkland, Hollis, Szilas, Steenfelt, Yakymchuk and Heide-Jørgensen2019; Table S2, Fig. S9) using an assimilation-fractional crystallisation (AFC) model (DePaolo, Reference DePaolo1981). This model is essentially identical to the petrogenesis proposed for Precambrian siliceous high-Mg basalt petrogenesis (Sun et al., Reference Sun, Nesbitt, McCulloch and Crawford1989), and implies that the LREE enrichment and the negative Nb-anomaly are derived from contamination of the komatiite.
Here we use the average tonalite (Tabel S2) as a proxiy for a crustal contaminant and note the similarity to the Bushveld B-1 and siliceous high-Mg basalt (Fig. S9). The systematic behaviour of the noritic lithologies in terms of La/SmN, Dy/YbN, Sc/Y and La/Nb ratios suggests that these are undisturbed by metamorphism and reflect magmatic processes. Furthermore, these ratios span the entire trace-element spectrum from the very incompatible elements (La/Nb) to least incompatible (Sc/Y, Dy/Yb), whereas Sc is also an important element in distinguishing komatiite from contaminated komatiite and in boninite petrogenesis (e.g. Crawford et al., Reference Crawford, Falloon, Green and Crawford1989; Sun et al., Reference Sun, Nesbitt, McCulloch and Crawford1989). Consequently, these ratios plotted against each other and against Sm, Yb, Sc and Nb are used to test the AFC scenario. The modelled melt is then mixed with equilibrium cumulate olivine–orthopyroxene–spinel (75:20:5) in a peridotitic model (Fig. 12) and plagioclase–orthopyroxene (60:40) in a noritic model (Fig. 13). AFC melt evolution (red lines) are shown for r values of 0 to 0.3 (unless otherwise indicated). Green, grey and dark red curves correspond to olivine, plagioclase and orthopyroxene compositions in equilibrium with the red melt evolution curves, whereas the purple curves represent the bulk crystals in equilibrium with the red melt curves. The blue evolution curves are cumulate models showing 1 or 10 vol.% trapped melt (light blue) and 15 or 40 vol.% trapped melt (dark blue), depending on cumulate model, demonstrating the effect of trapped melt shift (Figs 12, 13).
Assimilation and fractional crystallisation (AFC) and cumulate models involving a Barberton komatiite (Sossi et al., Reference Sossi, Eggins, Nesbitt, Nebel, Hergt, Campbell, O'Neill, Van Kranendonk and Davies2016) and average Akia tonalite (Gardiner et al., Reference Gardiner, Kirkland, Hollis, Szilas, Steenfelt, Yakymchuk and Heide-Jørgensen2019) contaminant. The fractionating assemblage is assumed (in vol.%) as 75% olivine, 20% orthopyroxene and 5% spinel. Red lines are melt evolution trends at various r-values (0.1, 0.2, 0.3), black are Rayleigh fractional crystallisation (r = 0), blue lines are cumulate models (75% olivine, 20% orthopyroxene, 5% spinel) with 1% (light blue) and 15% (dark blue) trapped melt. Increments correspond to 10%. Equilibrium minerals are shown together with equilibrium bulk solids (purple). (a) Chondrite normalised Dy/Yb vs. La/Sm. (b) La/Nb vs. La/Sm. (c) Dy/YbN vs. Sc/Y. (d) La/Nb vs. Nb (ppm). The modelling demonstrates that the Amikoq noritic parental melt composition cannot be obtained using AFC models. Supporting plots in Fig. S12. Partition coefficients are from: Chauvel and Blichert-Toft (Reference Chauvel and Blichert-Toft2001); Elkins et al. (Reference Elkins, Gaetani and Sims2008); McKenzie and O'Nions (Reference McKenzie and O'nions1991); Kennedy et al. (Reference Kennedy, Lofgren and Wasserburg1993). Other symbols and references as in Figs 4, 5, 9.

AFC and cumulate models involving boninitic Amikoq noritic parental melt and island-arc-tholeiite (Todd et al., Reference Todd, Gill and Pearce2012) contaminants. Fractionating assemblage (in vol.%) is assumed as 60% plagioclase and 40% orthopyroxene. Red lines are melt evolution trends at various r-values (0.2, 0.5, 0.7), black are Rayleigh fractional crystallisation (r = 0), blue lines are cumulate models (60% plagioclase, 40% orthopyroxene) with 15% (light blue) and 40% (dark blue) trapped melt. Increments correspond to 10%. Equilibrium plagioclase (grey) and orthopyroxene (dark red) are shown as well as equilibrium bulk solids (purple). (a) Chondrite normalised Dy/Yb vs. La/Sm. b) La/Nb vs. La/Sm. (c) Dy/YbN vs. Sc/Y. (d) La/Nb vs. Nb (ppm). La enrichment (high La/Sm, La/Nb) in norites is a consequence of plagioclase accumulation; norites from SM require a larger orthopyroxene component than modelled here. The melt-dominated melanorite trend prohibits contamination from felsic crust (tonalite, dacite) and requires contribution from a high-La/Nb, island-arc-tholeiite-like component. Some melanorites may be related to mineral accumulation with a significant trapped melt component (dark blue lines, or higher trapped melt degree). Supporting plots are available in Fig. S13. Partition coefficients are from McKenzie and O'Nions (Reference McKenzie and O'nions1991) and the compilation of Pilet et al. (Reference Pilet, Baker, Müntener and Stolper2011). Other symbols and references as in Figs 4, 5, 9.

In general, all of the trace-element characteristics of most peridotites can be reasonably well reproduced. Dy/YbN ratios in the modelled melt remain essentially uniform at chondritic values and contamination of komatiite has next to no effect on the HREE distribution (Fig. 12). The three peridotites with highest La/SmN ratios with a La/Nb ratio of ~1 must have inherited these characteristics from their parent melt, as must the low-La/Nb ratio dunites (~0.5), provided they are undisturbed. Because any plausible LREE-enriched contaminant available at the time have markedly elevated La/Nb ratios (Figs 12, S9), it can be inferred that peridotites with La/Nb ratios of ~1 were only contaminated negligibly, if at all. This observation supports the presence of uncontaminated high-Mg compositions as parental to at least some peridotites.
Additional insights are gained from modelling the systematic trends of the noritic lithologies (Figs 13). Even though the general shape of the melanorite trace-element distribution pattern can be reasonably approached by the simple cumulate model described above using the Amikoq noritic parental melt, it is actually difficult to reproduce the trend towards higher Dy/YbN–lower La/SmN ratios by simple fractionation and accumulation, because of the modelled equilibrium plagioclase (ratios of ~1.3 and ~4.4, respectively) and orthopyroxene (~0.3 and ~0.3, respectively). Significant plagioclase extraction (+ subordinate orthopyroxene) from the parental melt will result in a decrease in both ratios whereas accumulation of orthopyroxene would have the same effect. This could in part be caused by the partition coefficients used given that the depressed La–Ce–Pr abundances of the melanorites are not perfectly reproduced from 40–80% plagioclase extraction.
Because the melanorites were probably dominated by a melt component, as suggested by REE vs. TiO2 variations (Figs 8, S8), such trends could be indicative of contamination or mixing with a melt. The slightly elevated La/Nb ratio of the melanorites indicate a high La/Nb ratio for the melt/contaminant, and unlike MORB (~1). Thus, the best fit is obtained with an island-arc-tholeiite type of composition which generally mimics MORB but possess high La/Nb ratios (>4; Todd et al., Reference Todd, Gill and Pearce2012). This model generally well reproduces the melanorite trend (Fig. 13), assuming a crystallising assemblage consisting of plagioclase and orthopyroxene (60:40).
This model reproduces the norites as dominantly plagioclase-orthopyroxene cumulates with the amount of trapped interstitial melt ranging from 0 to 40 vol.%, even though a slightly lower Dy/YbN ratio for the plagioclase seems to be required (Fig. 13). In this model, the lower La/SmN and higher Sc/Y ratios of the South Margin norites require a larger contribution from cumulus orthopyroxene relative to the West Margin norites, which seem to be dominated by plagioclase. A lower orthopyroxene content in West Margin norites might reconcile the lower Cr–Ni–MgO contents of these samples (Fig. 4). Input of an island-arc-tholeiite-like melt/contaminant helps explain the abundance of plagioclase, which only becomes a liquidus phase in the more evolved boninites (Taylor et al., Reference Taylor, Nesbitt, Vidal, Harmon, Auvray and Croudace1994; Van der Laan et al., Reference Van der Laan, Arculus, Pearce and Murton1992). A contribution from island arc tholeiite could have changed the melt composition towards the plagioclase stability field, resulting in the abundance of this phase (e.g. Van der Laan et al., Reference Van der Laan, Arculus, Pearce and Murton1992). We conclude that the high La/SmN and La/Nb ratios of the norites are not melt signatures and have been artificially elevated as a result of plagioclase accumulation. Consequently, we urge caution in interpreting extreme La/Sm and La/Nb ratios in plagioclase-rich rocks as direct evidence for subduction environments. Similarly, Th/Yb and Nb/Yb relationships (Fig. S14) are not able to distinguish between primary subduction signatures and contamination trends (e.g. Li et al., Reference Li, Arndt, Tang and Ripley2015).
Aarestrup et al. (Reference Aarestrup, Jørgensen, Armitage, Nutman, Christiansen and Szilas2020) reported compositional data for three samples from the margins of the ultramafic body at West Margin, which range from dunitic/harzburgitic to orthopyroxenite with increases in forsterite (Fo82.5 → Fo84.5) and enstatite (En82.5 → En84 → En85) content towards the margin. These data might indicate that the peridotite was replaced by interaction with a high Si–Mg melt, such as the Amikoq noritic parental melt, as has been postulated for the Chilas Complex, Pakistan, i.e. melt + olivine → pyroxenes (Jagoutz et al., Reference Jagoutz, Müntener, Burg, Ulmer and Jagoutz2006), although the parental melt and resulting melt reaction was markedly different. This process suggests an alternative origin for the trace elemental similarities between the noritic rocks and some ultramafic rocks. The positive Zr anomalies of some ultramafic samples might have been inherited from such a melt–rock reaction (Fig. 5).
The position of the Amikoq Layered Complex in the Archean geotectonic jigsaw puzzle
Mantle potential temperatures were higher in the early Earth, culminating in the Archean, yielding a higher melt output from ambient mantle resulting in MgO-rich primary basalts (18–24 wt.%) and a considerably thicker oceanic crust (~25–35 km) relative to today, with a complementary harzburgitic restitic mantle (Herzberg et al., Reference Herzberg, Condie and Korenaga2010). This may have resulted in long-lived thick basaltic crust prior to the stabilisation of true modern style subduction zones considered to have been present since c. 2.5 Ga (Bédard, Reference Bédard2018; Sizova et al., Reference Sizova, Gerya, Brown and Perchuk2010). Recent zircon Hf-isotope data from the felsic constituents of Akia reveal a contribution from Eoarchean mafic components supporting a long-lived, mafic crust in the Archean geological history of Akia (Gardiner et al., Reference Gardiner, Kirkland, Hollis, Szilas, Steenfelt, Yakymchuk and Heide-Jørgensen2019) with a complementary dunitic and harzburgitic subcontinental lithospheric mantle (Bernstein et al., Reference Bernstein, Kelemen and Hanghøj2007; Reference Bernstein, Szilas and Kelemen2013). The occurrence of highly refractory cumulative ultramafic complexes in Akia (Szilas et al., Reference Szilas, Kelemen and Bernstein2015a) may suggest a role for a high-Mg melt, possibly komatiitic (Szilas et al., Reference Szilas, van Hinsberg, McDonald, Næraa, Rollinson, Adetunji and Bird2018). In this regard, the boninitic Amikoq noritic parental melt could be the result of the subcontinental lithospheric mantle melting in conjunction with plume impingement (Pearce and Reagan, Reference Pearce and Reagan2019), although it should be noted that komatiites sensu stricto are so far unknown from the North American Craton (Szilas et al., Reference Szilas, Næraa, Scherstén, Stendal, Frei, van Hinsberg and Rosing2012a, Reference Szilas, van Hinsberg, McDonald, Næraa, Rollinson, Adetunji and Bird2018).
In contrast, several studies have highlighted that many rock associations of the North American Craton display structural and geochemical features typically associated with subduction zones (Garde, Reference Garde1997, Reference Garde2007; Klausen et al., Reference Klausen, Szilas, Kokfelt, Keulen, Schumacher and Berger2017; Polat et al., Reference Polat, Wang and Appel2015; Steenfelt et al., Reference Steenfelt, Garde and Moyen2005; Szilas et al., Reference Szilas, Hoffmann, Scherstén, Rosing, Windley, Kokfelt, Keulen, van Hinsberg, Næraa, Frei and Münker2012b, Reference Szilas, Tusch, Hoffmann, Garde and Münker2017; Van Hinsberg et al., Reference Van Hinsberg, Crotty, Roozen, Szilas and Kisters2018). Although the host rocks of the Amikoq are ambiguous with respect to their geochemistry and cannot be used in conjunction with the boninitic Amikoq noritic paretal melts to infer a complete supra-subduction scenario (Whattam and Stern, Reference Whattam and Stern2011), the complex itself might reflect a subduction initiation system, in accord with the requirement for a high-La/Nb of island arc tholeiite-like contaminant. However, it is possible that the host rocks and the complex are temporally distinct, and thus not necessarily part of the exact same magmatic system.
It has been argued that the subcontinental lithospheric mantle of the North American Craton formed by subduction stacking processes (Tappe et al., Reference Tappe, Smart, Pearson, Steenfelt and Simonetti2011; Wittig et al., Reference Wittig, Pearson, Webb, Ottley, Irvine, Kopylova, Jensen and Nowell2008). Detailed investigations of the >3 Ga Tartoq greenstone belt in the southern parts of the craton support this scenario, where a shallow trend in P–T–t space towards granulite facies is in marked contrast to modern high-P eclogite facies trends (Van Hinsberg et al., Reference Van Hinsberg, Crotty, Roozen, Szilas and Kisters2018; Palin et al., Reference Palin, Santosh, Cao, Li, Hernández-Uribe and Parsons2020). Thus, rather than representing a modern-style subduction initiation, the Amikoq Layered Complex might reflect an Archean equivalent involving subduction abortion and stacking. Pearce et al. (Reference Pearce, van der Laan, Arculus, Murton, Ishii, Peate and Parkinson1992) argued that the boninite-source metasomatising agent was derived from a partial melt originating from the mafic subducting slab. If plausible, it may be relevant to note the close similaritites of the distribution patterns of the most incompatible elements of the Amikoq noritic parental melt and average Akia tonalite (Figs S9, S14) considering that these tonalities are thought to be derived from partial melting of mafic crust (Steenfelt et al., Reference Steenfelt, Garde and Moyen2005; Yakymchuk et al., Reference Yakymchuk, Kirkland, Hollis, Kendrick, Gardiner and Szilas2020; Gardiner et al., Reference Gardiner, Kirkland, Hollis, Szilas, Steenfelt, Yakymchuk and Heide-Jørgensen2019).
Conclusions
The >3 Ga Amikoq Layered Complex is composed principally of primitive hornblende-plagioclase-orthopyroxene rocks ranging from leuconorite to orthopyroxenite with subordinate ultramafic bodies consisting of dunite-harzburgite-orthopyroxenite, all of which intruded mafic host rocks with island-arc-like characteristics. The following can be concluded, on the basis of our current geochemical data:
The absence of Sr-Eu anomalies combined with overall low Mg# (50.6–75.5) of the mafic host rocks, signify that they are not co-magmatic with the complex.
Trace-element modelling suggests that the mafic host rocks could have suffered melt extraction during regional granulite-facies metamorphism, thus potentially compromising their trace-element characteristics.
Orthopyroxene compositional data and absence of olivine-plagioclase lithologies indicate that at least some of the ultramafic rocks might be unrelated to the noritic sequences. Some ultramafic samples have trace-element characteristics distinct from the noritic rocks, although this may be due to overprinting caused by melt–rock reactions.
Anorthite-rich (An83–91) plagioclase-rich, clinopyroxene-absent rocks with late-stage igneous hornblende suggest shallow crystallisation (≤5 kbar) of a hydrous, clinopyroxene-undersaturated melt.
Positive Sr-Eu anomalies and slightly elevated La–Ce abundances of the norites, relative to negative Sr-Eu anomalies and fractionated La–Ce in melanorites demonstrate a co-magmatic relationship and that plagioclase was extracted from the melanorites and now reside in the norites.
The highly systematic trace-element patterns of the noritic rocks allow the characterisation of their parental melt as a primitive (Mg#: 83.5, 310 ppm Ni, 1800 ppm Cr) boninite-like melt, referred to here as the Amikoq noritic parental melt, characterised by a U-shaped trace-element distribution pattern (La/SmN: 1.74, Dy/YbN: 0.73), high Sc (Sc/Y: 8.0) and low TiO2 (0.14 wt.%, Al2O3/TiO2: 64).
Comparison to siliceous high-Mg basalts and komatiites demonstrates that the parental liquid of the complex cannot be reconciled with either of these, nor a contaminated komatiite origin, as shown by AFC modelling. Modelling does require the Amikoq noritic parental melt to be contaminated/mixed with a basalt of island arc tholeiite-like affinity.
Although some ultramafic samples with U-shaped trace-element distribution patterns could be related to the Amikoq parental melt, samples with relatively flat distribution patterns and high trace-element concentrations seem either to have an origin as subvolcanic komatiite or as cumulates associated with melts similar in character to the mafic host rocks.
Acknowledgements
We are grateful for two thorough reviews that provided constructive critique, which helped to restructure and condense the original manuscript. This study was funded by VILLUM FONDEN through Grant VKR18978 awarded to Kristoffer Szilas.
Supplementary material
To view supplementary material for this article, please visit https://doi.org/10.1180/mgm.2021.44.