On September 26, 2024, Hurricane Helene made landfall in Florida as a Category 4 storm. By September 27, the storm had cut a path through Georgia and into Western North Carolina. The combination of the record rains meeting the steep slopes of the Appalachian Mountains led to catastrophic flooding, power outages, property damage, and at least 108 deaths in Western North Carolina (North Carolina Department of Health and Human Services 2025). It was the worst storm to hit the region in at least 100 years (Chernikoff, Borresen, and Leyva Reference Chernikoff, Borresen and Leyva2024).
The timing of the storm coincided with the 2024 presidential election. North Carolina sent out ballots on September 20 – among the earliest states in the country to do so. Early in-person voting was set to begin October 17 and close on November 2. Election Day was set for November 5.
The confluence of the hurricane with the election raised questions for election administrators and voters, including: (1) would Helene cause voters to be displaced? (2) would Helene negatively affect voter turnout? and (3) would Helene cause voters to alter their methods of voting? By comparing the Helene-affected counties to the remainder of counties in North Carolina between 2012 and 2024, this paper examines how the storm affected voter turnout, voting methods, and voter displacement. The difference-in-differences (DiD) analysis reveals remarkably stable voting patterns, despite evidence of significant displacement. These results suggest that voter-centric administrative decisions combined with local implementation can blunt the negative effects of natural disasters on voter participation and election administration.
Disasters, voting, and election administration
Major disasters that occur during the administration of an election could disrupt the electoral process in a few key ways. For example, communication is often disrupted during a natural disaster. Cellular phone networks may go down or get overloaded, and internet access may also be reduced or eliminated, making information about elections, including site placement, dates, and other administrative details more difficult to find. Candidates and third-party groups may also have less success reminding citizens to vote. Those get-out-the-vote reminders can be critical to voter turnout (Green and Gerber Reference Green and Gerber2024).
Barriers to voting during a disaster are not limited to communication. Depending on the disaster, transportation may be disrupted, voting sites may change and the “cost” of voting may be higher for both voters and election administrators. And, of course, voters themselves may be temporarily or permanently displaced, making elections less salient and less convenient for those affected.
Given the rise in the cost of voting after a disaster, it should not be surprising that a number of studies have provided empirical evidence that disasters do affect voter behavior. For example, Zelin and Smith (Reference Zelin and Smith2023) found that Hurricane Michael depressed in-person voter turnout in affected Florida counties, although voters partially compensated by choosing other voting methods. Stein (Reference Stein2015) came to similar conclusions in a study of Hurricane Sandy. According to both studies, a key to understanding the effects of a disaster on turnout is whether election administrators and voters have time to adjust and make a different voting plan.
While most evidence suggests that disasters depress voter turnout and disrupt normal elections, their variable nature combined with their potential to increase social capital and feelings of connectedness (Aldrich Reference Aldrich2012) means that sometimes disasters may not depress turnout. For example, Bodet, Thomas, and Tessier (Reference Bodet, Thomas and Tessier2016) find that a 2013 flood in the city of Calgary had no effect on turnout. Lasala-Blanco, Shapiro, and Rivera-Burgos (Reference Lasala-Blanco, Shapiro and Rivera-Burgos2017) also found no evidence that Hurricane Sandy depressed voter turnout in 2012, contrary to Stein (Reference Stein2015).
Employing a novel design using rainfall as the primary indicator of impact, Morris and Miller (Reference Morris and Miller2023) found no effect of Hurricane Michael itself on turnout, although administrative changes, including polling place closures, did negatively impact voter turnout. Similarly, Morris and Miller (Reference Morris and Miller2022) found that consolidating polling locations after Covid-19 in 2020 negatively affected voter turnout. Both papers highlight the importance of administrative decisions in affecting voter turnout. Along the same vein, thanks to effective and proactive administrative changes, the February 2023 earthquake in Turkey produced “fifty-four thousand deaths, zero electoral impact” (Demirdogen and Olhan Reference Demirdogen and Olhan2025).
Counterintuitively, there is even some evidence that disasters can increase voter turnout. For example, citizens who experienced the worst flooding during Hurricane Katrina were more likely to vote in a subsequent mayoral election – presumably because Katrina made voters more aware of the effects of local government action (or inaction) on their lives (Sinclair, Hall, and Alvarez Reference Sinclair, Hall and Alvarez2011).
Beyond aggregate turnout effects, disasters can displace voters from their communities (Zetter and Boano Reference Zetter, Boano, Lizarralde, Johnson and Davidson2009). While displacement may not necessarily depress overall turnout if voters can update their registration or vote absentee, it imposes costs on both voters and administrators and may affect where and how votes are cast. Unfortunately, the evidence on displacement is scant because measuring displacement is often difficult; most administrative data does not track voters’ physical locations after disasters.
These mixed findings suggest that not all disasters have the same effects on elections. Election salience appears particularly important. Presidential elections, which usually come with higher turnout and stronger voter motivation, may be less likely to experience turnout decline than lower-salience contests. The timing also matters, as longer gaps between the disaster and the election allow for greater recovery. Finally, proactive changes to election administration can mitigate disaster-induced disruption, while negative institutional changes, or lack of institutional response altogether, can lead to lower turnout and greater disruption to normal election processes.
The case of Hurricane Helene in North Carolina can help tease out the effects of both timing and administrative changes. As the next section of the paper discusses, Helene struck during the administration of an election and brought massive destruction, but election administrators and state officials did respond proactively.
Helene and the case of North Carolina in 2024
Election administration in North Carolina is conducted by 100 county boards of elections and a state board of elections – all 101 of which have five members. At the time of the 2024 election, all county boards and the state board of elections were made up of three Democrats and two Republicans. These boards oversee an election system that offers citizens three ways to vote – in-person on Election Day, in-person early voting, and mail voting. In-person early voting has become the most popular way to cast a vote in North Carolina, followed by in-person on Election Day, and mail voting (Cooper Reference Cooper2024a).
The 2024 election in North Carolina was expected to have close margins and high turnout – increasing the attention on election administration and election administrators. The state was once again considered a battleground at the presidential level. The 2024 ballot also included a highly salient gubernatorial election, nine other statewide Council of State elections, elections for all 170 state legislative races, all 14 congressional districts, a smattering of local municipal and county elections, and a state supreme court election that would not be decided until six months after Election Day.Footnote 1
Western North Carolina, which experienced the greatest setbacks from Hurricane Helene, is a mountainous region comprised largely of rural counties that have tended to support the Republican Party in recent elections. While the majority of the region’s voters favor the Republicans, there are a few pockets of Democratic strength including Buncombe County (Asheville) and Watauga County (Boone) – both of which gave the majority of their votes to the Democratic candidates for president in 2020 and 2024 (Cooper Reference Cooper2024b).
As a result of the competitive environment, when Hurricane Helene swept through North Carolina in late September, attention soon turned to elections and election administration. The 39-day gap between the hurricane (September 26–27) and Election Day (November 5) allowed time for emergency administration changes. The timing meant that early voting – which began 20 days after the storm – occurred during recovery efforts. This unique timing distinguishes Hurricane Helene from disasters that occurred immediately before election day, where election officials were unable to adjust, or ones that occurred prior to ballots being mailed, which allowed for administrative changes before ballots were sent or returned.
The North Carolina State Board of Elections (NCSBE) passed emergency measures affecting 13 counties in Western North Carolina “where infrastructure, accessibility to voting sites, and postal services remain severely disrupted after Helene.” The NCSBE allowed election officials in those 13 counties to alter early and Election Day voting sites, extended the absentee ballot request deadline to the day before the election, permitted voters to return ballots to any county board in the state, relaxed poll worker residency requirements, gave multipartisan assistance teams increased flexibility, and required coordination with the North Carolina Division of Emergency Management (NCSBE 2024). The list of changes was extensive and, at least from the perspective of election administrators, enabled them to meet the needs of voters affected by this catastrophic storm (Bell Reference Bell2026; Cooper et al. Reference Cooper, Adams, Anderson, Bamodu, Guyer, Johnson, Kish, Morgan, Robinson, Rogers, Speier and Sweeney2026; Duncan Reference Duncan2025).
Despite the extensive positive administrative changes in response to Helene, Branton et al. (Reference Branton, Kropf, Herron, Sledge and Thomas2026) find that people who reported greater damage from Hurricane Helene were less likely to believe that their vote would be counted. This is consistent with work in Chile finding that disasters can reduce trust in the electoral system writ large (Carlin, Love, and Zechmeister Reference Carlin, Love and Zechmeister2014). Given that people with less confidence in elections are less likely to vote, the administrative changes might not fully offset the negative effects of Helene on electoral participation.
These 13 counties that were included in the NCSBE order make up the core of the analysis in this paper. While the Federal Emergency Management Agency included a much broader range of counties (25 in total) in its disaster designation (FEMA 2024), the 13-county definition of Helene impact represents the areas that were allowed to make election modifications – modifications that were intended to mute the negative effects of the storm on democratic participation. These counties are Ashe, Avery, Buncombe, Haywood, Henderson, Madison, McDowell, Mitchell, Polk, Rutherford, Transylvania, Watauga, and Yancey.
North Carolina provides an ideal setting for examining disaster impacts on elections. As Nicholson-Crotty and Meier (Reference Nicholson-Crotty and Meier2002) argue, single-state designs are valuable when the state’s features make it a good test case. North Carolina’s combination of competitive elections, professionalized election administration, and multimodal voting system represent conditions under which we would most expect administrative resilience to matter.
Questions
This paper asks three related but distinct questions regarding the impact of Hurricane Helene on the 2024 election.
First, did Hurricane Helene result in greater than normal voter displacement in the affected counties? While this has been a more difficult question to pin down in the past, the NCSBE maintains data on the street address where mail ballots are sent, allowing us to determine whether the storm caused more ballots to be mailed out of state.
Second, did Hurricane Helene reduce voter turnout in the affected counties? While logic would imply that the physical and psychological toll of the storm would cause a decrease in voter turnout, the literature reviewed above is fairly mixed, with some studies showing clear decreases in turnout following a disaster that is proximate to the election and others demonstrating that administrative decisions are able to mute the effects of a disaster.
Third, did Hurricane Helene cause voters in the affected counties to alter their mode of voting? Given that the storm displaced thousands of voters and interrupted the routine of many others, we would expect that voters in the affected counties would be more likely to gravitate to mail or early voting where they would have more flexibility in when and where they cast their vote (see, for example, Zelin and Smith Reference Zelin and Smith2023).
Data and methods
To answer these questions, this paper employs a DiD design using administrative data from the NCSBE for presidential elections from 2012 to 2024. All data are measured at the county level and include (1) turnout rates (votes/active + inactive registered voters), (2) rates of usage for mail, in-person and Election Day voting, (3) the percent of mail ballots sent out of state, and (4) the percent of mail ballots sent out of the voter’s home ZIP code for all 100 North Carolina counties across four election cycles. The out-of-state and out-of-ZIP mail ballot measures serve as proxies for disaster-induced displacement, capturing voters who relocated following the hurricane. This ZIP code-based measure attempts to capture displacement that did not cross state lines.Footnote 2 This measure follows the logic of Meredith and Kronenberg’s (Reference Meredith and Kronenberg2023) four-outcome classification of mail-ballot destinations, which distinguishes among the locations to which ballots are sent. It is less sensitive than the out-of-state measure to where in the state a voter resides, since out-of-state displacement is mechanically easier to observe near state borders.
The treatment variable equals 1 for observations in the 13 Hurricane Helene-affected counties in 2024, and 0 otherwise. Control counties comprise the 87 North Carolina counties not directly affected by the hurricane. This design is frequently used to answer causal questions such as the one offered here. Before proceeding with the analysis, however, one must demonstrate that the treated and control cases were similar prior to the intervention – what is known as the parallel trends assumption.
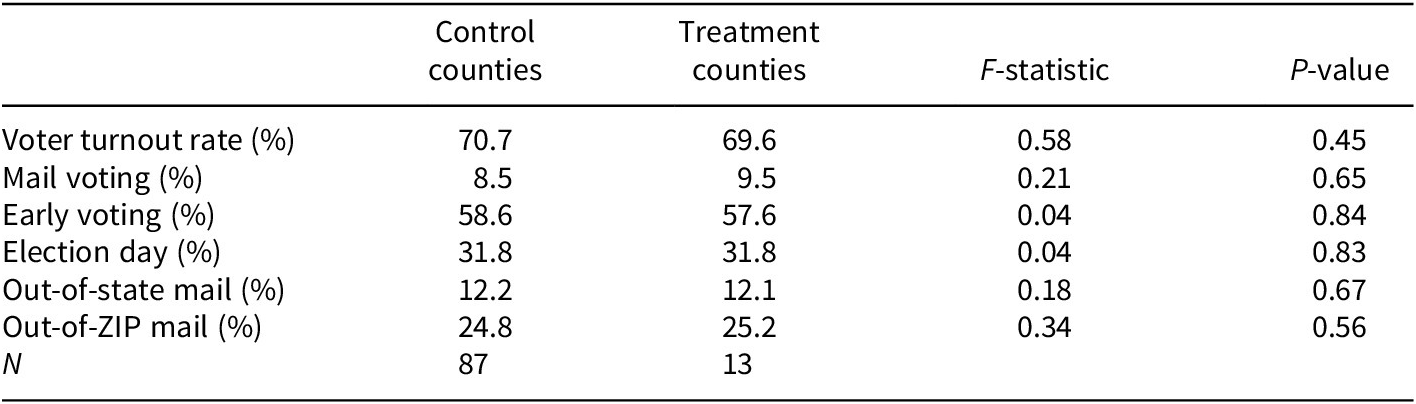
As an initial cut at the parallel trends question, Table 1 presents descriptive data on each outcome variable for the control and treatment groups in the first two columns of data. By simply comparing the means of each group it appears the treated and control counties were largely similar prior to the 2024 election. This is suggestive but not conclusive evidence that the parallel trends assumption is met. The next two columns (F statistic and p value) represent the results of a series of models where the outcome is regressed on the interaction of treatment status with a linear time trend, controlling for county and year fixed effects. A statistically significant F-statistic would indicate differential pretrends (2012–2020), violating the parallel trends assumption. What we see in this case, however, is a series of non-statistically significant findings, providing further evidence that the treated and control counties were statistically indistinguishable prior to 2024. In other words, the parallel trends assumption is met and the DiD approach is the proper one.
Testing parallel trends, 2012–2020

Table 1. Long description
The table contains five columns: Variable, Control counties, Treatment counties, F-statistic, and P-value.
* Voter turnout rate (percent): Control 70.7, Treatment 69.6, F-statistic 0.58, P-value 0.45.
* Mail voting (percent): Control 8.5, Treatment 9.5, F-statistic 0.21, P-value 0.65.
* Early voting (percent): Control 58.6, Treatment 57.6, F-statistic 0.04, P-value 0.84.
* Election day (percent): Control 31.8, Treatment 31.8, F-statistic 0.04, P-value 0.83.
* Out-of-state mail (percent): Control 12.2, Treatment 12.1, F-statistic 0.18, P-value 0.67.
* Out-of-Z I P mail (percent): Control 24.8, Treatment 25.2, F-statistic 0.34, P-value 0.56.
* N (sample size): Control 87, Treatment 13.
Although the treatment occurs in a single election year, careful delineation of the counties covered by the NCSBE emergency order, clear pre-treatment parallel trends, and placebo tests (as will be explained) reduce concerns that the results are driven by idiosyncratic features of the 2024 election rather than the hurricane itself.
Results
Voter displacement
While previous research can identify the turnout effects of disasters, evidence on displacement is more limited, since it is often hard to track where individual voters go after a disaster. Individual level data maintained by the NCSBE, however, allows us to identify the address where mail ballots were sent.Footnote 3 By using the DiD design described previously, it is possible to identify whether the counties affected by Hurricane Helene experienced punctuated increases in the number of ballots sent out of state. Results are presented visually (see Figure 1) and then in a table summarizing results from the more rigorous multivariate analysis.
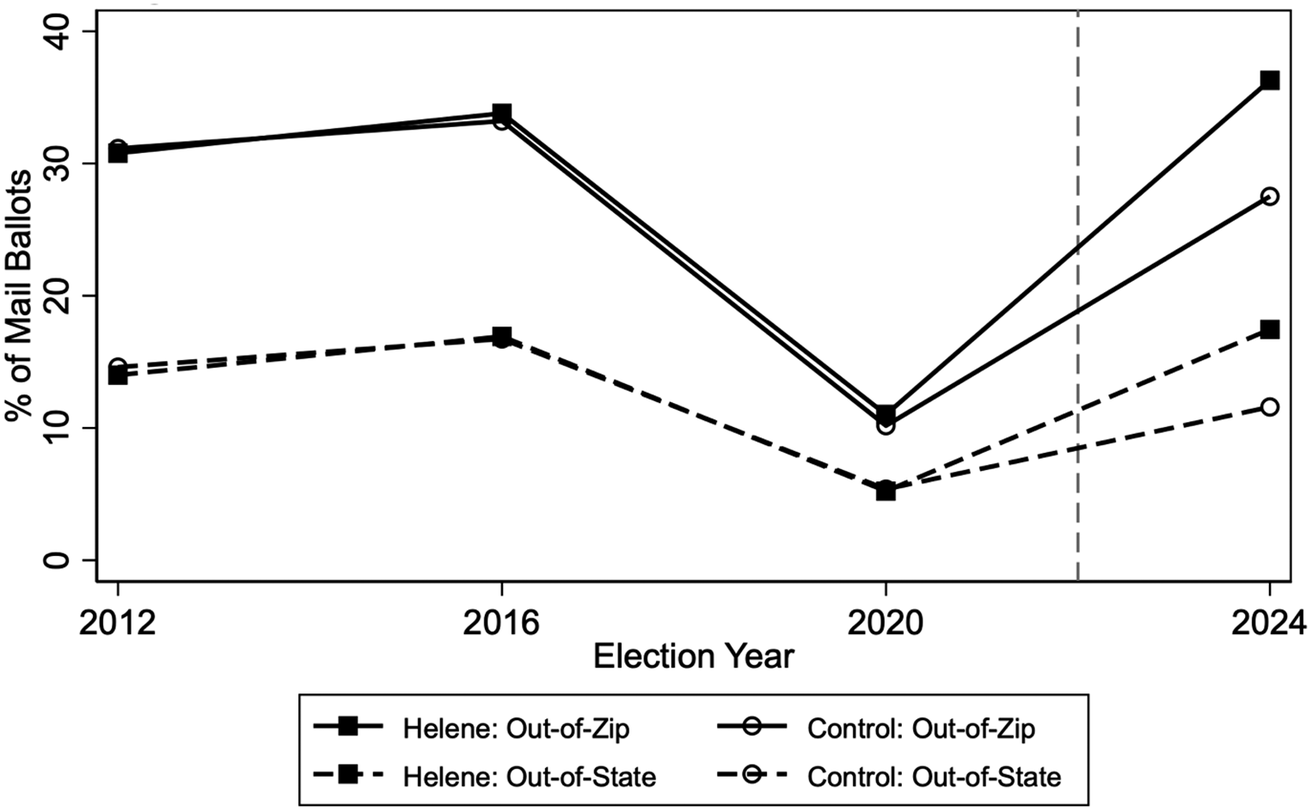
Mail ballot displacement, 2012–2024.
Note. Out-of-zip includes out-of-state ballots as a subset.
Solid = out-of-zip; dashed = out-of-state. Vertical line indicates the treatment period.

Figure 1. Long description
The line graph plots the percentage of mail ballots on the Y-axis (0 to 40) against Election Year on the X-axis (2012, 2016, 2020, and 2024). A vertical dashed line is positioned between 2020 and 2024.
Four data series are shown:
* Helene Out-of-Zip (solid line with black squares): Starts at approximately 31% in 2012, rises slightly in 2016, drops sharply to 11% in 2020, and then rises steeply to its peak at 36% in 2024.
* Control Out-of-Zip (solid line with open circles): Closely tracks the Helene Out-of-Zip line until 2020, but ends lower at approximately 28% in 2024.
* Helene Out-of-State (dashed line with black squares): Starts at 14% in 2012, rises to 17% in 2016, drops to 5% in 2020, and rises to 18% in 2024.
* Control Out-of-State (dashed line with open circles): Closely tracks the Helene Out-of-State line until 2020, but ends lower at approximately 12% in 2024.
All four series show a significant trough in 2020 followed by an increase in 2024, with the Helene groups showing a more pronounced increase than the control groups after the vertical dashed line marker.
Figure 1, which plots both out-of-state and out-of-ZIP mail ballot trends over time, reveals considerable effects of the hurricane on voter displacement. Prior to 2024, treated and control counties tracked closely on both measures, supporting parallel trends. In 2024, treated counties show a marked increase in both the out-of-ZIP and out-of-state measures while control counties remain comparatively stable. The divergence is slightly more pronounced for the out-of-ZIP measure, which captures within-state relocation in addition to the out-of-state ballots it subsumes.
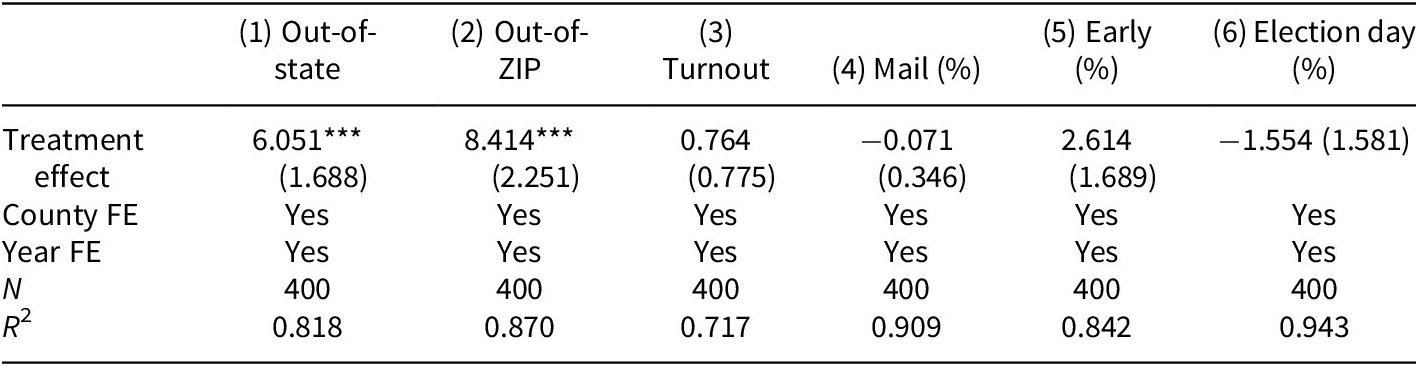
Moving to the analysis in Table 2, column 1, the hurricane increased the share of mail ballots sent out-of-state by just over six percentage points (p < 0.01). This represents a significant increase over the pre-treatment baseline of out-of-state ballots in treated counties. As shown in Table 2, column 2, the hurricane increased out-of-ZIP mail ballots by 8.4 percentage points (p < 0.01) – an effect roughly 40% larger than the out-of-state estimate. Because mail ballots are a small share of all ballots cast, I also estimate these effects as a share of all ballots; both remain positive and significant (see Appendix C). Because every out-of-state ballot is also out-of-ZIP, the two columns are nested rather than independent. While out-of-state captures the most extreme displacement, out-of-ZIP captures the fuller extent of relocation, including voters who remained within North Carolina.
The effect of Hurricane Helene on the 2024 election

Table 2. Long description
The table consists of six numbered columns representing different dependent variables and five rows of data and model specifications.
Columns:
1. Out-of-state
2. Out-of-Z I P
3. Turnout
4. Mail percent
5. Early percent
6. Election day percent
Rows:
- Treatment effect: Shows significant positive effects for Out-of-state (6.051 with standard error 1.688) and Out-of-Z I P (8.414 with standard error 2.251), both significant at the p < 0.01 level. Other effects are non-significant: Turnout (0.764), Mail percent (-0.071), Early percent (2.614), and Election day percent (-1.554).
- County F E: Yes for all columns.
- Year F E: Yes for all columns.
- N: 400 for all columns.
- R-squared: Values range from 0.717 for Turnout to 0.943 for Election day percent.
The note indicates data are at the county level for the 2012, 2016, 2020, and 2024 elections, with standard errors clustered on county.
Note. Data are at the county level and include the 2012, 2016, 2020, and 2024 elections. Standard errors clustered on county are presented in parentheses.
***p < 0.01; **p < 0.05; *p < 0.10.
The size of this effect is substantively as well as statistically significant. To put these levels in context, roughly 17% of all mail ballots cast in affected counties in 2024 were sent to out-of-state addresses, and over a third were sent outside the voter’s home ZIP code – a substantial share given that mail voting itself accounts for only 5%–7% of ballots in North Carolina.
Voter turnout
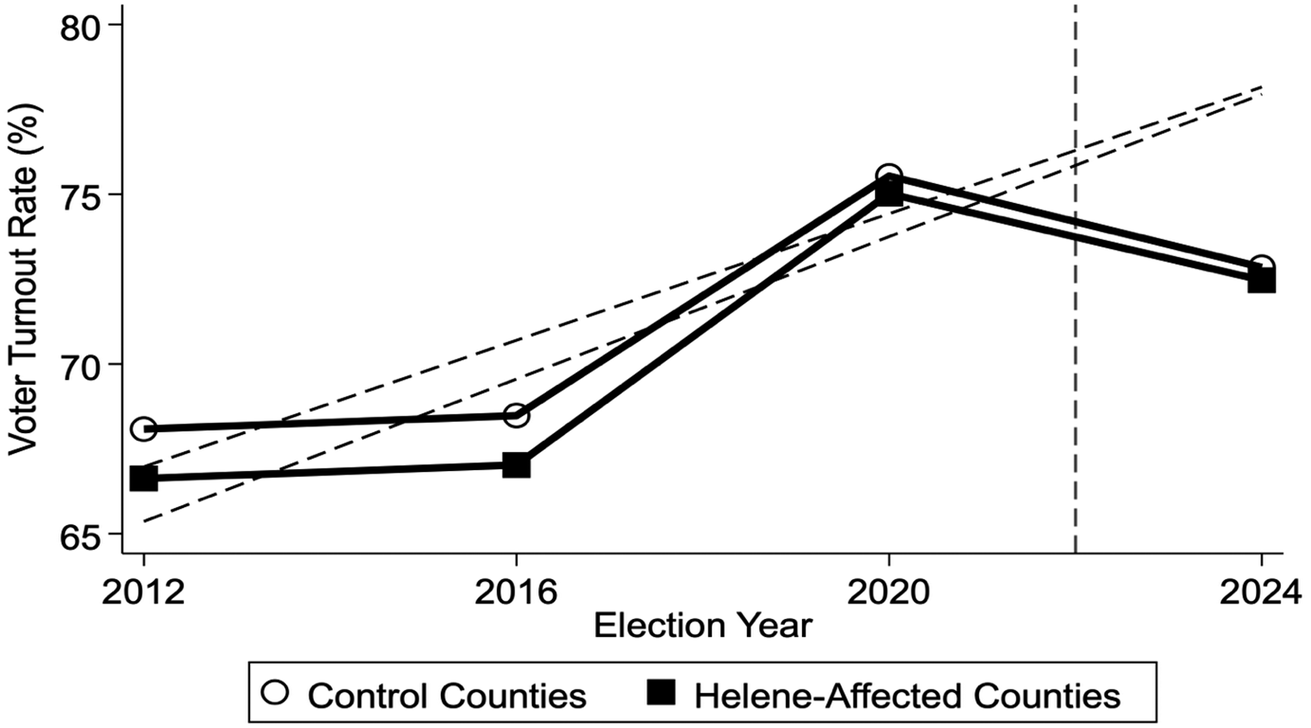
The next section examines voter turnout, beginning with the graphical results in Figure 2. In the pre-treatment period (2012–2020), affected counties averaged 69.6% turnout compared to 70.7% in control counties. In 2024, affected counties achieved 72.6% turnout while control counties reached 72.8%. It appears that both groups experienced similar increases in turnout, despite the presence of Hurricane Helene and the devastation and displacement that came with it.
Voter turnout rate, 2012–2024.
Note. Dashed lines show pre-treatment trends (2012-2020) extended to 2024. Vertical line marks the treatment period.

Figure 2. Long description
The x-axis is labeled Election Year with ticks for 2012, 2016, 2020, and 2024. The y-axis is labeled Voter Turnout Rate in percent, ranging from 65 to 80.
Two solid lines represent the data:
* Control Counties (open circles): Starts at approximately 68 percent in 2012, remains nearly flat through 2016, peaks at 75.5 percent in 2020, and declines to 73 percent in 2024.
* Helene-Affected Counties (solid squares): Starts lower at 66.5 percent in 2012, stays flat through 2016, peaks at 75 percent in 2020, and declines to 72.5 percent in 2024.
A vertical dashed line is positioned between 2020 and 2024. To the right of this line, two diagonal dashed lines project upward from the 2020 peak toward 78 percent, contrasting with the actual downward trend observed in the solid lines for 2024.
Table 2, column 3 presents the main results for voter turnout. While the treatment effect is positive (0.76), it is not statistically distinguishable from zero at conventional levels of statistical significance (SE = .78, p = .33). In other words, the DiD models in Table 2 reinforce that the control and affected counties experienced roughly the same level of change in voter turnout in 2024. Helene had no statistically discernible effect on county-level voter turnout.
While we do not know with certainty why Helene did not have a measurable impact on voter turnout, two factors might explain these null results. First, the 39-day gap between the hurricane’s impact and Election Day allowed voters to make another plan and shift their mode of voting in response to the storm. Second, the extensive changes implemented by North Carolina state and local election officials, including extended voting hours, additional early voting sites in Henderson and McDowell Counties, and enhanced absentee ballot access, might have muted effects that would have otherwise decreased voter turnout.
Voting method
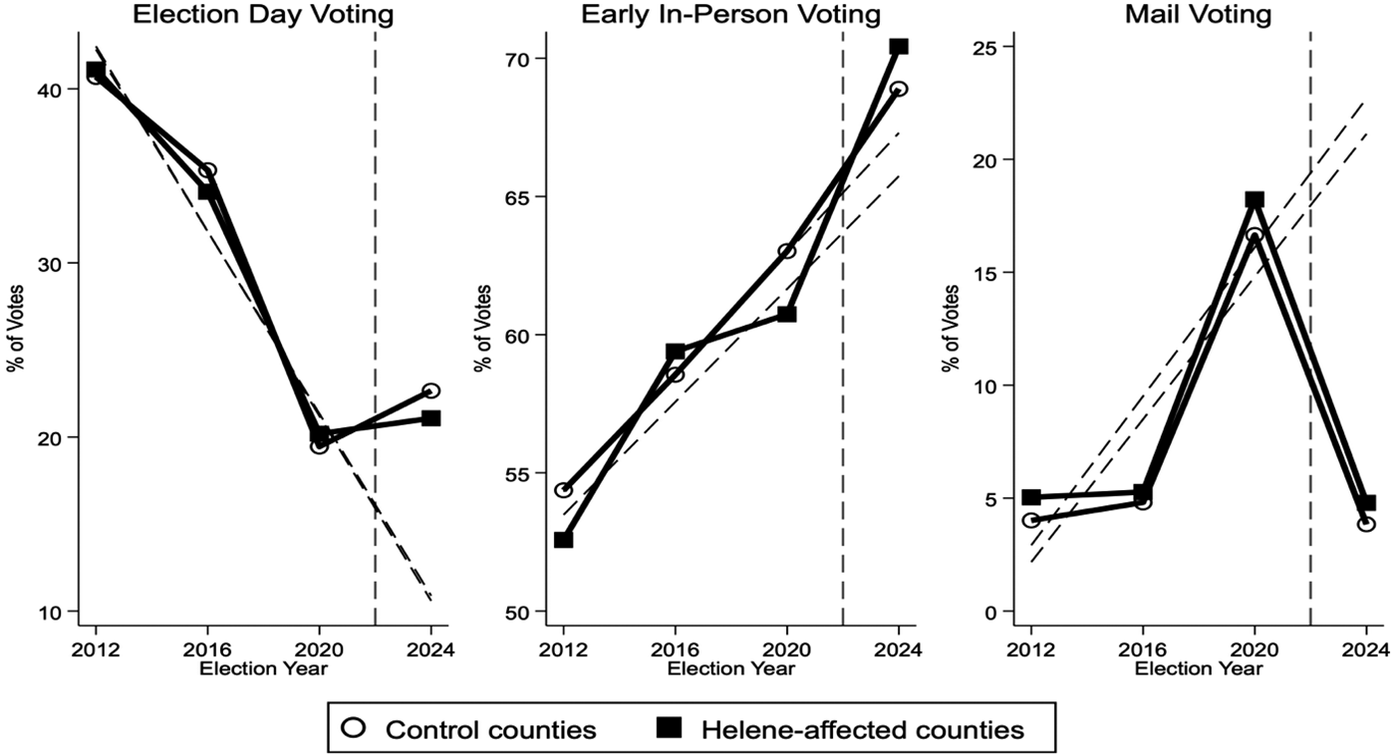
While voter turnout remained stable in the affected counties, Hurricane Helene may have affected how voters cast their ballots (Zelin and Smith Reference Zelin and Smith2023). It stands to reason that voters after Hurricane Helene also might have altered how they cast their votes – opting for more convenient and flexible modes of voting like early voting and mail voting. Figure 3 presents a graphical representation of the patterns and Table 2, columns 4, 5, and 6 present the results of the DiD models with statistical tests.
Vote mode.
Note. Dashed lines show pre-treatment trends (2012-2020) extended to 2024. Vertical line marks the treatment period.

Figure 3. Long description
A three-panel figure showing the percentage of votes by election year (2012, 2016, 2020, 2024) for two groups: Control counties (open circles) and Helene-affected counties (solid squares). A vertical dashed line is placed between 2020 and 2024.
* Left Panel: Election Day Voting. The y-axis ranges from 10 to 40 percent. Both groups show a steep linear decrease from approximately 41 percent in 2012 to 20 percent in 2020. In 2024, Control counties show a slight increase to roughly 23 percent, while Helene-affected counties remain nearly flat at 21 percent.
* Middle Panel: Early In-Person Voting. The y-axis ranges from 50 to 70 percent. Both groups show a strong upward trend. Control counties rise from 54 percent in 2012 to 68 percent in 2024. Helene-affected counties start lower at 52 percent and rise more sharply to reach approximately 71 percent in 2024.
* Right Panel: Mail Voting. The y-axis ranges from 0 to 25 percent. Both groups remain low (under 6 percent) in 2012 and 2016, followed by a sharp peak in 2020 at approximately 17 to 18 percent. In 2024, both groups drop significantly back to approximately 4 to 5 percent.
As shown in Figure 3 and Table 2, columns 4–6, there is no evidence that voters in Helene-affected counties shifted their voting methods in ways distinct from the rest of the state. Hurricane Helene had no statistically significant effect on mail voting (−0.07, p > 0.10), early voting (2.61, p > 0.10), or Election Day voting (−1.55, p > 0.10). This suggests that the previous findings regarding voter turnout are not attributable to voters selecting more convenient modes of voting. Voters in Western North Carolina following Hurricane Helene held to their traditional patterns in voter turnout or mode of voting.
Robustness checks
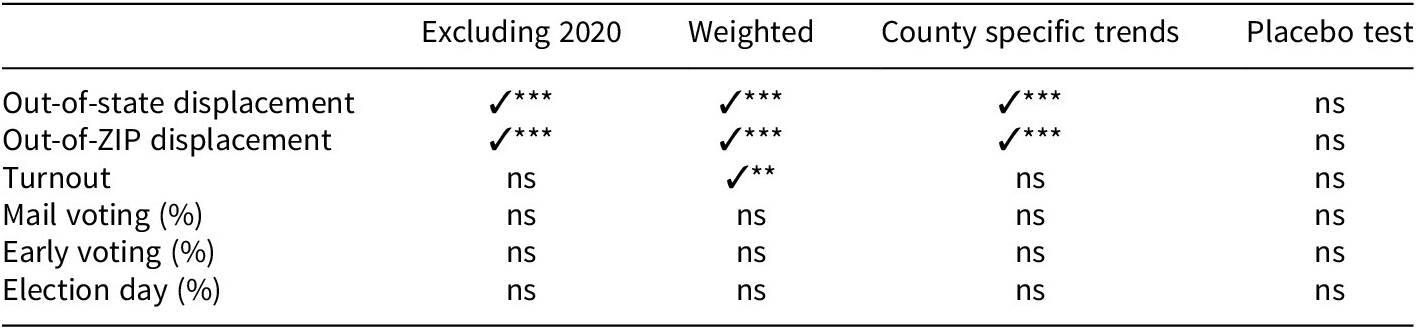
I conduct several robustness checks to assess the sensitivity of results to specification choices. Table 3 presents summary results from four alternative specifications: (1) excluding 2020 (the COVID-19 election year) to ensure pandemic-related changes do not drive results, (2) using population weights based on registered voters to give larger counties more influence, (3) controlling for county-specific linear time trends, and (4) a placebo test using 2020 as a fake treatment year. If the research design is robust, there should be no effect when applying it to a period without treatment. Summary results for all models are presented in Table 3 and complete results are in Appendix A.
Robustness check results summary

Table 3. Long description
The table consists of five columns and seven rows.
Column headers from left to right are: Blank, Excluding 2020, Weighted, County specific trends, and Placebo test.
Row-by-row data:
* Out-of-state displacement: checkmark with three asterisks for Excluding 2020, Weighted, and County specific trends; n s for Placebo test.
* Out-of-Z I P displacement: checkmark with three asterisks for Excluding 2020, Weighted, and County specific trends; n s for Placebo test.
* Turnout: n s for Excluding 2020; checkmark with two asterisks for Weighted; n s for County specific trends; n s for Placebo test.
* Mail voting (percent): n s across all four columns.
* Early voting (percent): n s across all four columns.
* Election day (percent): n s across all four columns.
Note: checkmark with three asterisks indicates treatment effect positive and statistically significant at p < 0.01. checkmark with two asterisks indicates treatment effect positive and statistically significant at p < 0.05. n s indicates treatment effect is not statistically significant.
Note. ✓*** indicates treatment effect positive and statistically significant at p < 0.01. ✓** indicates treatment effect positive and statistically significant at p < 0.05. ns indicates treatment effect is not statistically significant. Full results are available in Appendix A.
The results revealed in Table 3 show that the displacement effect remains positive and statistically significant across the first three robustness checks, indicating that the model is robust to all three alternative specifications. The lack of statistical significance for the placebo test also reinforces that the displacement effect is due to Helene, and not some other cause found in another year. The turnout and vote-mode results are null across nearly all specifications, with one exception: the population-weighted model shows a positive, significant turnout effect (2.843, p < 0.05). Because this effect is positive, it is consistent with the finding that Helene did not depress turnout. Regardless of the specifics of the measurement, Hurricane Helene did not depress voter turnout or change mode of voting, but did cause considerable displacement, as measured by the percentage of ballots sent out of state.
As a final check, I assessed whether the null turnout result could be an artifact of the partisan composition of the affected counties. Because voters in the Helene-affected counties lean Republican, and because Republican-leaning voters turned out at relatively high rates in 2024 (Hartig et al. Reference Hartig, Keeter, Daniller and Van Green2025), aggregate turnout in these counties could appear stable even if the storm depressed it.
To address this possibility, I re-estimated the turnout model controlling for each county’s Republican registration share, interacted with the post-treatment indicator. Because North Carolina has a large proportion of voters who are not registered as Democrats or Republicans, but rather as Unaffiliated (Bitzer et al. Reference Bitzer, Cooper, Manzo and Roberts2022), I use two measures of partisan composition: Republicans as a share of all registrants and Republicans as a share of two-party registration. The estimated turnout effect is unchanged under both specifications, remaining statistically insignificant, regardless of the modeling choices (see Appendix B). The partisan-composition interactions are also insignificant, indicating little evidence that Republican-leaning counties turned out at different rates in 2024. The null turnout result, therefore, does not appear to be a product of the partisan makeup of the affected counties.
Discussion
Hurricane Helene seemed primed to disrupt normal voting patterns in Western North Carolina during the 2024 election. It struck after the first mail ballots were distributed and just weeks before in-person early voting was to begin. The scale of the devastation was also massive and would certainly not be resolved before Election Day. North Carolina’s status as a purple state that could swing towards either party (Bitzer Reference Bitzer, Bullock and Rozell2026; Cooper Reference Cooper2024a) meant that Helene’s potential impact on the election became a national story (Sakellariadis, Crampton, and Piper Reference Sakellariadis, Crampton and Piper2024).
Voter turnout in the affected counties was unmoved by the storm and the affected counties had statistically indistinguishable patterns in vote mode choice from the counties that were unaffected by Helene. This is not because voters stayed put. Using novel address data, this paper reveals that Helene did displace many thousands of voters. But these voters were still able to cast their vote – even from out of state.
Together, these findings are consistent with resilient election administration and voter participation in the face of major disruption. The combination of North Carolina’s three mode voting system (including no excuse mail balloting) and administrative changes in the conduct of elections in the affected counties meant that the worst of the storm’s effects on democracy were muted. States with more limited voting options, or a less responsive election administration system might experience larger turnout effects from similar disasters.
Limitations and future research
While the findings are robust to multiple alternative specifications and robustness checks, there remain reasons to question whether the primary findings would translate to other disasters. Each disaster is unique – in timing, and in the scope and depth of the devastation it brings. A storm that arrived earlier or later might have had very different effects, as would one that carried greater or lesser impact.
Likewise, a disaster that coincided with a midterm or odd-year election might have led to much more disruption. Presidential elections, of course, always enjoy higher salience and higher turnout and citizens are much more aware of election dates and processes. In addition, North Carolina’s status as a competitive presidential battleground likely lowered the cost of voting for some voters through intensive mobilization by campaigns and outside groups. These reduced costs of voting may have contributed to the resilience observed here (Fraga and Hersh Reference Fraga and Hersh2011). A fruitful extension of this work would compare voters in competitive Helene-affected states (such as Georgia and North Carolina) to those in less competitive ones (such as South Carolina and Florida). While displacement and other measurements cannot be exactly replicated, and the state responses are distinct, such an analysis could help uncover the unique effects of competitiveness on resilience.
The NCSBE is also an unusually professionalized and well-run organization. Indeed, the NCSBE received a Clearinghouse award from the US Election Assistance Commission for its “exemplary contingency planning and emergency response efforts” during Hurricane Helene (NCSBE 2025). If their administrative response had differed, the results would likely have differed as well.
In terms of methodology, this study uses aggregate county-level data, rather than individual data. While this is advantageous in many ways, it does mask potential heterogeneity across demographic groups (Morris and Miller Reference Morris and Miller2022; Reference Morris and Miller2023). This study does not speak to that possibility. Future research should do so.
The outcome variables examined here (mode, turnout, and displacement) are, of course, not exhaustive. For example, the paper does not address same-day registration during early voting – an electoral institution that can have particularly profound effects on youth voter turnout (Grumbach and Hill Reference Grumbach and Hill2022). The storm may have suppressed new registrations that would otherwise have occurred, potentially resulting in reduced voter turnout in this election and in subsequent elections.
A further limitation concerns what the design can and cannot say about the level of turnout. The difference-in-differences estimates identify whether turnout in affected counties changed relative to comparable control counties but they cannot establish whether turnout in those counties would have been even higher absent the hurricane. It is possible that Helene did result in some diminished participation that the comparison to control counties does not reveal.
Finally, the out-of-state and out of ZIP mail ballot measures capture only two dimensions of displacement. Some displacement likely remains unobserved. Voters who moved within their home ZIP code, or who returned home despite difficult conditions, are not captured by either measure. The displacement effects presented here, therefore, likely represent a lower bound of the total disruption to voters in the affected counties. Nonetheless, these measures uncover displacement that administrative data has rarely been able to capture directly – and on a scale substantial enough to make the stability of turnout all the more striking. Constructing Meredith and Kronenberg’s (Reference Meredith and Kronenberg2023) full four-category classification across additional states remains a valuable direction for future work.
Conclusion
This study examined how Hurricane Helene, a catastrophic natural disaster, affected voter participation in the 2024 election in North Carolina. Using a difference-in-differences design comparing 13 affected counties to 87 control counties across four election cycles, I find evidence of electoral resilience in the affected counties. Overall voter turnout remained stable despite severe infrastructure damage and displacement, suggesting that modern election infrastructure – particularly multi-modal voting systems – can maintain participation even during major disruptions. However, the hurricane significantly increased voter displacement, with out-of-state mail ballots rising by approximately six percentage points and out of ZIP mail ballots increasing by about eight percentage points in affected areas.
These findings illustrate the impact of disasters on elections and election administration in several ways. First, the data provide evidence from a high-salience presidential election, adding to prior research that has come to mixed conclusions regarding the electoral impact of disasters. In addition, this study distinguishes between turnout effects and displacement effects, revealing that disasters can displace voters even when aggregate turnout remains relatively constant. By holding the policy and electoral context constant within a single state while exploiting variation in disaster exposure, the analysis highlights how state-level administrative capacity and policy flexibility can mute negative participation effects of exogenous shocks. Responsive institutions may help build resilience into democratic processes. The case of Hurricane Helene in North Carolina demonstrates that electoral resilience is possible – but certainly not guaranteed.
Data availability statement
Replication materials are available on SPPQ Dataverse at https://dataverse.harvard.edu/dataset.xhtml?persistentId=doi:10.7910/DVN/C94PHX&faces-redirect=true (Cooper Reference Cooper2026).
Acknowledgments
Previous versions of this paper were presented at the North Carolina Political Science Association and Election Science Research Association annual meetings. Thanks to Karen Brinson Bell and Alixandra Yanus for helpful comments on this paper.
Funding statement
The author received no financial support for the research, authorship, and/or publication of this article.
Competing interests
The author declared no potential conflicts of interest with respect to the research, authorship, and/or publication of this article.
Appendix A
Results are robust to alternative specifications

Table A1. Long description
The table consists of six columns: 1 Out-of-state, 2 Out-of-Z I P, 3 Turnout, 4 Mail percentage, 5 Early percentage, and 6 Election day percentage. It is divided into four panels.
Panel A: Excluding 2020. Treatment effects are 6.069 for Out-of-state, 8.655 for Out-of-Z I P, 1.075 for Turnout, 0.207 for Mail, 2.012 for Early, and minus 1.172 for Election day. N equals 300. R-squared values range from 0.761 to 0.937.
Panel B: Population weighted. Treatment effects are 5.781 for Out-of-state, 7.651 for Out-of-Z I P, 2.843 for Turnout, 0.652 for Mail, minus 2.518 for Early, and 1.888 for Election day. N equals 400. R-squared values range from 0.713 to 0.942.
Panel C: County-specific time trends. Treatment effects are 5.597 for Out-of-state, 7.219 for Out-of-Z I P, minus 0.169 for Turnout, minus 0.621 for Mail, 3.099 for Early, and minus 1.867 for Election day. N equals 400. R-squared values range from 0.843 to 0.981.
Panel D: Placebo test 2020 as treatment. Treatment effects are non-significant: 0.056 for Out-of-state, 0.724 for Out-of-Z I P, 0.934 for Turnout, 0.832 for Mail, minus 1.806 for Early, and 1.146 for Election day. N equals 300. R-squared values range from 0.803 to 0.956.
All panels include County F E and Year F E. Standard errors are provided in parentheses below treatment effects. Significance levels are indicated by asterisks where p is less than 0.01, 0.05, or 0.10.
Note. Standard errors clustered at county level in parentheses. A excludes 2020 to ensure pandemic-related changes do not drive results. B weights observations by registered voters. C adds county-specific linear time trends. D uses pre-2024 data (2012–2020) with 2020 as fake treatment year.
***p < 0.01; **p < 0.05; *p < 0.10.
Appendix B
Turnout is robust to the inclusion of partisan composition

Table B1. Long description
The table consists of four columns: Specification, Coefficient, S E, and p.
Row 1: Specification (0) Baseline (no partisan control) has a Coefficient of 0.764, S E of 0.775, and p-value of 0.327.
Row 2: Specification (1) plus Republican share of total registrants has a Coefficient of 0.674, S E of 0.884, and p-value of 0.447.
Row 3: Specification (2) plus Republican two-party share has a Coefficient of 0.659, S E of 0.903, and p-value of 0.467.
A note below the table indicates that each partisan-composition control is interacted with the post-treatment 2024 indicator. It specifies that county and year fixed effects are used in all models with standard errors clustered on county. The treatment effect remains statistically insignificant across all specifications.
Note. Difference-in-differences estimates of the Helene treatment effect on voter turnout. Each partisan-composition control is interacted with the post-treatment (2024) indicator. County and year fixed effects in all models; standard errors clustered on county. The treatment effect remains statistically insignificant across all specifications.
Appendix C
The out-of-state and out-of-ZIP measures in Table 2 are expressed as a share of mail ballots. Because mail ballots are only a small share of all ballots cast, this appendix re-estimates the displacement effects using the share of all ballots cast as the outcome. Both effects remain positive and statistically significant, and both measures satisfy parallel trends; pre-2024 F-tests are non-significant, F = 1.43, p = 0.234 for out-of-state and F = 0.00, p = 0.947 for out-of-ZIP.
Displacement effects are robust to measuring ballots as a share of all ballots cast

Table C1. Long description
The table is titled Difference-in-differences estimates (share of all ballots cast). It consists of five columns: Outcome, Coefficient, S E, N, and R super 2.
* Row 1: Outcome is percent of all ballots out-of-state. Coefficient is 0.320 with three asterisks indicating p less than 0.01. S E is 0.110. N is 400. R super 2 is 0.870.
* Row 2: Outcome is percent of all ballots out-of-Z I P. Coefficient is 0.449 with three asterisks indicating p less than 0.01. S E is 0.162. N is 400. R super 2 is 0.871.
A footer note specifies that these are Helene treatment effect estimates using county and year fixed effects with standard errors clustered on county. Significance levels are defined as three asterisks for p less than 0.01, two for p less than 0.05, and one for p less than 0.10.
Note. Difference-in-differences estimates of the Helene treatment effect, with the outcome measured as out-of-state (or out-of-ZIP) ballots as a percentage of all ballots cast. County and year fixed effects in all models; standard errors clustered on county.
***p < 0.01; **p < 0.05; *p < 0.10.
Author biography
Christopher A. Cooper is the Madison Distinguished Professor and Director of the Haire Institute for Public Policy at Western Carolina University. His teaching and research focus on state politics, elections, and southern politics.