The selection of bacteria for probiotic formulations requires a continuous isolation of new strains, in spite of the large number of commercially available starters, to ensure the elaboration of products with the greatest benefits for health.
Commercially available strains are generally isolated from milk, vegetables, human or animal microbiota and natural fermented products. However, there are other sources of probiotic bacteria that have not been extensively studied to date. In this sense, kefir grains could be considered as a source of potentially probiotic microorganisms. These grains are composed by a complex microbiota including lactobacilli, lactococci, acetic acid bacteria and yeast, to which several health promoting properties have been attributed (Saloff Coste, Reference Saloff Coste1996, Garrote et al. Reference Garrote, Abraham and De Antoni2000, Golowczyc et al. Reference Golowczyc, Mobili, Garrote, Abraham and De Antoni2007). These beneficial properties of some individual kefir strains and also of kefir as a whole product, together with the great variety of microorganisms present in kefir make this fermented milk an appropriate source of strains for probiotic formulation. However, the complexity of kefir microbiota makes the selection of potentially probiotic microorganisms a tedious task.
When such an amount of isolates is to be analyzed, the use of reliable techniques becomes crucial. For this reason, an appropriate method of analysis for this kind of sample should be non-destructive, non time-consuming and if possible, should not require chemical reagents. Besides that, the use of appropriate techniques of analysis should allow the maximum advantage to be made from the results obtained.
In order to achieve these desirable outcomes, physical methods appear to be the most appropriate. In this regard, vibrational spectroscopic techniques, namely Fourier transform infrared (FTIR) and Raman spectroscopies have been widely used for bacteria differentiation (Naumann et al. Reference Naumann, Helm, Labischinski, Giesbrecht and Nelson1991a & Reference Naumann, Helm and Labischinskib; Maquelin et al. Reference Maquelin, Kirschner, Choo-Smith, Van den Braak, Endtz, Naumann and Puppels2002a). The information included in the vibrational spectra gives a global picture of the whole molecular composition (i.e.: nucleic acids, proteins, lipids and cell wall components) of bacteria. Therefore, the obtained spectroscopic data represent highly specific fingerprints enabling accurate microorganism identification at different taxonomic levels (Naumann et al. Reference Naumann, Helm, Labischinski, Giesbrecht and Nelson1991a & Reference Naumann, Helm and Labischinskib; Naumann & Meyers, Reference Naumann and Meyers2000; Naumann, Reference Naumann, Gremlich and Yan2001).
In regard to lactic acid bacteria, FTIR and Raman spectroscopies have been used with different goals. Several articles reported the use of FTIR-based techniques for the differentiation and/or identification of streptococci (Amiel et al. Reference Amiel, Mariey, Curk-Daubie, Pichon and Travert2000a, Reference Amiel, Mariey, Denis, Pichon and Travert2001), lactococci (Lefier et al. Reference Lefier, Lamprell and Mazerolles2000) Lactobacillus sakei, Lb. plantarum, Lb. paracasei and Lb. curvatus (Oust et al. Reference Oust, Møretrø, Kirschner, Narvhus and Kohler2004a & b), the Lb. acidophilus group (Weinrichter et al. Reference Weinrichter, Luginbühl, Rohm and Jimeno2001; Luginbühl et al. Reference Luginbühl, Jimeno and Zehntner2006), the Lb. casei group (Amiel et al. Reference Amiel2000b, Reference Amiel, Mariey, Denis, Pichon and Travert2001) and different species of lactobacilli isolated from kefir (Bosch et al. Reference Bosch, Golowczyc, Abraham, Garrote, De Antoni and Yantorno2006).
Raman spectroscopy has also been demonstrated to be an adequate analytical tool for the characterization of LAB at different taxonomic levels (Streptococcus thermophilus, Lb. acidophilus and Lb. delbrueckii ssp. bulgaricus isolated from yogurt) (Rösch et al. Reference Rösch, Schmitt, Kiefer and Popp2003; López-Diez & Goodacre, Reference López-Díez and Goodacre2004; Zhu et al. Reference Zhu, Quivey and Berger2004; Gaus et al. Reference Gaus, Rösch, Petry, Peschke, Ronneberger, Burkhardt, Baumann and Popp2006; Oust et al. Reference Oust, Møretrø, Naterstad, Sockalingum, Adt, Manfait and Kohler2006). However, to our knowledge no attempt has been reported regarding the employment of Raman spectroscopy for the differentiation of heterofermentative related lactobacilli species.
For this reason, the aim of the present work was to combine Raman spectroscopy with multivariate analysis (PCA and PLS-DA) for the discrimination of heterofermentative lactobacilli species generally present in kefir grains, identifying the biological structures that are responsible for this discrimination. In a first level of classification, Lb. kefir has been discriminated from Lb. parakefir and Lb. brevis and in a second level, multivariate analysis allowed for discrimination between Lb. parakefir and Lb. brevis.
Materials and Methods
Bacterial strains and growth conditions
Thirteen wild strains of Lb. kefir isolated from different kefir grains at CIDCA (Garrote et al. Reference Garrote, Abraham and De Antoni2001) (CIDCA 83110; CIDCA 83111; CIDCA 83113; CIDCA 83115; CIDCA 8317; CIDCA 8321; CIDCA 8325; CIDCA 8332; CIDCA 8335; CIDCA 8343; CIDCA 8344; CIDCA 8345; CIDCA 8348), two of Lb. parakefir (CIDCA 8322 and CIDCA 8328), three of Lb. plantarum (CIDCA 8323, CIDCA 8331, CIDCA 83114) and the commercial strains Lb. kefir ATCC 8007, Lb. brevis (ATCC 8287 and JCM 1059) and Lb. plantarum DSMZ 20174 were cultured in MRS broth (de Man et al. Reference de Man, Rogosa and Sharpe1960) (Biokar Diagnostics, Beauvais, France) at 30°C for 48 h. ATCC strains were purchased from the American Type Culture Collection (Manassas, VA 20108, USA) DSMZ strain, from the Deutsche Sammlung von Mikroorganismen und Zellkulturen (Germany), and JCM strain from the Japanese Collection of Microorganisms (Japan). The wild strains belong to the CIDCA culture collection and were identified by molecular methods (whole cell protein profile, 16S-23S rRNA, ARDRA, RAPD-PCR, FTIR) as previously published (Garrote et al. Reference Garrote, Abraham and De Antoni2001; Bosch et al. Reference Bosch, Golowczyc, Abraham, Garrote, De Antoni and Yantorno2006; Delfederico et al. Reference Delfederico, Hollmann, Martínez, Iglesias, De Antoni and Semorile2006; Golowczyc et al. Reference Golowczyc, Gugliada, Hollmann, Delfederico, Garrote, Abraham, Semorile and De Antoni2008).
The microorganisms were harvested in the stationary phase, collected by centrifugation (10 000 g at 10°C for 5 min), washed once with 50 mm-phosphate buffered saline (PBS, pH 7) and then twice with bidistilled water. Then, bacterial cells were lyophilized in a FD4 Heto freeze drier (Lab Equipment, Denmark) and conserved at room temperature.
Raman spectra
The Raman Spectra of the bacterial samples were measured by placing them onto an aluminium substrate and then under a Leica microscope (DMLM) integrated to the Raman system (Renishaw 1000B). In order to retain the most important spectral information from each strain, multiple scans were conducted at different points of the sample by moving the substrate on an X-Y stage. The Raman system was calibrated with a silicon semiconductor using the Raman peak at 520 cm−1, and further improved using samples of chloroform (CHCl3) with bands at 261, 364 and 667 cm−1 and cyclohexane (C6H12) with bands at 383, 426, 801, 1028, 1157, 1265 and 1347 cm−1, 1443 cm−1. The wavelength of excitation was 830 nm and the laser beam was focused (spot size of approximately 2·0 μm) on the surface of the sample with a ×50 objective. The laser power irradiation over the samples was 45 mW. Principal component analysis (PCA) was conducted over 140 Raman spectra collected from 14 Lb. kefir and 4 non-Lb. kefir strains. On the other side, a total of 45 Raman spectra acquired from 4 Lb. kefir and 3 non-Lb. kefir strains were used for the calibration of the model (Table 1 i & ii). Another set of 130 spectra acquired from 10 Lb. kefir and 5 non-Lb. kefir strains that had not been used for the calibration were used to validate the model (see Table 1 iv & v for details). Each spectrum was registered with an exposure of 30 s, two accumulations, and collected in the 1800–400 cm−1 region with 2 cm−1 spectral resolution.
Data set preparation and results of performance of PLS-DA

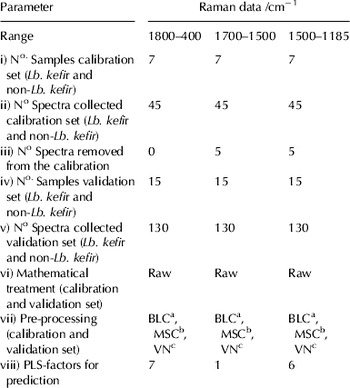
i) Number of strains Lb. kefir and non-Lb. kefir selected to calibrate the classification model. ii) Number of spectra collected and used for the calibration of the classification model. iii) Number of spectra identified as “outliers” and removed from the calibration stage. iv) Number of strains Lb. kefir and non-Lb. kefir selected to validate the calibrated model. v) Number of spectra collected and used for the validation of the calibrated model. vi) Mathematical treatment applied to the data set. In this case no mathematical treatment was applied to the data set, using the raw data. vii) Data pre-processing applied to the spectra prior to the multivariate calibration. viii) Number of components used in the calibrated model for the classification of the validation set. This number of PLS-factors correspond to the first minimum in the RMSEP values versus number of PLS factors or principal components.
a BLC: Base line correction
b MSC: Multiplicative scatter correction
c VN: Vector normalization
The fluorescence contribution was removed by approximating a polynomial function to the spectra and then subtracting it from the spectra.
Data Analysis
The recorded Raman spectra were analyzed using GRAMS software (version 3.04, Thermo Galactic, USA). Multivariate analysis and data pre-processing as baseline correction (BLC), multiplicative scatter correction (MSC) and vector normalization (VN) were performed on the Raman spectra, using The Unscrambler™ software (version 8.0, CAMO, Norway).
Principal component analysis (PCA) was performed over the pre-processed Raman spectra in order to evaluate the spectral differences among Lactobacillus heterofermentative species in the PC space. In addition, PLS-discriminant analysis (PLS-DA) was used to develop models allowing discrimination of Lb. kefir strains from strains belonging to other related species (Martens & Næs, Reference Martens and Næs1989; Esbensen, Reference Esbensen2005).
Brief description of the Methods
PCA is a multivariate technique that operates in an unsupervised manner (each number of the groups under study is not known a priori) and it is used to analyze the inherent structure of the data. PCA reduces the dimensionality of the data set by finding an alternative set of coordinates, the principal components (PCs) (Martens & Næs, Reference Martens and Næs1989; Esbensen, Reference Esbensen2005). PCs correspond to a linear combination of the original variables, which are orthogonal to each other and designed in such a way that each one successively accounts for the maximum variability of the data set.
The first principal component (PC1) accounts for as much of the variability in the data as possible, and each succeeding component accounts for as much of the remaining variability as possible. When PC scores are plotted, for example PC1 vs PC2 or any combination of the PCs, they can reveal relationships between samples (grouping). PCA provides insight into which is the percentage of variance explained by each PC and how many PCs should be kept to maintain the maximum information from the original data (Martens & Næs, Reference Martens and Næs1989; Esbensen, Reference Esbensen2005). In addition, when the PC loadings are plotted as function of the variables, the plot reveals the most important diagnostic variables or regions related with the differences found in the data set.
PLS-DA is a version of PLS in which one or several Y-variables are modelled simultaneously, thus taking advantage of possible correlations or co-linearity between Y-variables. The discriminant analysis approach assumes that a sample has to be a member of one of the classes included in the analysis. Each class is represented by an indicator variable (a binary variable with a value equal to 1 for members of the class and 0 for non-members). This way, by building a PLS model with indicator variables (Y), it is possible to directly predict the class membership from the X-variables describing any given sample.
The model output corresponds to the predicted value for an unknown sample. A correct prediction should have, ideally, a Y value equal to 1 for the members of the class and 0 for the non-members. All predicted values are accompanied by a deviation, which counts for the reliability of the prediction.
Results and Discussion
In kefir grains, two large groups of lactobacilli can be found: homo- and heterofermentative. As previously reported for the characterization of kefir lactobacilli using biochemical assays (Garrote et al. Reference Garrote, Abraham and De Antoni2001) and FTIR spectroscopy (Bosch et al. Reference Bosch, Golowczyc, Abraham, Garrote, De Antoni and Yantorno2006), discrimination between these groups represents a preliminary step in their characterization. Due to the huge differences between these two groups, Raman spectroscopy also depicted completely different spectra for the strains belonging to each of these large groups. For this reason, we decided to centre the scope of this work on the discrimination within the heterofermentative group, composed of the phylogenetically related Lb. kefir, Lb. parakefir and Lb. brevis species (Bosch et al. Reference Bosch, Golowczyc, Abraham, Garrote, De Antoni and Yantorno2006).
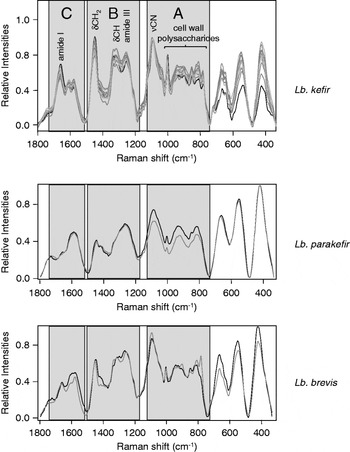
The pre-processed average raw Raman spectra of these three species allowed the observation of clear differences between heterofermentative lactobacilli in the whole range analyzed (Fig. 1). The major differences were observed between Lb. kefir strains and the other lactobacilli species. The regions where these differences were observed are related to the following bands: the various oligo- and polysaccharides of the cell wall (script A), amide III, CH2 and CH deformations (script B), and nucleotidic bases ring stretching and amide I (script C) (De Gelder et al. Reference De Gelder, De Gussem, Vandenabeele, Vancanneyt, De Vos and Moens2007).
Raman spectra corresponding to all the strains of Lb. kefir, Lb. parakefir and Lb. brevis under study. Scripts A, B and C denote the regions where the main differences among spectra are observed. These regions correspond to 1700–1500 cm−1; 1480–1180 cm−1 and 1150–750 cm−1, respectively.

Multivariate Analysis
Principal Component Analysis (PCA) In order to take advantage of the huge amount of information provided by the spectroscopic data, a multivariate analysis was carried out on the raw Raman spectra.
PCA was performed independently on the Raman data sets, with the aim of comparing, in an unsupervised manner, the inherent structure of the spectral data in terms of similarities and differences. For this analysis, 18 different bacterial strains were considered, 14 strains of Lb. kefir and 4 strains belonging to the species Lb. parakefir and Lb. brevis, from now on denominated as non-Lb. kefir strains.
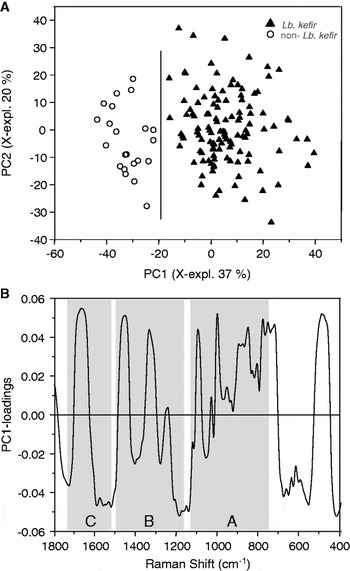
In the scores plot obtained from principal component analysis conducted over the raw Raman spectra in the whole spectral range registered (1800–400 cm−1) a clear separation between the Lb. kefir and non-Lb. kefir groups can be observed over the PC1-axis, which explains 37% of the total variance of the data set (Fig. 2A). This separation is the result of the spectral differences observed in the raw data. According to PC1-loadings plot (Fig. 2B), the highest loadings values correspond to the spectral regions where the differences between groups are more evident. These regions are the ones denoted as Scripts A, B and C in Fig. 1.
A: Score plots from the PCA analysis performed on the whole range of the Raman spectra (1800–400 cm−1) for the lactobacilli samples under study (PC2 vs PC1). ▲ corresponds to Lb. kefir strains, ○, to non- Lb. kefir strains. B: 1-D Loading plot from the PCA analysis performed on the whole range of the Raman spectra (1800–400 cm−1) for the lactobacilli samples under study.

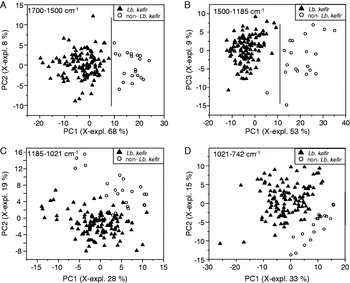
In order to enhance the differences between the two lactobacilli groups, eliminating irrelevant information in terms of differentiation, the PCA-scores were calculated for those regions where the differences between species were more evident: 1700–1500, 1500–1185, 1185–1021 and 1021–742 cm−1. The PCA-scores plots corresponding to these regions are depicted in Fig. 3A–D.
Score plots from the PCA analysis performed on the Raman spectra of the lactobacilli samples under study in the following regions: A: 1700–1500 cm−1, B: 1500–1185 cm−1, C: 1185–1021 cm−1 and D: 1021–742 cm−1. ▲ corresponds to Lb. kefir strains, ○, to non- Lb. kefir strains.

From Fig. 3, it can be observed that PCA in the 1700–1500 cm−1 and 1500–1185 cm−1 regions (Scripts A & B) allows for a clear discrimination between Lb. kefir and non-Lb. kefir strains over PC1-axis. Although certain grade of separation can be observed along PC2-axis in the 1185–1021 cm−1 region (Script C), the overlap of symbols does not allow a clear differentiation between the two groups under consideration. In the 1021–742 cm−1 region (Script D), a separation can also be observed along both PC1 and PC2, which is not reliable to perform the calibration of a classification model. Besides that, this region is known as the “fingerprint region” and therefore, it is strain dependent.
These results allowed us to conclude that the 1700–1500 cm−1 and 1500–1185 cm−1 regions are the best to differentiate Lb. kefir from non-Lb. kefir strains (Fig. 3A & B). In these regions, the discrimination between both groups could be observed entirely along PC1, which explains 68% and 53% of X-explained variance, respectively. The main spectral differences giving rise to this discrimination in the 1700–1500 cm−1 region correspond to the bands at 1580 cm−1 (arising from the adenine and guanine ring stretching) and at 1660 cm−1 (arising from amide I vibrations) (De Gelder et al. Reference De Gelder, De Gussem, Vandenabeele, Vancanneyt, De Vos and Moens2007). Within the 1500–1185 cm−1 region, the main bands contributing to discrimination are at 1452, 1320 and 1265 cm−1, corresponding to CH2 and CH deformations, and amide III, respectively (De Gelder et al. Reference De Gelder, De Gussem, Vandenabeele, Vancanneyt, De Vos and Moens2007).
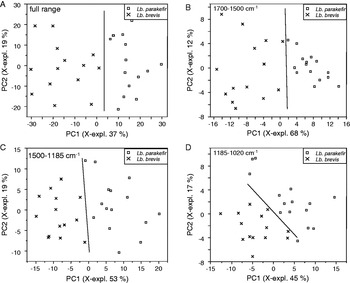
Once it was established that Lb. kefir strains can be distinguished from non-Lb. kefir strains, an effort was made to discriminate within the latter group, which includes Lb. parakefir and Lb. brevis strains. Figure 4 depicts the score plots corresponding to the following regions: 1800–400 cm−1 (full range) (Script A); 1700–1500 cm−1 (Script B); 1500–1185 cm−1 (Script C) and 1185–1020 cm−1 (Script D). Discrimination between these two species could be observed along PC1, in all the ranges analyzed. However, discrimination is better when restrained regions are considered. In fact, this PC explains 68, 53 and 45% of variance for the regions considered in Scripts B, C and D, respectively. These results indicate that the main differences between Lb. brevis and Lb. parakefir can be ascribed to amide I and III and to the CH2 and CH deformations (the regions defined in Scripts B to D). This allows us to conclude that the protein profile is one of the main factors contributing to the discrimination between Lb. brevis and Lb. parakefir species.
Score plots from the PCA analysis performed on the Raman spectra of the Lb. brevis and Lb. parakefir in the following regions: A: 1800–400 cm−1 (full range) cm−1, B: 1700–1500 cm−1, C: 1500–1185 cm−1 and D: 1185–1021 cm−1. X corresponds to Lb. brevis strains, □, to Lb. parakefir strains.

In summary, the information depicted in Fig. 3 & 4 allowed us to conclude that proteins are the biological structures the most determinant for the discrimination between heterofermentative species of lactobacilli.
Taking into account the efficiency of the 1800–400 cm−1 (whole range), 1700–1500 cm−1 and 1500–1185 cm−1 regions to discriminate between Lb. kefir and non-Lb. kefir strains, they were further selected to build three models allowing the classification of unknown samples.
The PCA-scores plots for these three regions also allowed the differentiation between Lb. parakefir and Lb. brevis. However, the limited number of strains belonging to these two groups makes impossible the calibration of a robust classification model and its further independent validation.
Partial least square-discriminant analysis (PLS-DA)
PLS-discriminant analysis was used to develop the classification rules potentially useful for a quick discrimination of unknown samples.
This method operates in a supervised manner, meaning that a prior knowledge of the class membership is required (Martens & Næs, Reference Martens and Næs1989). For the model, two classes were defined: Lb. kefir and non-Lb. kefir. A correct prediction should have, ideally, a Y value equal to 1 for the samples belonging to the Lb. kefir class and 0 for the non-members (non-Lb. kefir) (Martens & Næs, Reference Martens and Næs1989). A Y value of 0·5 is the decision value: values higher than 0·5 will indicate Lb. kefir strains whereas values lower than 0·5 will denote strains belonging to the non-Lb. kefir group.
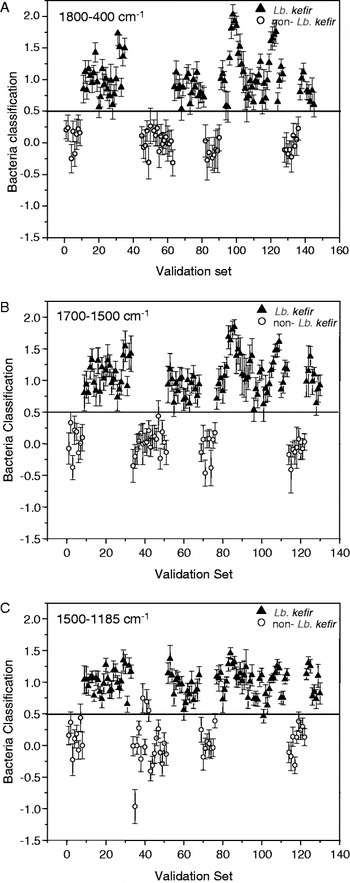
The PLS-DA was carried out over the pre-processed Raman spectra (including replicates) in an independent set of calibration (Martens & Næs, Reference Martens and Næs1989). The number of samples used and spectra collected for the calibration and validation sets, number of spectra removed from the analysis, ranges analyzed, mathematical treatment, data pre-processing and PLS- factors are presented in Table 1. For the definition of a classification model, seven strains were selected for its calibration (4 Lb. kefir and 3 non-Lb. kefir) and fifteen for the validation set (10 Lb. kefir and 5 non-Lb. kefir), being calibration and validation sets independent of each other. Figures 5. A, B & C depict the classification models performed in the whole spectral range (1800–400 cm−1), as well as in the 1700–1500 and 1500–1185 cm−1 ranges.
PLS-DA prediction results for Raman spectra obtained from lactobacilli. ▲ corresponds to Lb. kefir strains, ○, to non- Lb. kefir strains. A: whole range (1800–400 cm−1), B: 1700–1500 cm−1 and C: 1500–1185 cm−1.

It is clear from the data that the 1700–1500 cm−1 region is the one where the most accurate prediction can be made (Fig. 5B, Table 2). This result confirms those obtained with the PCA and the visual observation of raw spectra. Note that the plot corresponding to the classification model performed in this region is very similar to that showing the classification using the whole spectra (Fig. 5A). This indicates that the bands allowing discrimination in the 1700–1500 cm−1 range are the most relevant in lactobacilli whole spectra. Besides that, the results also suggest that PC1 in the 1700–1500 cm−1 range is the component containing species specific information. Since the amide I (arising mainly from amide C=O stretching vibration) has the main contribution in this region, these results indicate that the discrimination between Lb. kefir and non-Lb. kefir strains is somehow influenced by their protein composition and/or structure. Further studies should investigate in which way the composition of proteins determines these species differences.
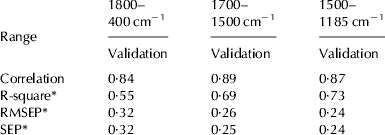
Statistical values calculated in the validation step for the three classification models calibrated in the regions showing the best discrimination in PCA

* R-square: Coefficient of determination; RMSEP: Root Mean Square Error of Prediction; SEP: Standard Error of Performance
In order to evaluate the potential for classification of the three regions showing the best discrimination capacity between Lb. kefir and non-Lb. kefir groups in PCA (1800–400, 1700–1500 and 1500–1185 cm−1), the three classification models (one for each of the three regions) were calibrated and validated. The values of correlation, R-square, RMSEP and SEP computed for each model, are displayed in Table 2.
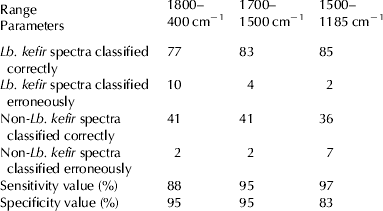
In spite of the occurrence of a few sample mismatches, observed in Fig. 5, a good discrimination between Lb. kefir and non-Lb. kefir groups was observed, in particular in the 1700–1500 cm−1 region. Table 3 depicts the number of spectra correctly and incorrectly classified as Lb. kefir and non-Lb. kefir, as well as the calculated sensitivity and specificity percentages. It is important to point out the high specificity and sensitivity achieved for the classification of Lb. kefir and non-Lb. kefir strains (95% in the 1700–1500 cm−1 region), which denotes the accuracy of the developed model to correctly classify the spectra belonging to Lb. kefir strains.
Sensitivity and Specificity values calculated for the classification of bacteria in terms of its Raman spectra using three classification models calibrated in three different regions

As a final remark, it must be underlined that the supervised method used in this work represents a useful tool for the quick discrimination of unknown samples. The high specificity and sensitivity of the method, in particular in the 1700–1500 cm−1 region, confirm this model as an important tool for the classification of new strains. This way, the registration of a Raman spectrum would be enough to: a) decide if the sample belongs or not to Lb. kefir group, and in a second step, b) investigate if it belongs to Lb. parakefir or Lb. brevis group.
This work was supported by Agencia Nacional de Promoción Científica y Tecnológica, Argentina (Project PICT/2006/68), PROMEP, Mexico (Project UAZ-PTC-092) and CONACyT, Mexico [Project No. 119491 (2009)], CYTED Program (Ciencia y Tecnología para el Desarrollo) Network P108RT0362 and CONACyT-CONICET (México, Argentina) (bilateral project res. Nº 962/07-05-2009). AGZ and PM are members of the research career CONICET (National Research Council, Argentina). GDA is member of the research career CIC-PBA (Commission for Scientific Research, Buenos Aires). A.L. is doctoral fellow from CONICET.