Implications
Livestock production has been a significant contributor to greenhouse gas (GHG) production globally. This study has quantified how selection for conventional estimated breeding values incorporated into both maternal and terminal selection indexes in Ireland will lead to industry-wide reductions in CO2 equivalents per kilogram of beef produced. The gains are achieved through increases in the amount of meat produced per calf (terminal index selection) and through improved survival and reproduction rates of cows (maternal index selection).
Introduction
There is a growing body of research globally demonstrating that genetic gains in livestock production efficiency traits can also drive improvements in GHG emissions when expressed on a per-animal or intensity basis (i.e. CO2 equivalent emissions per unit of product) (e.g. Wall et al., Reference Wall, Simm and Moran2010b; Capper, Reference Capper2011; Hayes et al., Reference Hayes, Lewin and Goddard2013; Pickering et al., Reference Pickering, Oddy, Basarab, Cammack, Hayes, Hegarty, Lassen, McEwan, Miller, Pinares-Patiño and de Haas2015). In 2013, Irish agriculture was estimated to produce total GHG emissions of 18 965 kt CO2e (Duffy et al., Reference Duffy, Hanley, Black, O’Brien, Hyde, Ponzi and Alam2015). Ruminant livestock are major sources of the most significant GHG, methane, which is a by-product of enteric fermentation. Most (56%) of agricultural CH4 was produced from enteric fermentation, with a smaller contribution (6%) from manure (Duffy et al., Reference Duffy, Hanley, Black, O’Brien, Hyde, Ponzi and Alam2015). The Irish government through the Beef Data and Genomics Programme (BDGP) has recognized that genetic improvement of beef cattle has a key role in reducing GHG emissions while maintaining a vibrant rural sector within the economy (Department of Agriculture, Food and the Marine, 2017). The BDGP is a major initiative to support farmer driven reductions in emissions including a drive for accelerated genetic progress for maternal efficiency traits expressed by suckler cows. To underpin this investment, the potential impacts and gains in GHG emissions must be quantified based on current and projected future rates of genetic gain.
Study objectives
The objectives of this study were to quantify the influences of each trait in Irish Cattle Breeding Federation (ICBF) Maternal Replacement (MR) and Terminal (T) indexes on system-wide gross GHG emissions and GHG emissions intensity (EI), and then to predict the overall effects of genetic change from index selection on system-wide EI. Implications for incorporating an EI reduction index to the current production indexes and long-term projections for national breeding programs were explored.
Material and methods
Selection indexes
The ICBF beef MR index is an economic selection index that weights and combines genetic evaluations for eight market offspring traits: calving difficulty, gestation length, mortality, carcass weight, carcass conformation, carcass fat, feed intake and docility; plus nine cow traits: survival, calving interval, age at first calving, maternal weaning weight, maternal calving difficulty, cow live weight (LW), heifer LW, cull cow carcass weight and docility. The majority (71%) of emphasis in this index is on maternal traits, with the assumption that a very high proportion of daughters of bulls selected using this index enter the cow herd as replacement breeding females. The T index contains only the previously listed eight market offspring traits, with the assumption that all progeny from bulls selecting using this index will be terminal crosses sold to slaughter.
Calculation of gross emissions from feed intake
Methane production from individual cattle depends on age, weight, and feed quality and quantity. The conversion of feed to CH4 emissions and CO2 equivalents in beef cattle has been quantified from feed energy contents, CH4 production and CH4 to CO2e ratio in various studies (e.g. O’Mara, Reference O’Mara2006; Wall et al., Reference Wall, Ludemann, Jones, Audsley, Moran, Roughsedge and Amer2010a; Fennessy et al., Reference Fennessy, Byrne and Proctor2015). For this study, the output of CO2 equivalents from feed intake in beef cattle was estimated to be 0.583 kg CO2e/kg dry matter (DM), as per Fennessy et al. (Reference Fennessy, Byrne and Proctor2015). This constant conversion rate was assumed to hold for all feed types and was calculated from feed gross energy content of 18.4 MJ/kg DM, of which 7% is lost to CH4 production, CH4 energy content of 55.2 MJ/kg CH4 and known ratio of 25 kg CO2e/kg CH4. This value is similar to 0.0216 kg CH4/kg DM×25 kg CO2e/kg CH4=0.540 kg CO2e/kg DM used by O’Mara (Reference O’Mara2006).
Models for gross emissions
The methodology for calculating the impacts of individual genetic trait changes on system-wide GHG EI (kg CO2e/kg product) was based on the framework approach described by Amer et al. (Reference Amer, Hely, Quinton and Cromie2017). However, this methodology also computes gross emissions (GE; kg CO2e) by default and so these are first provided.
System-wide total GE (∑e, kg CO2e/breeding cow per year) were calculated as follows:
 $$\mathop{\sum}e \,{\equals}\,\left( {o{\times}e_{{{\rm offspring}}} } \right){\plus}\left( {r{\times}e_{{{\rm replace}}} } \right){\plus}\left( {e_{{{\rm cow}}} } \right)$$
where o is the number of slaughtered offspring/breeding cow per year, r the number of replacements reared/breeding cow per year, e offspring the GE/slaughtered offspring over its lifetime, e replace the GE/replacement over her total rearing period until she becomes a breeding cow and e cow the GE/breeding cow per year. These factors were all considered to be functions of the index genetic traits g; that is, o(g), r(g), e offspring(g), e replace(g) and e cow(g). Average system values for these factors were estimated as described below.
Average number of slaughtered offspring was o=0.6 offspring slaughtered/cow per year, based on 0.8 calves/breeding cow per year, of which all males and half of females are slaughtered. Average number of replacements reared was r=0.20 replacements/breeding cow per year.
Average GE were calculated from feed intake. Average slaughtered offspring feed was 3 970.6 kg DM/animal, based on 75% steers each fed 4120.0 kg DM to 20 months of age, plus 25% heifers each fed 3522.4 kg DM to 26 months of age. Average replacement heifer feed was 3522.4 kg DM/animal, based on heifer feed to 26 months. Average breeding cow feed was 2874.6 kg DM/year. Applying the conversion of 0.583 kg CO2e/kg DM, then e offspring=2314.9 kg CO2e/slaughtered offspring, e replace=2053.6 kg CO2e/replacement and e cow=1675.9 kg CO2e/breeding cow per year. Therefore, average total system-wide GE was Σe=3475.5 kg CO2e/breeding cow per year.
Maternal replacement index
The change in system-wide GE per change in each MR index trait was calculated as the partial derivative of ∑e, with respect to each genetic trait g MR (dΣe/dg MR), as follows:
 $$\eqalignno{{{d\mathop{\sum}e } \over {dg_{{{\rm MR}}} }}\,\approx\, & \left[ {\beta _{{e.{\rm offspring}}} \left( g \right){\times}o} \right]{\plus}\left[ {\beta _{o} \left( g \right){\times}e_{{{\rm offspring}}} } \right]\cr & {\plus}\left[ {\beta _{{e.{\rm replace}}} \left( g \right){\times}r} \right]{\plus}\left[ {\beta _{r} \left( g \right){\times}e_{{{\rm replace}}} } \right]{\plus}\beta _{{e.{\rm cow}}} \left( g \right)$$
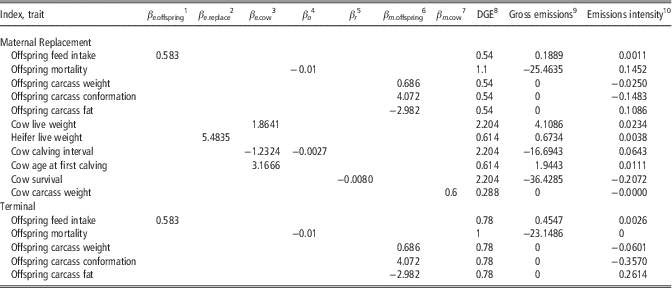
where for each trait, β e.offspring(g), β e.replace(g) and β e.cow(g) are traits effects on GE per slaughtered offspring over its lifetime, per replacement reared from birth until she becomes a breeding cow and per breeding cow per year, respectively; and β o (g) and β r (g) are trait effects on number of offspring reared and number of replacement heifers required/breeding cow per year, respectively. To account for differential expression within the system, each trait d∑e/dg MR value was multiplied by the trait number of discounted genetic expressions per year (DGE) (Table 1; Amer et al., Reference Amer, Simm, Keane, Diskin and Wickham2001).
Maternal replacement and terminal index traits estimated effects on emissions per animal, numbers of animals and meat production per animal, and effects on total system-wide yearly gross emissions and emissions intensity

1 Effect of trait change on per-offspring gross emissions (kg CO2e/animal per trait unit).
2 Effect of trait change on per-replacement heifer gross emissions (kg CO2e/animal per trait unit).
3 Effect of trait change on per-cow gross emissions (kg CO2e/animal per trait unit).
4 Effect of trait change on number of offspring per breeding cow (n/breeding cow per year per trait unit).
5 Effect of trait change on number of replacements per breeding cow (n/breeding cow per year per trait unit).
6 Effect of trait change on per-offspring meat produced (kg meat/animal per trait unit).
7 Effect of trait change on per-cow meat produced (kg meat/animal per trait unit).
8 Trait number of discounted genetic expressions per year.
9 Effect of trait change on total system gross emissions (kg CO2e/breeding cow per year per trait unit).
10 Effect of trait change on system emissions intensity (kg CO2e/kg meat per breeding cow per year per trait unit).
Terminal index
For the T index, effect on system-wide emissions/breeding cow per year was assumed to be simply the sum of offspring emissions. Therefore, change in system-wide GE per change in each T index trait was the partial derivative of Σe with respect to each genetic trait g T (dΣe/dg T), as follows:
 $${{d\mathop{\sum}e } \over {dg_{{\rm T}} }}\,\approx\,\left[ {\beta _{{e.{\rm offspring}}} \left( g \right){\times}o} \right]{\plus}\left[ {\beta _{o} \left( g \right){\times}e_{{{\rm offspring}}} } \right]$$
where all variables were as previously defined. All calves were assumed to be sent to slaughter and therefore o=1 offspring slaughtered/cow per year. Other average values were as previously described. Each trait d∑e/dg T value was multiplied by the trait DGE (Table 1; Amer et al., Reference Amer, Simm, Keane, Diskin and Wickham2001).
Effects of index traits on per-animal feed intake and gross emissions
The estimated relationship between feed intake and CO2e was used as a basis to predict how changes in each index trait affect individual feed intake and therefore indirectly affect GEs. Index trait values for β e.offspring(g), β e.replace(g) and β e.cow(g) that are described below are summarized in Table 1.
Offspring feed intake is defined as daily feed intake over the lifetime of a slaughter animal, with an age-constant slaughter endpoint. Average effect was assumed to be β e.offspring(feed intake)=0.583 kg CO2e/kg DM (Fennessy et al., Reference Fennessy, Byrne and Proctor2015).
Cow LW effect on GE was calculated from maintenance feed energy requirements. Assuming 0.55 MJ metabolizable energy (ME)×LW0.75 per day and 9 MJ ME/kg DM feed, the difference in feed between a 700 kg cow (3036 kg DM) and a 800 kg cow (3355 kg DM) was 3.197 kg DM/kg LW. This converts to average β e.cow(cow live weight)=1.864 kg CO2e/kg LW per year.
Heifer LW effect on GE was calculated from replacement heifer feed requirements in early- and late-maturing systems. Assuming maintenance energy requirement of 0.55 MJ ME×LW0.75, growth energy requirement between 0.0742×LW+15.373 and 0.0985×LW+15.746 MJ ME/kg gain depending on time to maturity, 9.5 MJ ME/kg DM and that 72% of systems are early maturing, the difference in replacement feed between a 700 kg cow (5164 kg DM and 4704 kg DM for early and late maturing breeds, respectively) and a 800 kg cow (6146 kg DM and 5538 kg DM for early and late maturing breeds, respectively) was 9.406 kg DM/kg LW. This converts to average β e.replace(heifer live weight)=5.483 kg CO2e/kg LW per year.
Cow calving interval effect on GE was calculated from the change in number of calves produced per year and the additional cow feed required to produce those calves. Each 1-day increase in calving interval decreases pregnancies by 0.0027 pregnancies/year. At 93% calf survival rate, this corresponds to 0.0025 fewer calves/year. Assuming average cow maintenance feed requirement of 1982.5 kg DM/year and proportional increase in feed required for gestation and lactation is 0.45, additional feed required to produce one calf is 829.7 kg DM/year. Therefore, a 1-day increase in calving interval translates to 829.7 kg DM×−0.0025 calves= −2.114 kg DM/year. This converts to average β e.cow(calving interval)= −1.232 kg CO2e/day calving interval.
Cow age at first calving effect on GE was calculated from the additional feed required for maintenance of a mature cow for each day of delay until first calving. Assuming maintenance feed requirement of 5.432 kg DM/day, this converts to average β e.cow(age at first calving)=3.167 kg CO2e/day of age at first calving.
Other index traits were assumed to have zero effect on per-animal feed intake and emissions (see ‘Discussion’ section for details).
Effects of index traits on system structure
Traits below were assumed to affect system population structure by affecting numbers of offspring and replacement heifers. Index trait values for β o (g) and β r (g) that are described below are summarized in Table 1.
Offspring mortality affected number of offspring and was assumed to be β o (calf mortality)= −0.01 calves sold/cow per % mortality; that is, a 1% increase in mortality decreased number of offspring per cow by 1%.
Cow calving interval affected number of offspring and was assumed to be β o (calving interval)=−1/365=−0.0027 calves sold/cow per year per day calving interval.
Cow survival was assumed to influence the number of replacement heifers required to maintain constant herd size. As per Amer et al. (Reference Amer, Simm, Keane, Diskin and Wickham2001), two herds were modelled with a 1% difference in cow survival. Weighted average survival over the first three parities (aged 3, 4 and 5 years) and proportion of replacement heifers (first calvers) were calculated for each herd. The difference in proportion replacements in the two herds was −1% replacements per 1.24% increase in survival (Amer et al., Reference Amer, Simm, Keane, Diskin and Wickham2001), which translates to −0.00805 replacements/cow in the herd per 1% increase in survival breeding value. Therefore, β r (cow survival)=−0.00805 replacement heifers required/% survival.
Models for emissions intensity
System-wide EI (kg CO2e/kg meat per breeding cow per year) was calculated as the sum of all system GEs divided by the sum of all meat produced in the system (Σm), as follows:
 $$EI\,{\equals}\,{{\mathop{\sum}e } \over {\mathop{\sum}m }}\,{\equals}\,{{\left( {o{\times}e_{{{\rm offspring}}} } \right){\plus}\left( {r{\times}e_{{{\rm replace}}} } \right){\plus}\left( {e_{{{\rm cow}}} } \right)} \over {\left( {o{\times}m_{{{\rm offspring}}} } \right){\plus}\left( {m_{{{\rm cow}}} } \right)}}$$
where m offspring is the product output (kg meat) per slaughtered offspring, m cow the product output (kg meat) per breeding cow per year and other variables as previously defined. These factors were considered as functions of the index genetic traits g; that is, m offspring(g) and m cow(g).
Maternal replacement index
The change in EI per change in each MR index trait was calculated (following Amer et al., Reference Amer, Hely, Quinton and Cromie2017) as the partial derivative of EI with respect to each index trait g MR (dEI/dg MR), as follows:
 $${{dEI} \over {dg_{{{\rm MR}}} }}\,\approx\,{{\rm 1} \over {\mathop{\sum}m }}\left\{ {\matrix{ {\left[ {\beta _{{e.offspring}} \left( g \right){\times}o} \right]{\plus}\left[ {\beta _{{e.replace}} \left( g \right){\times}r} \right]{\plus}\beta _{{e.cow}} \left( g \right)} \hfill \cr {{\minus}\left[ {\beta _{{m.offspring}} \left( g \right){\times}o{{\mathop{\sum}e } \over \vskip2pt{\mathop{\sum}m }}} \right]{\minus}\left[ {\beta _{{m.cow}} \left( g \right){\times}{1 \over {\mathop{\sum}m }}} \right]} \hfill \cr {{\plus}\left[ {\beta _{r} \left( g \right){\times}e_{{replace}} } \right]{\plus}\left[ {\beta _{o} \left( g \right){\times}\left( {e_{{offspring}} {\minus}m_{{offspring}} {{\mathop{\sum}e } \over {\mathop{\sum}m }}} \right)} \right]} \hfill \cr } } \right\}$$
where for each trait, β m.offspring(g) is the trait effect on kg meat produced per slaughtered offspring, β m.cow(g) the trait effect on kg meat produced per breeding cow per year, β r (g) the trait effect on number of replacement heifers reared per breeding cow per year, β o (g) the trait effect on number of slaughtered offspring per breeding cow per year and other variables are as previously defined. Full derivation of this equation is described in Amer et al. (Reference Amer, Hely, Quinton and Cromie2017). Each trait dEI/dg MR value was multiplied by the trait DGE (Table 1; Amer et al., Reference Amer, Simm, Keane, Diskin and Wickham2001).
Average product output per slaughtered offspring (m offspring) was calculated from average steer carcass weight of 342 kg, assuming 0.686 kg meat/kg carcass; therefore m offspring=234.61 kg meat/offspring. Average product output per breeding cow (m cow) was calculated from average cull cow carcass weight of 340 kg, assuming 0.6 kg meat/kg carcass and that 17% of cows are culled per year; therefore, m cow=35.09 kg meat/breeding cow per year.
Applying the above values, total system-wide meat product per average breeding female was Σm MR=175.9 kg meat/breeding cow per year and average system-wide EI=19.76 kg CO2e/kg meat per breeding cow per year.
Terminal index
The change in EI per change in each T index trait was calculated (following Amer et al., Reference Amer, Hely, Quinton and Cromie2017) as the partial derivative of EI with respect to each index trait g T(dEI/dg T), as follows:
 $${{dEI} \over {dg_{T} }}\,\approx\,{{\rm 1} \over {\mathop{\sum}m }}\left( {\beta _{{e.{\rm offspring}}} \,{\minus}\,\beta _{{m.{\rm offspring}}} {{\mathop{\sum}e } \over {\mathop{\sum}m }}} \right)$$
where all variables were as previously defined. Each trait d∑EI/dg T value was multiplied by the trait DGE (Table 1; Amer et al., Reference Amer, Simm, Keane, Diskin and Wickham2001).
Effects of index traits on per-animal meat produced
In addition to the traits affecting per-animal GE and population structure, the following traits were assumed to influence EI by changing per-animal amount of meat produced.
Offspring carcass weight directly affects kg meat produced per offspring animal. Average change in offspring meat product output was assumed to be β m.offspring(carcass weight)=0.686 kg meat/kg carcass (Drennan et al., Reference Drennan, McGee, Conroy, Keane, Kenny and Berry2009) per slaughtered offspring in the current system with age-constant slaughter endpoint. This only applies for an age-constant slaughter endpoint; under a weight-constant endpoint, there would be no difference in carcass weight per offspring animal.
Offspring carcass conformation score affects proportion of meat in the carcass such that higher score results in more product for a fixed carcass weight. Meat proportion was assumed to increase by 0.0112 kg meat/kg carcass per conformation score (Drennan et al., Reference Drennan, McGee, Conroy, Keane, Kenny and Berry2009). Assuming average meat proportion of 0.686 kg meat/kg carcass, an average 363.61 kg carcass produces 249.43 kg meat; a 1-point increase in conformation score increases this to 253.51 kg meat. Therefore, average change in offspring meat product β m.offspring(conformation)=4.072 kg meat/conformation score per slaughtered animal.
Offspring carcass fat score affects proportion of meat in the carcass such that higher score results in less product for a fixed carcass weight. Meat proportion was assumed to decrease by −0.0082 kg meat/kg carcass per fat score (Drennan et al., Reference Drennan, McGee, Conroy, Keane, Kenny and Berry2009). Assuming the same average meat proportion and carcass weight described above, a 1-point increase in fat score decreases meat produced to 246.45 kg. Therefore, average change in offspring meat product β m.offspring(fat)=−2.982 kg meat/fat score per slaughtered animal.
Cow carcass weight directly affects the kg of meat produced per cull cow. Change in cow meat product output was assumed to be β m.cow(cow carcass weight)=0.6 kg meat/kg cull cow carcass.
Response to index selection
Trait-wise yearly responses in GE and EI from index selection were calculated from trait d∑e/dg and d∑EI/dg for each index, multiplied by the predicted response of the trait per unit of genetic change achieved in the index from selection on the index. Values were then summed over all traits to obtain total responses in GE and EI per unit of genetic gain in selection index.
Trait responses to index selection (trait unit/€ index value; Table 2) were predicted from linear regression of individual bulls’ proofs for each index trait to their MR or T index value (as per method proposed by Amer et al., Reference Amer, Hely, Quinton and Cromie2017). Regression analyses were undertaken separately for groups of proven artificial insemination (AI) bulls (average age 15 years) and young bulls (age 2 years), both across all breeds and within breeds. The resultant four regression coefficients per trait were combined in a weighted aggregate coefficient that put 50% weighting each on within- and across-breed coefficients, then 70% weight on AI bulls and 30% weight on young bulls’ coefficients (Supplementary Table S1). These aggregate regression coefficients predicted the direction and magnitude of change in each trait associated with index selection.
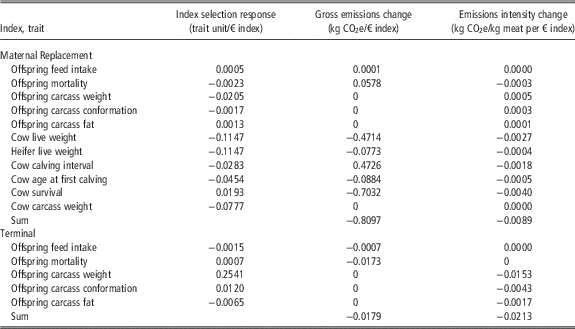
Expected trait responses to index selection, and expected responses in gross emissions (kg CO2e/breeding cow per year) and emissions intensity (kg CO2e/kg meat per breeding cow per year) per € change in Maternal Replacement and Terminal index value for each trait

Results
Effects of index traits on system gross emissions
Estimated effects of trait changes on system GE are summarized in Table 1. Offspring feed intake, cow and heifer LWs, and cow age at first calving had numerically positive relationships with system GE, meaning that increasing values for these traits were predicted to increase system kg CO2e/breeding cow per year. Offspring mortality, cow calving interval and cow survival had numerically negative relationships with system GE, meaning that increasing values for these traits were predicted to reduce system kg CO2e/breeding cow per year.
Effects of index traits on system emissions intensity
Estimated effects of trait changes on system EI are summarized in Table 1. Offspring feed intake, offspring mortality, offspring carcass fat, cow and heifer LWs, cow calving interval and cow age at first calving had numerically positive relationships with system EI, meaning that increasing values for these traits were predicted to increase system kg CO2e/kg meat per breeding cow per year. Offspring carcass weight, carcass conformation and cow survival had numerically negative relationships with system EI, meaning that increasing values for these traits were predicted to reduce system kg CO2e/kg meat per breeding cow per year.
Trait expected responses to index selection
Expected responses of traits to index selection are summarized in Table 2, estimated as weighted aggregate changes in trait per change in index value (Supplementary Table S1). In the MR index, offspring feed intake, offspring carcass fat and cow survival had numerically positive relationships with index value and were therefore expected to increase in value with genetic gain in this index. Offspring mortality, offspring carcass weight and conformation, cow and heifer LWs, calving interval, age at first calving and cow carcass weight had numerically negative relationships with MR index value and were therefore expected to decrease in value with genetic gain in the index. In the T index, mortality, carcass weight and conformation had numerically positive relationships with index value and were therefore expected to increase with T index gain; whereas feed intake and carcass fat had numerically negative relationships index value and were therefore expected to decrease in value with T index gain.
Gross emissions response to index selection
Maternal Replacement index expected changes of increased offspring feed intake, decreased offspring mortality and shorter cow calving interval were predicted to increase system GE (observed as positive kg CO2e/breeding cow per year per € index; Table 2). These were offset by expected decreases in cow and heifer LWs, decreased age at first calving and increased cow survival that were predicted to reduce system GEs (observed as negative kg CO2e/breeding cow per year per € index; Table 2). Cow LW, calving interval and survival had the greatest effects on system GE, while other traits had comparatively minor effects. Summed over responses in all traits, system GEs were predicted to be reduced 0.810 kg CO2e/breeding cow per year per € index (Table 2).
Terminal index expected changes of decreased feed intake and increased offspring mortality were predicted to reduce system GE (observed as negative kg CO2e/breeding cow per year per € index), with a smaller total system reduction of 0.018 kg CO2e/breeding cow per year per € index (Table 2).
Emissions intensity response to index selection
Maternal Replacement index expected changes of increased offspring feed intake, decreased offspring carcass weight and conformation, increased offspring carcass fat and decreased cow carcass weight were predicted to increase system EI (observed as positive kg CO2e/kg meat per breeding cow per year per € index; Table 2). These were offset by expected decreases in offspring mortality, cow and heifer LWs, cow calving interval and age at first calving, and increased cow survival that were predicted to reduce system EI (observed as negative kg CO2e/kg meat per breeding cow per year per € index; Table 2). Similar to GE responses, cow LW, calving interval and survival had the greatest effects on system EI, while other traits had comparatively minor effects. Summed over responses in all traits, system EI was predicted to be reduced 0.009 kg CO2e/kg meat per breeding cow per year per € index (Table 2).
Terminal index expected changes of decreased feed intake and carcass fat and increased carcass weight and conformation were predicted to reduce system EI (observed as negative kg CO2e/kg meat per breeding cow per year per € index), with a larger total system reduction of 0.021 kg CO2e/kg meat per breeding cow per year per € index (Table 2). For this index, offspring carcass weight had the greatest effect on system EI.
Discussion
In this study, genetic changes from selection with the ICBF beef MR and T indexes were predicted to reduce both system-wide gross GHG emissions (kg CO2e/breeding cow) and system-wide GHG EI (kg CO2e/kg meat per breeding cow). There is currently a global drive toward identifying accurate and practical methods for individual genetic evaluation for methane production (reviewed by Pickering et al., Reference Pickering, Oddy, Basarab, Cammack, Hayes, Hegarty, Lassen, McEwan, Miller, Pinares-Patiño and de Haas2015). In future, such evaluations could be incorporated into national breeding objectives to achieve greater GHG reductions. In the meantime, it is important to quantify the effects of present efforts. The findings here are consistent with several studies which identified and quantified GHG emissions benefits arising from productivity and efficiency gains over time. Pickering et al. (Reference Pickering, Oddy, Basarab, Cammack, Hayes, Hegarty, Lassen, McEwan, Miller, Pinares-Patiño and de Haas2015) noted that methane and other GHG production has declined per unit of product over the past 50 years in ruminant livestock industries. Capper (Reference Capper2011) calculated US beef in 2007 had a 16% reduction of CO2e per kg of beef produced compared with 1977, which was attributed to reduced and improved feed, changes in industry structure and improved genetics.
Generally, increasing growth rate and numbers of animals (i.e. calves weaned from a fixed number of cows) in a system will increase overall feed intake and resultant absolute or gross GHG produced by the system. This gross production increase contributes to the supply of food needed by a growing human population. However, genetic and management improvements have also increased system-wide production efficiency, meaning that proportionally more product is made per unit feed input. This comes from more efficient feed utilization into meat product on an individual animal basis, plus improved reproductive and survival rates that mean each breeding animal can produce more output-generating animals into the whole system. Given that human requirements for animal product will continue to rise with growing population numbers, a more informative measure of the effect of genetic improvement of beef cattle is system-wide GHG EI that considers both improved feed utilization of individual animals and improved total system meat production rate.
Gross emissions response to index selection
The MR index was predicted to reduce system gross GHG emissions by 0.810 kg CO2e/breeding cow per year per € index (Table 2). This reduction was largely driven by improvement in cow survival, which was assumed to reduce the number of replacement heifers reared in the system and accordingly reduced total replacement heifer emissions. System GE was also reduced by decreased cow LW, which reduced mature cow maintenance feed and associated emissions. However, this effect was offset by shortened calving interval that increased cow feed requirements and resultant emissions, as well as number of offspring produced per cow and accordingly total offspring emissions. Compared to these three traits, other MR traits that affected system GE (offspring feed intake, offspring mortality, heifer LW and age at first calving) had only minor effects.
The T index was also predicted to reduce system gross GHG emissions (by 0.018 kg CO2e/breeding cow per year per € index; Table 2), but for different reasons. In the T index, the reduction was largely driven by increased offspring mortality which reduced the number of offspring in the system and accordingly reduced total offspring emissions. Increasing calf mortality is not a desirable trend from a production or animal welfare point of view and breeding programs should work to reverse this. This highlights the deficiency of taking a pure GEs perspective when breeding for reduced methane output. The other trait affecting GE in the T index was the very slight decrease in offspring feed intake. Although there was a numeric reduction in GE from the T index, from a practical perspective with a long-term goal of improving calf survival this should be considered a neutral effect at best.
Other index traits were assumed to have zero effect on gross GHG emissions. In the age-constant slaughter system modelled, offspring carcass weight, conformation and fat were assumed to have zero effect on per-animal emissions independent of offspring feed intake that is already in the index. Similarly, cull cow carcass weight was assumed to have zero effect on per-animal emissions independent of cow LW that contained maintenance feed required. Maternal weaning weight was assumed to have zero effect on GEs. The rationale was that a larger weaned calf that received more milk would require less time to reach carcass weight endpoint, which would reduce its post-wean daily feed (concentrate) inputs and consequent GHG emissions, but this is likely to be balanced out by increased feed required by the lactating cow and her resultant higher GHG emissions. Therefore, the combined CO2e from weaned calf and lactating cow may not change substantially with maternal weaning weight. Finally, it is unclear how calving difficulty, gestation length or docility might affect per-animal feed intake or system numbers of offspring or replacements.
Comparison of the values found in this study with others’ is difficult, due to different methodologies. Wall et al. (Reference Wall, Ludemann, Jones, Audsley, Moran, Roughsedge and Amer2010a) estimated effects of trait change on gross CO2e emissions in beef cattle within a weight-constant slaughter system. In agreement with the current study, they estimated that breeding goals resulting in decreasing mature cow weight, earlier age at first calving and decreasing feed consumption (considered as residual feed intake) would reduce GEs, while increasing calf survival would increase GEs. However, they estimated that shortening calving interval would also reduce GEs by reducing the number of empty days fed (Wall et al., Reference Wall, Ludemann, Jones, Audsley, Moran, Roughsedge and Amer2010a); this differs from the estimate in the current study where shortening calving interval was assumed to increase emissions through higher feed requirements of gestating/lactating cows and greater number of offspring produced per year. The importance of cow survival found in the current study agrees with the estimate by Wall et al. (Reference Wall, Ludemann, Jones, Audsley, Moran, Roughsedge and Amer2010a) that improved sheep ewe longevity reduced GEs.
Emissions intensity response to index selection
The MR index was predicted to reduce system GHG EI by 0.009 kg CO2e/kg meat per breeding cow per year per € index (Table 2). This reduction was largely driven by improvement in cow survival and decreased cow LW that reduced GEs as described above. However, shorter calving interval also contributes to reduced EI. Although shortened calving interval increased GE via higher cow and total offspring emissions as described above, the increased number of offspring also increased total meat produced per cow; the net effect of these was a reduction in the system ratio of kg emissions to kg meat produced. A similar, but minor effect was observed for improved (reduced) offspring mortality: although increased number of offspring increased GE, meat production also increased to generate a better system-wide EI. Offspring carcass traits (carcass weight, conformation and fat) were not expected to improve in response to selection on the MR index and therefore had minor effects of increasing system EI. Other traits (offspring feed intake, heifer LW and age at first calving) had only minor effects on EI.
The T index was also predicted to reduce system GHG EI (by 0.021 kg CO2e/kg meat per breeding cow per year per € index; Table 2), driven by increased meat production from improvements in offspring carcass weight, conformation and fat. Reduced offspring feed intake made only a very minor contribution to reducing EI. In contrast to GE, change in offspring mortality had zero effect on system EI because changes in number of offspring equally affected GE and meat produced from offspring; that is, number of offspring was in both the numerator and the denominator of the EI equation and therefore cancelled out.
Other index traits (calving difficulty, gestation length, docility and maternal weaning weight) are unlikely to have any independent effects on per-animal meat produced. Since these other traits were also assumed to have zero effect on per-animal feed intake or system numbers of offspring or replacements as previously described, they had zero effect on EI.
Selection for long-term genetic improvement of emissions
Evaluation with emissions intensity index
The values in this study offer a potential method to evaluate individual bulls for GHG emissions. An EI index could be built as the sum of trait estimated breeding values each weighted by the trait yearly effects on system EI (Table 2). By linking such an EI index in the national database, farmers could be rewarded for using low emissions bulls in the calculation of the carbon footprint for their farm. However, this emissions-only index would not consider trait economics. A more practical index for breeding would combine economics of production from the MR index with the EI changes. Because these indexes differ in terms of the relative importance applied to each trait and the overall direction of desired change, potential trade-offs between direct farm profit improvement and EI improvement must be evaluated when weighting these in a combined index. An economic approach could be to weight EI in a combined index according to the social cost of carbon, but determining a suitable carbon price is not straightforward (Wall et al., Reference Wall, Ludemann, Jones, Audsley, Moran, Roughsedge and Amer2010a) and may require a very high carbon price to have a meaningful effect on emissions (Alcock et al., Reference Alcock, Harrison, Rawnsley and Eckard2015).
An alternative approach such as desired gains (see e.g. Gibson and Kennedy, Reference Gibson and Kennedy1990) would involve testing weightings of the EI index v. a profit index, to find an optimum favourable balance that would yield meaningful response in EI while only decreasing the profit response by an amount deemed acceptable. In an associated study, a range of combined indexes were created as weighted sums of the MR index and the EI index as described above, placing increasing weight on the EI index. Combined index values were calculated for the groups of evaluated AI and young bulls previously described and these were correlated with individual separate MR index and EI index values (Supplementary Figure S1). Increasing the weighting on the EI index from 0 to 80 yielded the highest returns in terms of increasing the response in EI reduction without substantially decreasing the profit response. For example, a weighting of 60 on the EI index led to a 16% increase in EI response with only a 4% decrease in profit response in the MR index. This was a relatively small genetic trade-off in profitability for a significant improvement in EI.
National breeding programme strategies
Genetic change from selection generates permanent and cumulative effects on traits and therefore system-wide reductions in GHG emissions achieved through selection will continue over generations. Genetic trends resulting from selection with the MR index and effects of the introduction of the Irish BDGP have been predicted (Hely and Amer, Reference Hely and Amer2016; Hely et al., Reference Hely, Amer, Quinton, Byrne and Cromie2016). Applying the result from this study of predicted reduction in system EI of 0.009 kg CO2e/kg meat per breeding cow per year per € MR index, the current trend of €1.67 improvement in average MR index/year (Hely and Amer, Reference Hely and Amer2016) was predicted to reduce annual CO2e emissions by 0.4% for a total reduction of 34 kt CO2e after 5 years, while maintaining a constant annual 155 kt meat production which is equivalent to a current herd size of 880 000 breeding cows (Supplementary Table S2). After 20 years, annual emissions were predicted to reduce by 1.5% for a total reduction of 481 kt CO2e, maintaining this constant annual meat production (Supplementary Table S2). Parameters and calculations for these predictions are provided in Supplementary Tables S3 and S4.
Greater improvements are projected from national strategies implementing genomics to improve accuracy and increased use of elite AI sires in the maternal beef breeding programme. A genomics selection scenario with increasing use of top progeny tested maternal AI bulls to 30% in pedigree herds and 20% in commercial suckler herds was predicted to increase the trend in MR index to €4.91 improvement per year, which translated to total reductions of 229 kt CO2e after 5 years (1.89% reduction in yearly CO2e) and 1952 kt CO2e after 20 years (5.4% reduction in yearly CO2e) while maintaining 155 kt annual meat production (Supplementary Table S2). In a maximum use scenario, with genomic selection and 50% use of elite AI sires in pedigree herds and 30% use of elite AI sires in commercial herds, an average trend of €9.04 improvement in MR index per year was projected, and a corresponding reduction of 350 kt CO2e would be expected after 5 years (3.1% reduction in yearly CO2e) and 3335 kt CO2e (9.5% reduction in yearly CO2e) after 20 years maintaining this fixed meat production (Supplementary Table S2). Parameters and calculations for these predictions are provided in Supplementary Tables S3 and S4.
Conclusions
This paper demonstrates that predicted rates of genetic gain in both maternal and terminal beef cattle indexes in Ireland should result in modest reductions of gross GHG emissions and more substantial reductions in GHG EI. The MR index was predicted to reduce system gross GHG emissions by 0.810 kg CO2e/breeding cow per year per € index and system GHG EI by 0.009 kg CO2e/kg meat per breeding cow per year per € index, mainly due to improvements in survival, maintenance feed requirements and calving interval. The T index was predicted to reduce system EI by 0.021 kg CO2e/kg meat per breeding cow per year per € index, due to improvements in meat production traits.
Acknowledgement
This work was funded by the European Union Rural Development Program, and the Irish Department of Agriculture, Food and the Marine.
Supplementary material
To view supplementary material for this article, please visit https://doi.org/10.1017/10.1017/S1751731117002373