

Political parties and citizens’ identification with them are fundamental forces in individual- and mass-level political behavior around the world. This research asserts that evolved psychological mechanisms shape partisan behavior as they do many other group-based behaviors. In particular, evolved cognitive mechanisms related to human sociality, coalitional psychology, and group behavior influence partisan citizens to exhibit intergroup discrimination shaped by in-group favoritism and out-group derogation. Evidence suggests that humans have cognitive mechanisms influenced by evolutionary forces to form into social groups. Reference Brewer, Ashmore, Jussim and Wilder1,Reference Brewer2,Reference Campbell3 Once in groups, they engage in adaptively influenced behaviors, Reference Efferson, Lalive and Fehr4,Reference Lopez, McDermott and Bang Petersen5,Reference Tooby, Cosmides and Price6 including intergroup discrimination. Reference Tajfel7,Reference Tajfel, Turner, Austin and Worchel8,Reference Turner9 Hinkle and Brown Reference Hinkle, Brown, Abrams and Hogg10 offered two exemplars of intergroup discrimination in the form of in-group favoritism and out-group derogation: school rivalries and political partisanship. For scholars of political behavior, the latter comes as no surprise. Partisan categorization is pervasive, and its use as a heuristic such as “Wall Street versus Main Street” and “liberal versus conservative” is difficult to avoid in the 24-hour political landscape. Reference Levin and Sidanius11,Reference Sidanius, Iyengar and McGuire12
Despite findings that individuals tend to rank the importance of partisan identity behind identities related to family, vocation, gender, and religion, Reference Smith13 partisan identity is as stable an identity as ethnicity and religion. Reference Green, Palmquist and Schickler14 Evidence suggests that it serves as a perceptual screen Reference Campbell, Converse, Miller and Stokes15 that influences the way individuals analyze and judge their environment and those around them. Reference Iyengar and Westwood16,Reference Kelly17,Reference Kuklinski and Hurley18 Few other identities elicit such strong emotional reactions, Reference Campbell, Converse, Miller and Stokes15,Reference Iyengar and Westwood16,Reference Huddy19 and some researchers suggest that “hostile feelings for the opposing party are ingrained or automatic.” Reference Iyengar and Westwood16
If the assertion is correct that partisan behavior is shaped by forces related to human evolution, then partisan citizens should exhibit adaptive preferences when making group-related political decisions. This study tests that assertion using individual assessments of the relative physical formidability of competing leaders, which research suggests is an important adaptive factor in leader evaluations. Reference Blaker, Rompa, Dessing, Vriend, Herschberg and van Vugt20,Reference Little, Burriss, Jones and Craig Roberts21,Reference McCann22,Reference Murray23,Reference Murray and David Schmitz24,Reference Re, DeBruine, Jones and Perrett25,Reference Sorokowski26,Reference Stulp, Buunk, Verhulst and Pollet27 According to some scholars, this preference for physically formidable leaders is borne out of the need for physically formidable combat allies in the violent ancestral environment in which individuals had to compete for and protect adaptively important resources such as food, shelter, and mates. Reference Murray23,Reference Murray and David Schmitz24
This article begins by offering a review of pertinent research regarding group-related behavior, including evolved and partisan behavior. Next it presents an overview of scholarship connecting political leadership to physical formidability. Then it details analyses of original data, including novel data generated from a drawing task, collected from student samples around the 2008 and 2012 U.S. presidential elections. The article goes on to report the results, which are mostly consistent with the expectations that group identity in the form of partisanship is associated with the exaggeration of the relative physical formidability of in-group versus out-group leaders. Finally, it concludes with speculation about why partisanship plays such a powerful role in political behavior.
In-groups, out-groups, and political groups
A number of evolutionary scholars argue that strong human sociality evolved to facilitate survival and reproduction in the early human environment. Reference Brewer, Ashmore, Jussim and Wilder1,Reference Brewer2,Reference Campbell3 That environment was harsh, and conflict and warfare were common Reference Chagnon28,Reference van Vugt, Hogan and Kaiser29 as individuals and groups competed for land, food, and status. Reference Bang Petersen, Delton, Robertson, Tooby and Cosmides30 These scholars suggest that individuals who joined in coalitions with others were more likely to achieve the fundamental evolutionary objectives of surviving (i.e., acquiring critical resources such as food, shelter, and protection) and reproducing (i.e., finding mates and rearing children) than individuals who remained unallied. Reference Brewer, Ashmore, Jussim and Wilder1,Reference Brewer2,Reference Campbell3 Because human ancestors benefited so greatly from group involvement, Reference Brewer, McGarty and Haslam31 evolutionary scholars have inferred that humans evolved a form of “ultrasociality” characterized by a tendency to enter into enduring alliances with other individuals. Reference Brewer, Ashmore, Jussim and Wilder1,Reference Campbell3,Reference Efferson, Lalive and Fehr4,Reference Neuberg, Cottrell, Schaller, Simpson and Kenrick32,Reference Wilson33
This long-term prevalence of group life shaped a coalitional psychology to help human ancestors navigate common adaptive problems within groups such as free riding, distributing group benefits, and establishing social hierarchies, as well as adaptive problems between groups such as resource competition. Reference Efferson, Lalive and Fehr4,Reference Lopez, McDermott and Bang Petersen5,Reference Tooby, Cosmides and Price6 It addresses, for instance, the common problem of raising a force of combatants who are willing to jeopardize their survival for others in the case of war or other forms of group conflict. Reference Patton, Cronk, Chagnon and Irons34 This suggests there is a biological basis for the tendency to assist people with whom one is most interdependent and to be wary of those with whom one is not. Indeed, evidence suggests humans possess generalized neural circuitry for categorizing others into in-groups and out-groups or “us” and “them.” Reference Cikara, van Bavel, Ingbretsen and Lau35
With this evidence in mind, it is not surprising that in-group/out-group categorization is found across cultures, and evidence of social group discrimination throughout human history is well documented. Reference Brown36,Reference Pratto, Sidanius, Stallworth and Malle37,Reference Wrangham and Peterson38 For instance, the Mundurucu headhunter tribe of Brazil divides group schemas into two discrete parts of good and evil. Reference Wilson39 A great deal of research suggests individuals automatically categorize others by age, gender, and race, Reference Fiske and Neuberg40 but other categories of “us” and “them” can be found in domains such as sports, Reference Wrangham and Peterson38 religion, Reference Cairns and Mercer41,Reference Haidt42 and vocation. Reference Pratt, Rockmann and Kaufmann43 Category biases can be created and manipulated almost instantly. Simple categorization is sufficient for cognitive and perceptual distortion. Reference Tajfel and Wilkes44 Blue eyes, artistic preferences, and merely separating people arbitrarily into two different groups is enough to create intergroup discrimination. Reference Efferson, Lalive and Fehr4,Reference Tajfel, Turner, Austin and Worchel8,Reference Allen and Wilder45,Reference Billig and Tajfel46,Reference Brewer and Silver47,Reference Doise and Sinclair48,Reference Tajfel, Billig, Bundy and Flament49
Social identity theory (SIT) Reference Tajfel, Turner, Austin and Worchel8 offers one explanation for intergroup discrimination. It suggests that in an effort to understand their environment, individuals (1) categorize other people and themselves, (2) identify with the group in which they categorize themselves, and then (3) compare their group with other groups. Group comparison is important — indeed, it is the objective of social identification processes Reference Hogg50 — because individuals can enhance their own self-esteem when the social status of their group increases. Through this process, SIT suggests that individuals engage in in-group favoritism and out-group derogation.
A substantial body of research supports the behavior of in-group favoritism. Scholars going back to Darwin have asserted that in-group favoritism has adaptive value. Darwin touched on such behavior by explaining its importance in the emergence of human morality and altruism, arguing that a tribe with members willing to come to the aid of one another would benefit through advantaged survival and reproduction through natural selection. Reference Darwin51 More recent research suggests that in-group favoritism emerges in a variety of circumstances from trivial behavior such as play in economic game experiments Reference Efferson, Lalive and Fehr4,Reference Goette, Hufman and Meier52 to odious behavior such as racial discrimination. Reference Greenwald and Pettigrew53 But evidence suggests that out-group derogation may also have adaptive value, and therefore it may play a role in intergroup discrimination. Reference Choi and Bowles54 This research shows, for instance, that more conflictual decision problems can induce out-group discrimination Reference John Zizzo55 and, even more germane to this research, that political partisans are willing to express animosity blatantly toward out-partisans, with the researchers suggesting that these reactions are reflexive. Reference Iyengar and Westwood16
Bounded generalized reciprocity (BGR) is an alternative explanation for intergroup discrimination. Reference Yamagishi, Jin and Kiyonari56 It generates similar expectations regarding in-group favoritism but suggests that the psychological mechanism is different. In BGR, in-group favoritism is the result of a desire for a positive reputation and increased reciprocity from exchange partners, many of whom are more likely to be in an individual’s in-group. In SIT, in-group favoritism is the result of a desire for a positive social identity through group membership. Reference Balliet, Wu and De Dreu57 Because of the strong perspective in political science that party identification is a social identity Reference Green, Palmquist and Schickler14 and because both perspectives yield similar expectations, the authors acknowledge the viability of BGR as an explanation for the expected relationships but take the perspective of SIT in this research.
Previous research, then, offers significant clues about why partisan identification so strongly influences political judgments. Given the human brain’s slow speed of adaptation, Reference Mayr58 a theoretical framework rooted in evolutionary theory should be applicable to modern society’s group-based power struggle engaged through party politics. Reference Westen, Blagov, Harenski, Kilts and Hamann59 Evolutionary forces flowing through human sociality, coalitional psychology, and social identification shape social cognition in general and, therefore, certainly can shape political cognition. More specifically, partisan identification can be viewed as a group-based attachment Reference Campbell, Converse, Miller and Stokes15 and even a social identity. Reference Green, Palmquist and Schickler14,Reference Greene60,Reference Iyengar, Sood and Lelkes61 Personal identification with a party is formed early in life through the interaction of environmental and genetic influences, and it tends to remain stable throughout life. Reference Green, Palmquist and Schickler14,Reference Campbell, Converse, Miller and Stokes15,Reference Alford, Funk and Hibbing62 It is used as a heuristic when judging political leadership, Reference Bartels63,Reference Mondak64,Reference Lau and Redlawsk65,Reference Gerber, Huber and Washington66,Reference Smidt67 policy preferences, Reference Campbell, Converse, Miller and Stokes15,Reference Jacoby68,Reference Mondak69 and fellow citizens. Reference Iyengar, Sood and Lelkes61 For instance, evidence suggests that political identity is associated with conflicting assessments of the national economy Reference Popescu70 and diametrical changes in support for or opposition to statements concerning African American self-reliance. Reference Kuklinski and Hurley18
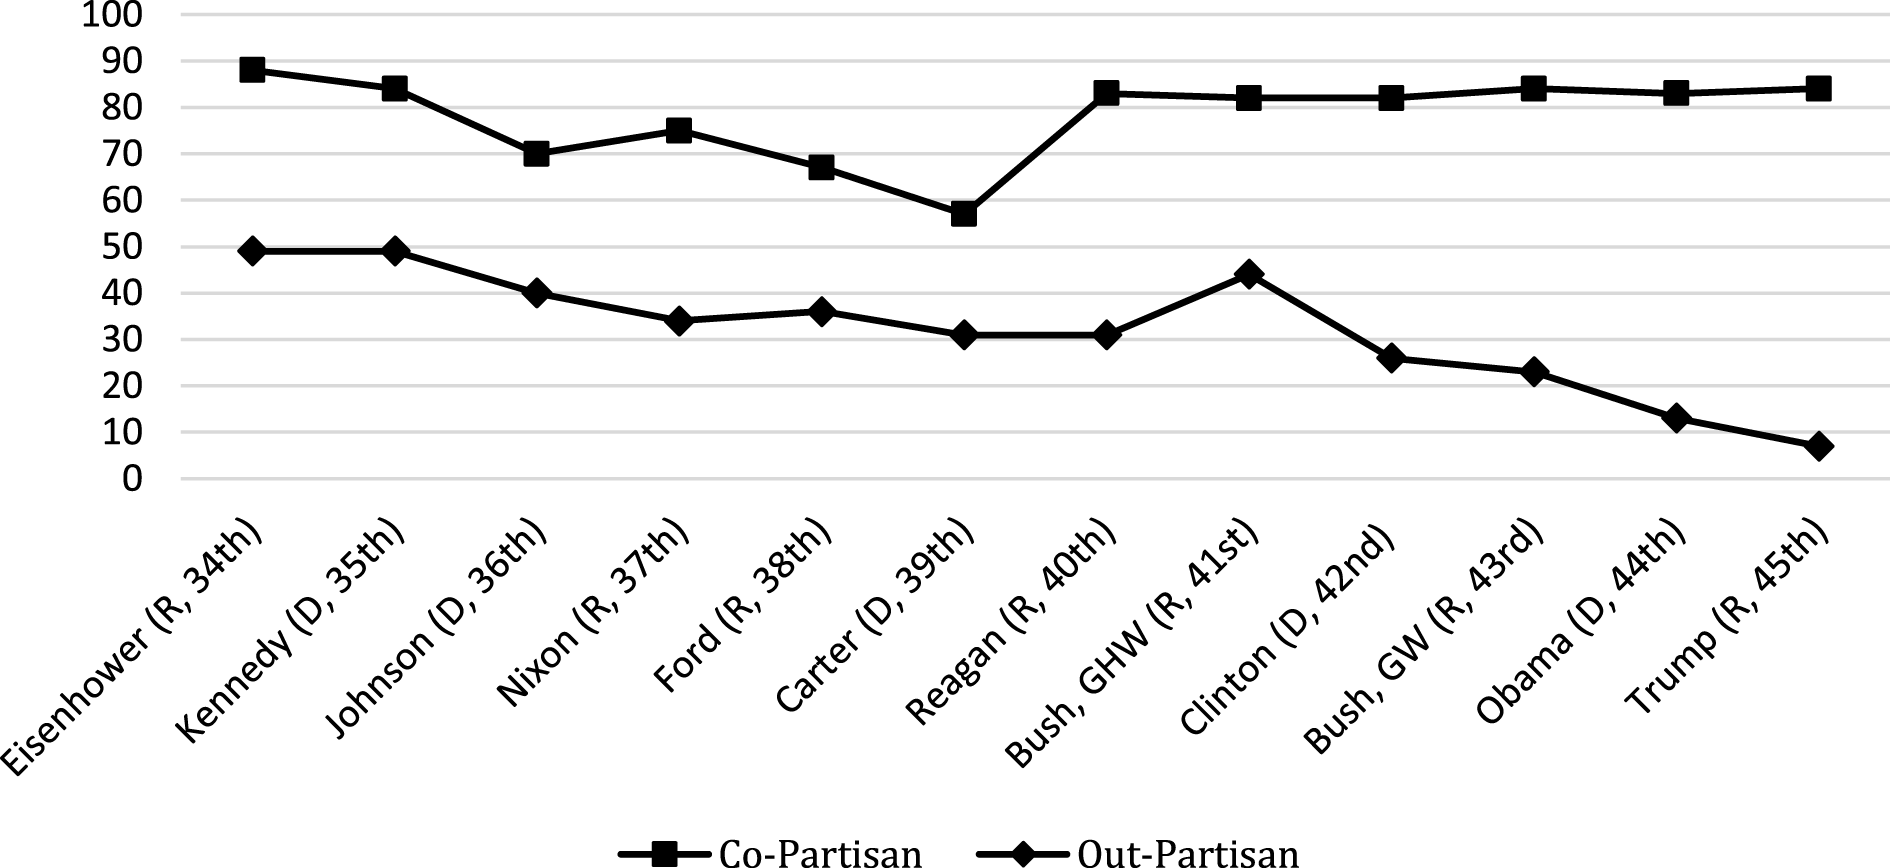
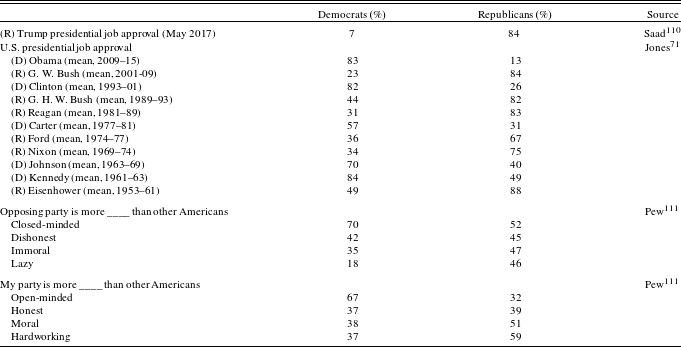
Figure 1 portrays partisan intergroup discrimination based on mean U.S. presidential approval including the last 12 presidents, which dates back to the early 1950s. Reference Jones71 It shows that for each president, mean in-group (or co-partisan; e.g., Democratic participant assessing a Democratic president) approval is always well above 50%, while, conversely, mean out-partisan (out-group) approval is typically well below 50%. In aggregated terms, overall mean in-group approval is 78%, while mean out-group approval is 32%. Table 1 reports more examples of partisan intergroup discrimination regarding U.S. presidents and assessments of other partisans.
Partisan Intergroup Discrimination, U.S. Presidential Approval (%), 1953–2017.

Partisan intergroup discrimination.

Partisanship has been shown to exacerbate in-group/out-group differentiation among political groups, Reference Iyengar and Westwood16,Reference Kelly17,Reference Greene60,Reference Schmitz72 even to the point of partisans rating other individuals with different candidate preferences as less physically attractive. Reference Nicholson, Coe, Emory and Song73 In fact, it has been argued that partisanship’s influence on political perception “has been far more important than the influence of these [other political] attitudes on party identification itself.” Reference Campbell, Converse, Miller and Stokes15 Even if one believes that the sense of growing partisan conflict in the country is nothing more than hype Reference Fiorina and Abrams74 or the result of media contention, Reference Iyengar, Sood and Lelkes61 there is little doubt that the political parties in the United States represent highly salient groups or, in other terms, tribes to many citizens.
Stature, status, and politics
Large physical stature has been shown to benefit a broad range of human and nonhuman animal species. Reference de Waal75,Reference de Waal76,Reference Ellis and Ellis77,Reference Just and Morris78,Reference Parker79 Humans associate height and social status in a number of domains, including economic and political domains. Reference Boix and Rosenbluth80 Evidence suggests a positive relationship between height and income, Reference Judge and Cable81 military rank, Reference Mazur, Mazur and Keating82 and general social status. Reference van Vugt and Ronay83 Height estimations can be manipulated by stimuli related to status, Reference Dannenmaier and Thumin84,Reference Higham and William Carment85,Reference Roberts, Peter Herman, Herman, Zanna and Higgins86 and status estimations can be manipulated by stimuli related to height. Reference Lindeman and Sundvik87 According to Ellis, 64 of 65 studies of industrial societies found a positive correlation between height and social status. Reference Ellis and Ellis77 Cross-cultural studies have brought attention to the effect that relative height has on people’s ability to reach higher social and economic status in developed nations. Reference Cernerud88,Reference Gregor89,Reference Handwerker and Crosbie90 In Sweden, taller males are more likely to be selected for higher education, Reference Cernerud88 while in the United States, they are more likely to be hired, receive higher wages, and be promoted. Reference Gillis91,Reference Persico, Postelwaite and Silverman92 Further, a study of college undergraduates showed that taller women have an advantage in the workplace over their shorter male counterparts. Reference Handwerker and Crosbie90
Studies of leadership in the political arena have found a similar relationship between height and status. Research suggests that followers may attribute prototypical leadership traits to potential leaders based on the leader’s physical characteristics. Reference Lord and Emrich93 When considering group leaders, anthropological evidence documents the use of the term “big man” throughout history and across cultures. “Big man” did not refer to physical stature alone but was given to the leaders of tribes and social hierarchies. Reference Brown and Chia-yun94 For example, the people of Conambo in the Ecuadorian Amazon refer to men of prominence as hundri, meaning “big man.” Reference Patton, Cronk, Chagnon and Irons34 Focusing on contemporary times, a study found that when asked to guess the height of politicians in Canada before and after an election, the perceived height of the winning candidates increased significantly. Reference Higham and William Carment85 One study found a positive relationship between the heights of presidential election winners and historians’ estimates of economic, social, and political threat in years of the elections. Reference McCann22 Not only are presidents on average 4% taller than the average American male during their tenure, Reference Sommers95 but also a positive relationship exists between historians’ ratings of presidential greatness and presidents’ heights. Reference McCann22 Indeed, a number of studies have indicated that citizens prefer taller and more physically formidable national leaders. Reference Murray23,Reference Murray and David Schmitz24,Reference Sorokowski26,Reference Stulp, Buunk, Verhulst and Pollet27
Evolutionary theory and neuroscientific evidence Reference Cikara, van Bavel, Ingbretsen and Lau35 suggest that modern human brains are still “wired” to solve the small-group adaptive problems that human ancestors faced thousands of years ago. Reference van Vugt, Hogan and Kaiser29 The environment was difficult and violent Reference Chagnon28,Reference van Vugt, Hogan and Kaiser29 as individuals and groups competed for land, food, and status. Reference Bang Petersen, Delton, Robertson, Tooby and Cosmides30 Archaeologists have also argued that “[m]uch of today’s warfare reads just like the warfare of tens of thousands of years ago — the same causes, the same tactics, and the same attitudes.” Reference Leblanc and Register96 For purposes of security, then, a tribe looked for leader attributes beyond intelligence and social skills. The size of a leader had a direct relationship to the leader’s fighting ability and, therefore, to the leader’s ability to coordinate frequent activities such as heading up group hunts, ending intragroup fights, and directing group raids against other groups. Reference van Vugt, Johnson, Kaiser, O’Gorman, Forsyth, Goethals, Hoyt, Genovese, Han and Ciulla97 Individuals also often faced challenges for vital resources. Having allies with greater physical formidability, which signals strength and fighting prowess, Reference Briffa and Sneddon98 was an important resource. Reference Patton, Cronk, Chagnon and Irons34
The preference for leaders with greater physical stature may therefore be a remnant of a trait that was at one time beneficial for survival but is mismatched to or even maladaptive in modern society. Reference van Vugt, Johnson, Kaiser, O’Gorman, Forsyth, Goethals, Hoyt, Genovese, Han and Ciulla97,Reference Nesse99 That is, the modern desire for a national leader who seemingly can physically conquer the national leader of another country may be similar to the modern desire for food that currently is associated with chronic diseases but in the nutritionally sparse evolutionary environment aided survival. Reference Nesse99,Reference Cordain, Eaton, Sebastian, Mann, Lindeberg, Watkins, O’Keefe and Brand-Miller100
An alternative explanation for the “irrational” preference for individuals with greater physical stature in modern times often invokes the widely recognized link between early malnutrition and stunted growth in a range of species, including humans. Reference Hoddinott and Kinsey101 Some scholars hypothesize that the bias toward taller individuals is actually a bias toward individuals with greater socioeconomic status who have access to nutritionally sufficient diets. Reference Douglas and Merimond102,Reference Haviland, Maholy-Nagy, Chase and Chase103,Reference Malhotra, Baker and Weiner104 Contrary to this argument, genetics account for 80% to 90% of a person’s height, and height preference is also pervasive in postindustrial societies, where malnutrition is rare. Reference Ellis and Ellis77
Hypothesis
If evolved forces are at play in partisan behavior, then political partisans should demonstrate preferences motivated by human evolution when making group-related decisions. That is, intergroup discriminatory behavior and the evolved preference for more physically formidable leaders may stimulate partisan citizens to distort the physical stature of their leader compared with the opposition’s leader. Given the slow speed of human evolution, the ancestral mind perceives that physically formidable allies, through their greater strength and fighting prowess, will help protect vital resources from threats. Following this argument, this research suggests the following:
- H1:
-
Individuals will tend to overestimate the physical stature of candidates from their own party relative to the physical stature of candidates from the opposition party.
Data and methods
To test this hypothesis, the lead author administered questionnaires in 2008 and 2012 around the U.S. presidential elections that included assessments of the physical characteristics of the candidates. Although these elections shared a historic candidate, the first African American major party candidate and later U.S. president, the political contexts varied substantially. The 2008 presidential election featured an open-seat contest conducted in the midst of an economic recession that included a 2 percentage point increase in unemployment from the previous year (from 4.7% to 6.8% and climbing). The 2012 election, on the other hand, featured a race with an incumbent conducted in the midst of an economic recovery that included an almost 1 percentage point decline in unemployment from the previous year (from 8.6% to 7.7% and generally falling). 105
Each year questionnaires were administered approximately two weeks before and two weeks after the general election. The study uses a convenience sample of undergraduate students taking a required introductory political science class at a large public university in a predominantly conservative region in the southwestern United States. This research was approved by the institution’s institutional review board. All students at public universities in this state must take or get credit for this class to graduate, so the participants reflect a broad spectrum of majors. Using a paper-and-pencil instrument, these participants completed a series of 2-minute drawing tasks and then answered several questions regarding their candidate drawings, the candidates, their political views, and themselves. This yielded 190 completed questionnaires in 2008 and 476 in 2012. See Appendix A for more details on the drawing task and questionnaire.
The effect of party identification on relative perceived height was estimated with two dependent variables and participant party identification while controlling for political interest, debate watching, known differences in heights, and pre- or post-election questionnaire administration. Participant age, sex, and race/ethnicity were not controlled for because of the lack of a theoretical basis for including them as well as the desire to preserve statistical power. The first dependent variable is the articulated relative height ratio of the Democratic candidate to the Republican candidate. That is, participants were asked to estimate each candidate’s height with an open-ended question: “How tall do you believe [CANDIDATE] to be?” The 2008 ratios report these estimates, calculated in inches, for presidential candidates Barack Obama (Democrat, D) to John McCain (Republican, R) and vice presidential candidates Joe Biden (D) to Sarah Palin (R). The 2012 ratio reports the estimate, calculated in inches, for Obama (D) to Mitt Romney (R). Vice presidential data were not collected in 2012 because of resource constraints. A ratio greater than 1 indicates the participant estimated that the Democratic candidate was taller than the Republican candidate, while a ratio less than 1 indicates the opposite.
The second dependent variable is the drawn relative height of the Democratic and Republican candidates as indicated by the participant drawing of the candidates meeting. More specifically, each questionnaire included 8.5-
 $\times$
11-inch blank pages upon which participants first were asked to draw each candidate standing alone, after which they were asked to write down any words that came to mind when they thought of the candidate in question. After this was done for each candidate individually, the participants were asked to draw the two adversaries meeting. Drawing studies have been used to explain the desire for formidable leaders.
Reference Murray and David Schmitz24
The participants were asked to draw the candidates based on the instructions shown in Appendix A. Each candidate in each drawing was measured twice to the hundredth millimeter using a digital ruler, and the questionnaire responses and drawings were entered separately in the dataset to avoid biasing the measurer regarding the participant’s party identification. The measure was then coded trichotomously, where
 $-1=$
Democrat drawn taller,
 $0=$
depictions within one millimeter of each other, and
 $1=$
Republican drawn taller.
The independent variable, participant party identification, serves as a proxy for a participant’s connection to her or his group. Feeling connected to one’s in-group is a prerequisite for in-group favoritism and out-group derogation to emerge.
Reference Hinkle, Brown, Abrams and Hogg10
Party identification was measured using the standard American National Election Studies coding and specified in the models as two indicator variables coded
 $1/0$
for strong/weak Republicans and Independents (including leaners), with strong/weak Democrats serving as the comparison group. To preserve cases and retain statistical power, the model also includes indicator variables for participants noting that they are apolitical (
 $N$
,
 $2008=14$
;
 $N$
,
 $2012=27$
) or not answering the party identification question (
 $N$
,
 $2008=4$
;
 $N$
,
 $2012=6$
).
In terms of the control variables, political interest was measured on a four-point scale by asking how often the participant tuned into political events, ranging from
 $1=$
“hardly at all” to
 $4=$
“most of the time.” Because watching one of the debates could offer an actual demonstration of the relative height of the candidates, the models include an indicator variable coded 1 or 0 for whether the participant did or did not watch at least one of the debates. In addition, because Google Search Trends indicate that questions about the height of candidates are popular searches regarding candidates, the models include an indicator variable coded
 $1/0$
for knowing the actual difference in height or not. Finally, because of the effect of winning and losing on the perceptions of candidates,
Reference Higham and William Carment85
the model includes an indicator variable coded
 $1/0$
for participants who completed the questionnaire after or before the election.
Results
In the 2008 election, 24% of participants identified as Democratic, 6% as Independent, and 62% as Republican. Fifty-two percent were female, and the mean age was 19.3 (
 $SD=1.9$
) years. Seventy-seven percent were white, 14% Hispanic, and 5% black. The typical participant followed government and public affairs “only now and then” (31%) or “some of the time” (31%). Sixty-eight percent reported watching a presidential debate, 5% had been informed of the candidates’ heights, and 50% completed the instrument after the election. In terms of the dependent variables, in 2008, the mean articulated presidential Democratic-to-Republican height ratio was 1.06 (
 $SD=0.07$
), meaning that, on average, participants estimated Obama to be 6% taller than McCain, while 54% in the drawing task drew Obama taller and 39% drew McCain taller. In 2008, the mean vice presidential height ratio was 1.05 (
 $SD=0.07$
), meaning that, on average, participants estimated Biden to be 5% taller than Palin, while 40% drew Biden taller and 52% drew Palin taller.
Table 2 shows publicly reported heights of the candidates along with the resulting Democratic-to-Republican height ratio for each pair of competing candidates. In 2008, both Democratic candidates were taller than both Republican candidates. In 2012, the Republican candidate was taller than the Democratic candidate.
Candidates’ actual heights and resulting height ratios.

Note: Heights reported in inches; converted to centimeters: Biden
 $=$
183; McCain
 $=$
175; Obama
 $=$
185; Palin
 $=$
165; Romney
 $=$
188.
Summary results of multivariate analyses, perceived relative height, Republicans compared with Democrats.

In the 2012 election, 26% of participants identified as Democratic, 12% as independent, and 55% as Republican. Fifty-two percent were female, and the mean age was 19.4 (
 $SD=2.7$
) years. Sixty-eight percent were white, 19% Hispanic, and 6% black. Thirty-six percent of participants, the modal category, followed government and public affairs “some of the time.” Sixty-eight percent reported watching a presidential debate, 4% had been informed of the candidates’ heights, and 59% completed the instrument after the election. In terms of the dependent variables, in 2012, the mean articulated presidential Democratic-to-Republican height ratio was 1.02 (
 $SD=0.08$
), meaning that, on average, participants estimated Obama to be 2% taller than Romney, while 42% drew Obama taller and 39% drew Romney taller.
Ratio of articulated heights
The left column of Table 3 reports ordinary least squares (OLS) estimates with robust standard errors of the articulated height ratio of Obama-to-McCain (2008 presidential), Biden-to-Palin (2008 vice presidential), and Obama-to-Romney (2012 presidential) as a function of party identification and the control variables. The full models appear in Appendix B. The results indicate that the Democratic and Republican participants estimated statistically different ratios in the two presidential contests but not the one vice presidential contest. More importantly, Table 3 also displays the predicted ratios estimated by the models. The hypothesis suggests that Democratic participants should predict a ratio greater than 1, indicating that the Democratic candidate is taller than the Republican candidate, and Republican participants should predict a ratio less than 1, indicating that the Republican candidate is taller than the Democratic candidate.
As expected, the Democratic participants perceived their candidates to be statistically taller than the Republican candidates in each election (95% confidence intervals do not include 1.0). Contrary to expectations, though, Republican participants did not estimate their candidates to be taller in even a single election, and in this case, they even appear to have statistically favored the out-partisan candidate in each election. While these results are consistent with the actual relative heights for the 2008 presidential and vice presidential candidate pairings — Obama and Biden are indeed taller than McCain and Palin — the results do not reflect the actual relative heights of Obama and Romney in 2012 — Romney is taller than Obama. This result calls for further investigation, but it may indicate an incumbency or “big man” advantage that Obama held over Romney. Reference Higham and William Carment85
Effects of co- and out-partisanship on individual candidates’ estimated height.

Notes: OLS coefficients only; standard errors and other details reported with the full models in Appendix C.
*
 $p<0.05$
(two-tailed).
Mechanism check
Social identity theory asserts that group members both favor their in-group and derogate the out-group. In the context of this research, this suggests that partisans will overstate the height of their leader relative to the opposition group’s leader. The ratio measure used in this research (Democratic-to-Republican candidate estimated height) cannot discern whether a participant overstated the height of his or her candidate (in-group favoritism), understated the height of the opposing candidate (out-group derogation), or did a bit of both. But the height estimates for each individual candidate (i.e., the measures used to calculate the height ratios) can offer some evidence. Table 4 reports OLS estimates with robust standard errors of the estimated height (in inches) of each individual candidate as a function of participant party identification and the control variables. The full models appear in Appendix C.
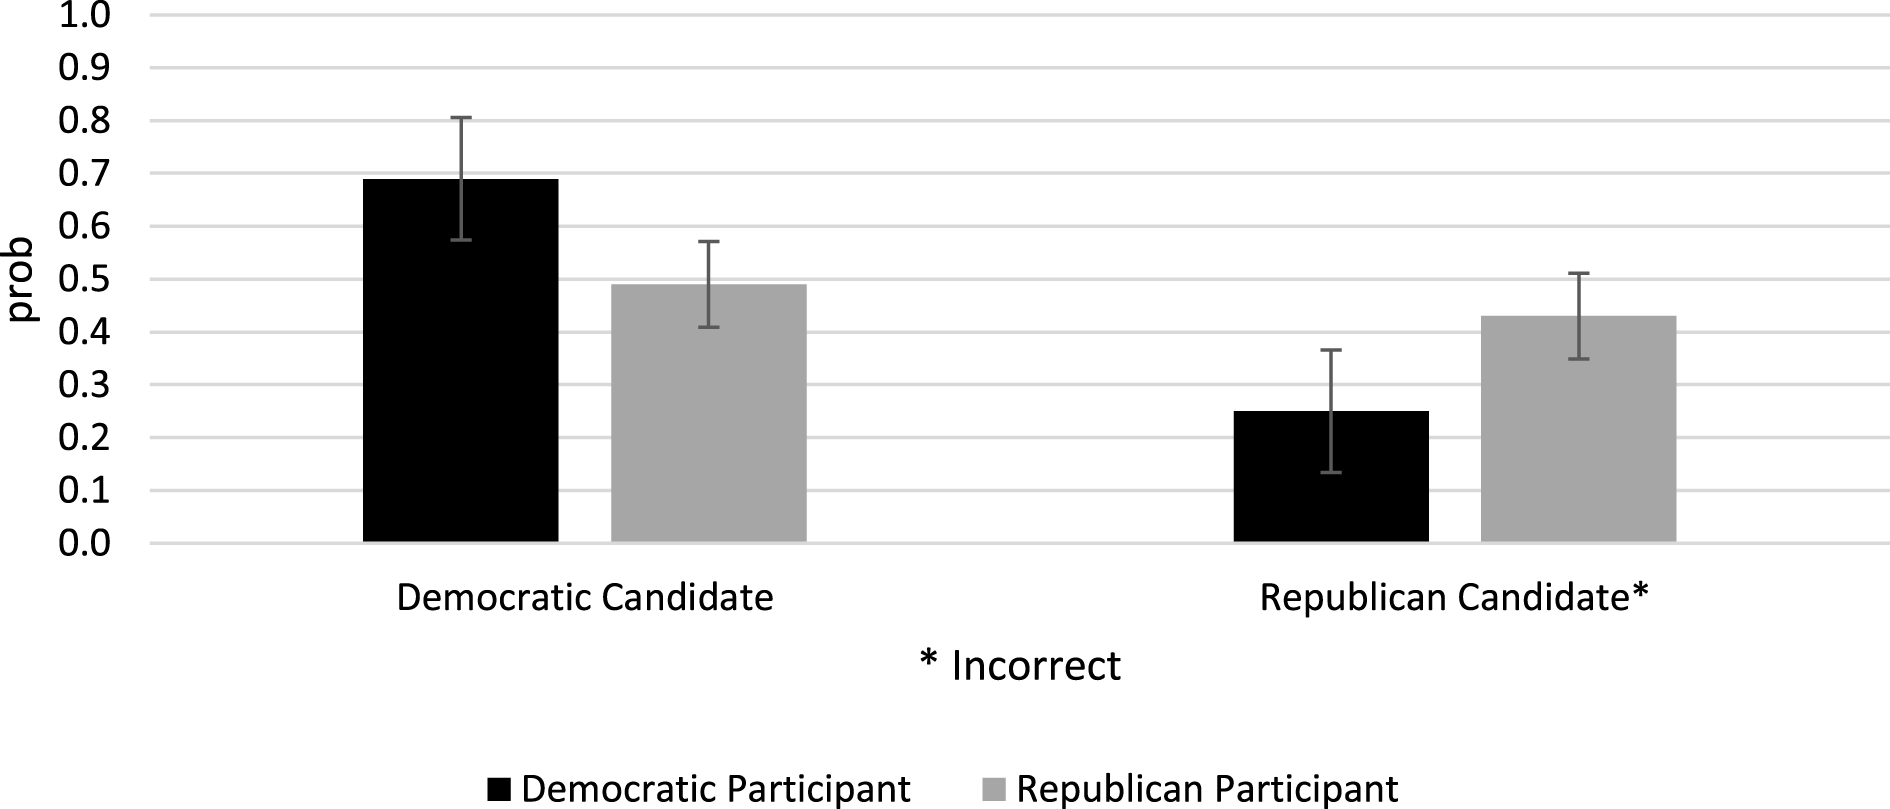
Predicted Probabilities for which 2008 Presidential Candidate is Drawn Taller, by Participant Party Identification (95% CIs).

The statistical results indicate that partisans neither favored their own party’s leader nor derogated the opposing party’s leader. Co-partisans statistically favorited their candidate in only one case, Republicans for Romney in 2012 (coefficient
 $=$
0.855,
 $SE=0.390$
,
 $p<0.05$
two-tailed), as indicated by the asterisk, and out-partisans never statistically derogated the opposing candidate. On the other hand, the positive coefficients on five of the six candidates indicate that co-partisans at least substantively favored their leader (the exception being Democratic vice presidential candidate Biden in 2008, as indicated in italics), and the negative coefficients on five of the six candidates indicate that out-partisans at least substantively derogated the opposing leader (the exception being Republican presidential candidate Romney in 2012, as indicated in italics). Overall, in 10 of 12 tests, participants substantively behaved as expected from social identity theory, but only one test of height was statistically significant. This quick check of the theoretical mechanism hints at but does not confirm the expected behavior. Given the magnitude of the coefficients, which represent candidate height in inches, a larger sample with greater statistical power may confirm the expected effect.
Who’s taller? A drawing task
Appendix D reports the full models of ordered probit estimates of which candidate is drawn taller as a function of participant party identification and the control variables. The relative heights of the three pairs of candidates were ascertained from participant drawings of a fictitious meeting between each pair of candidates (see Appendix E for examples of the drawings). For transparency, the authors note that the raw data with the measures of the drawings were lost during a number of author relocations. Since the data are not available for verification, some readers may choose to discount this part of the study.
Table 2 indicates that Democrat Obama is 4 inches taller than Republican McCain and 1 inch shorter than Republican Romney. It also shows that Democrat Biden, a male, is 7 inches taller than Republican Palin, a female. The results in Appendix D indicate, as expected, that party identification meaningfully predicts which candidate participants drew as taller in each election. Republicans were more likely to depict their candidates as taller than the Democratic candidates, and Democrats were more likely to depict their candidates as taller than the Republican candidates.
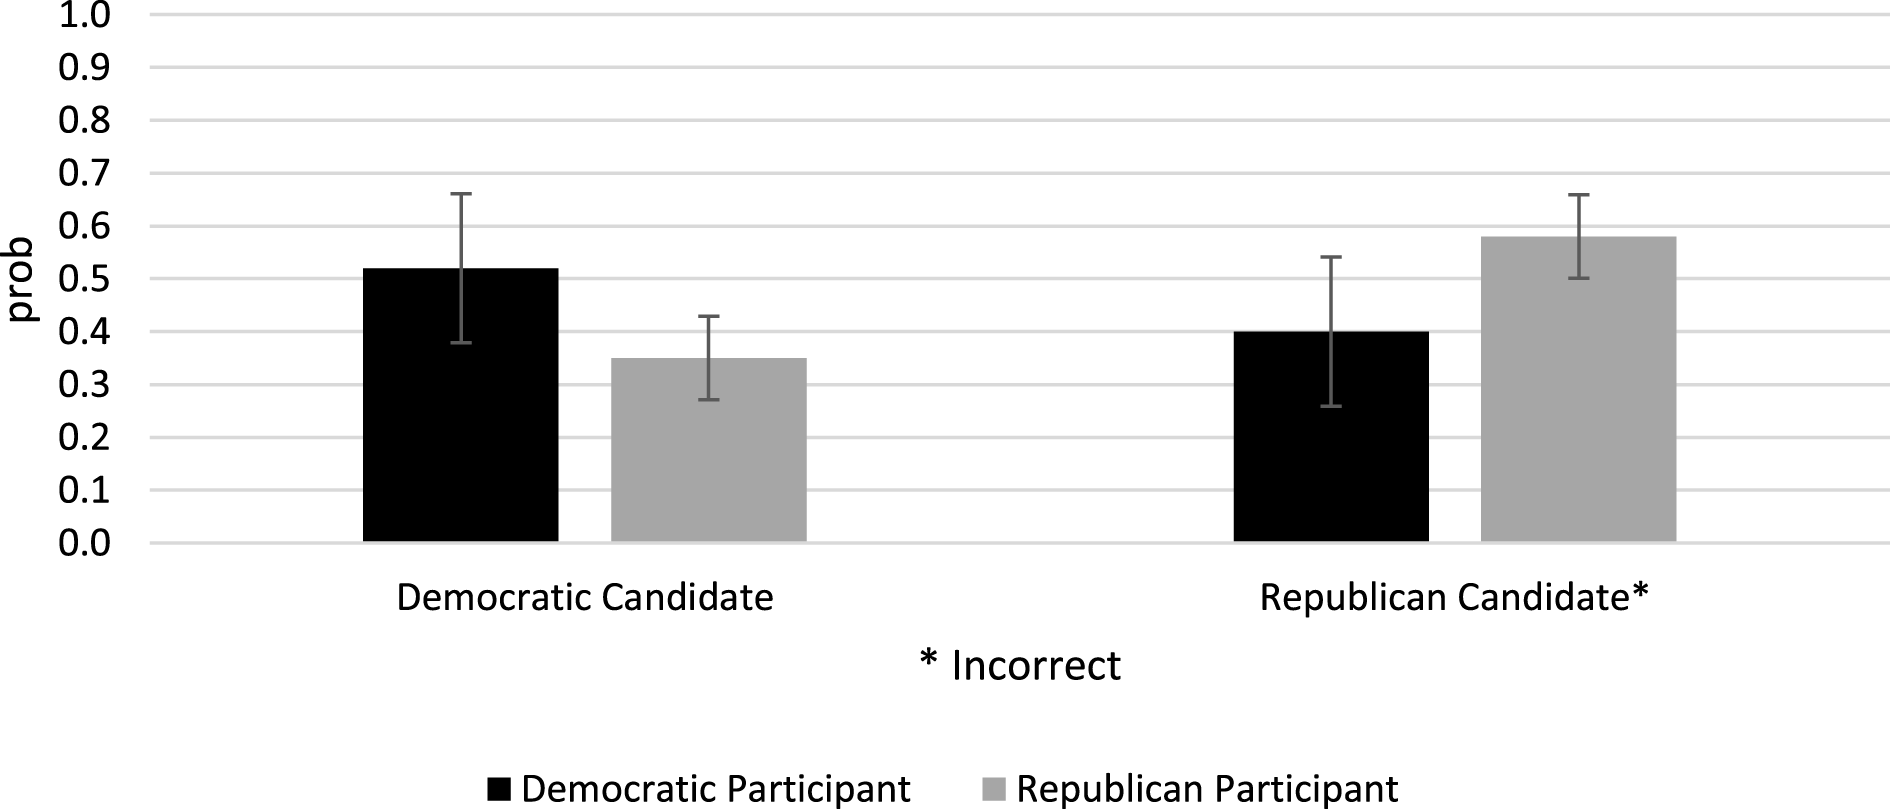
Predicted Probabilities for which 2008 Vice Presidential Candidate is Drawn Taller, by Participant Party Identification (95% CIs).

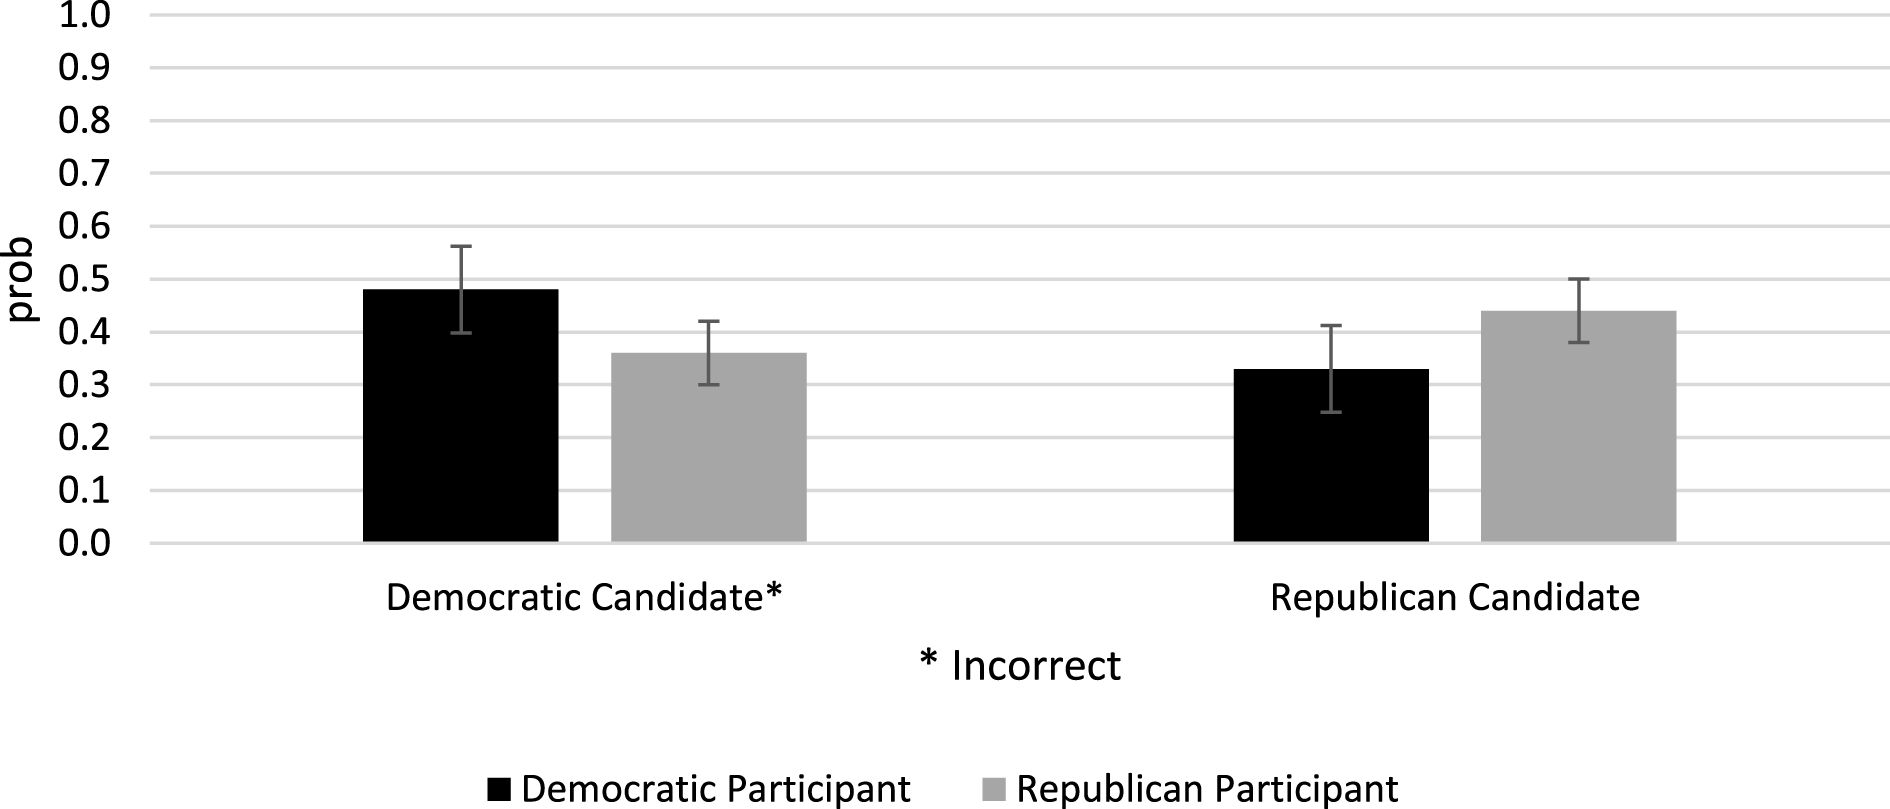
Figures 2–4 display the predicted probabilities that a candidate is drawn taller by participant party as estimated from the models. Figure 2 shows that in 2008, Democratic participants were more likely to draw Obama as taller (predicted probability: 0.69,
 $SE=0.06$
,
 $p<0.001$
two-tailed) than Republicans were (0.49,
 $SE=0.04$
,
 $p<0.001$
two-tailed), while Republicans were more likely to draw McCain as taller (
 $0.43,SE=0.04,p<0.001$
two-tailed) than Democrats were (
 $0.25,SE=0.06,p<0.001$
two-tailed). Figure 3 shows that in 2008, Democratic participants were more likely to draw vice presidential candidate Biden as taller (
 $0.52,SE=0.07,p<0.001$
two-tailed) than Republicans were (
 $0.35,SE=0.04,p<0.001$
two-tailed), while Republicans were more likely to draw vice presidential candidate Palin as taller (
 $0.58,SE=0.04,p<0.001$
two-tailed) than Democrats were (0.40,
 $SE=0.07,p<0.001$
two-tailed).
Figure 4 shows that in 2012, Democratic participants were more likely to draw Obama as taller (0.48,
 $SE=0.04$
,
 $p<0.001$
two-tailed) than Republicans were (0.36,
 $SE=0.03$
,
 $p<0.001$
two-tailed), while Republicans were more likely to draw Romney as taller (0.44,
 $SE=0.03$
,
 $p<0.001$
two-tailed) than Democrats were (0.33,
 $SE=0.04$
,
 $p<0.001$
two-tailed). Put otherwise, participants from each party were more likely to draw their party’s candidate as taller. In each case, then, participants attributed greater relative physical stature to their party’s candidate than they did to the opposing party’s candidate. These results support the hypothesis.
Discussion
Political partisanship is a fundamental force in political behavior. Evidence suggests it is influenced by the forces of human evolution via human sociality, coalitional psychology, and group dynamics as are many other group-related behaviors. If this assertion is correct, then partisan citizens should demonstrate adaptively influenced behaviors when making group-related political decisions. In such a case, in- and out-group discrimination may affect individuals’ perceptions of candidate heights, which are used as a proxy for the relative formidability of their group’s and opposing groups’ leaders. With original data collected during two contextually different U.S. presidential elections and with two distinct measures of perception of leaders, this research tests this argument using assessments by citizens of the relative physical formidability of competing leaders, an important adaptively influenced factor in leader evaluations.
Predicted Probabilities for which 2012 Presidential Candidate is Drawn Taller, by Participant Party Identification (95% CIs).

The results offer mixed support for the hypothesis. More specifically, for the ratio measures reported in Table 3, Democrats statistically estimated their candidate to be taller than the Republican candidate (i.e., they favored the in-group candidate) in each election, but the Republicans did, too (i.e., they favored but did not derogate the out-group candidate). These results are consistent with the candidates’ actual heights in 2008, but the opposite should have been true in 2012, when the Republican candidate was indeed taller. Further, the results of the mechanism check suggest but do not statistically confirm that the participants were indeed favoring their in-group candidate and derogating the out-group candidate. That is, in 10 of 12 tests, participants substantively behaved as expected, but the effect was only statistically significant in one of those tests. Finally, the results of all three tests using participants’ drawings of the competing candidates support the hypothesis. Said more directly, partisans are more likely to estimate their candidate is taller than the opposing candidate. In evolutionary terms, they are more likely to believe their leader is more physically formidable than the opposing group’s leader.
The results of the drawing task are particularly striking regarding Joe Biden and Sarah Palin. Most humans regularly experience sexual dimorphism, or differences in size between females and males. Today, the typical female in the United States is 63.8 inches tall and the typical male is 69.3 inches tall; that is, males on average are 5.5 inches or 9% taller than females. 106 The results indicating that 58% of Republicans were more likely to perceive Palin, their candidate, as taller than Biden suggest that party identification may be overriding expectations shaped by frequent daily experiences of sexual dimorphism.
Work in political science has shown that partisan identification, much like ethnicity and religion, acts as a self-sustaining emotional attachment that not only reflects belief systems but also drives them. The question is why. The answer and some of the evidence presented here suggest that the power of party identification on political behavior may stem from the fact that party identification today, at its core, solves problems that were much like the problems groups faced in ancestral times: how to distribute scarce resources among group members. Ancestral intragroup concerns regarding free riding, distributing group benefits, and establishing social hierarchies as well as intergroup concerns regarding resource competition and violent conflict are very similar to the issues modern governments are called upon to help resolve today. Governments impose taxes and regulations to ensure that all citizens have access to public goods such as national defense and a habitable environment. They also distribute social resources such as wireless spectrum access and Social Security benefits and establish citizen versus noncitizen rights and privileges. Of course, the national government also manages the county’s relationships, including violent conflict, with other countries. Even though not of the same scale, these problems are of the same type faced by human ancestors. Nonetheless, these and similar problems are often at the center of political conflict in modern society, and the protagonists often organize by political partisanship.
The randomness and glacial speed from which evolution derives its power Reference Dawkins107 can make evolution a complicated predictor of human behavior. That said, evolution has far more to offer as a launching point from which to understand some seemingly irrational phenomena (such as the findings in this article regarding leadership and physical stature) than a tabula rasa argument grounded in the standard social scientific model can offer.
This research warrants further refinement. Beyond the often-needed more representative sample, Reference Druckman, Kam, Druckman, Green, Kuklinski and Lupia108 a similar study that captures the multidimensional stature of actual candidates such as body mass index (BMI) or the volume of a candidate depiction or written expressions of formidability might yield added insight to whether physical stature is driving perceptions or whether height is simply a cue for other factors such as a preference for leaders with greater socioeconomic status. Reference Haviland, Maholy-Nagy, Chase and Chase103 A larger sample would allow for more statistical power when considering analyses of facial cues (e.g., drawn frowns versus smiles), subjugation through anthropomorphism (e.g., Romney was drawn as a snake three times), and dehumanization in general (e.g., candidates depicted as bodily waste). All three areas offer opportunities for further analysis. Finally, similar cross-cultural findings, which provide some control for the effect of context, would support the suggestion that evolutionary forces can be considered a possible causal mechanism for the effects reported here. Reference Buss109
To return to a classic concept in political science, “the influence of party identification on perceptions of political objects is so great that only rarely will the individual develop a set of attitude forces that conflicts with this allegiance.” Reference Campbell, Converse, Miller and Stokes15 The argument and findings presented in this research offer a potential explanation for this powerful effect.
Appendix A Instructions to participants and pertinent questionnaire items
Instrument
Thank you for taking this survey. If at any time you feel the need to stop answering questions, or would rather not answer specific questions, please feel free to do so. Participation is voluntary, and you can quit at any time.
DESCRIPTION 1: VERBAL INSTRUCTIONS (rotate McCain/Romney and Obama)
Please turn to the first page. You have ONE MINUTE to complete this task. I will provide a countdown to help you keep track of time. Please read the directions and begin this description.
DRAWING COMPONENTS OF THE INSTRUMENT ATTACHED
PICTURE 1: VERBAL INSTRUCTIONS
Please stop. Turn to the back of this page. You have TWO MINUTES to complete this task. I will provide a countdown to help you keep track of time.
This is your first drawing. Artistic ability does not matter. Stick figures are fine if you run short of time and/or artistic ability. Please read the directions and begin.
DESCRIPTION 2: VERBAL INSTRUCTIONS
Please stop. Turn to the next page. You have ONE MINUTE to complete this task. I will provide a countdown to help you keep track of time. Please read the directions and begin this description.
PICTURE 2: VERBAL INSTRUCTIONS
Please stop. Turn to the back of this page. You have TWO MINUTES to complete this task. I will provide a countdown to help you keep track of time.
Remember, artistic ability does not matter. Stick figures are fine if you run short of time and/or artistic ability. Please read the directions and begin.
DESCRIPTION 3 (MEETING): VERBAL INSTRUCTIONS
Please stop. Turn to the next page. You have ONE MINUTE to complete this task. I will provide a countdown to help you keep track of time. Please read the directions and begin this description.
PICTURE 3 (MEETING): VERBAL INSTRUCTIONS
Please stop. Turn to the back of this page. You have TWO MINUTES to complete this task. I will provide a countdown to help you keep track of time.
Remember, artistic ability does not matter. Stick figures are fine if you run short of time and/or artistic ability. Read the directions and begin.
Now, please go back to your DRAWING of the meeting. Make sure you’ve clearly labeled each candidate.
DESCRIPTION 4 (VP MEETING): VERBAL INSTRUCTIONS
Please stop. Turn to the next page. You have ONE MINUTE to complete this task. I will provide a countdown to help you keep track of time. Please read the directions and begin this description.
PICTURE 4 (VP MEETING): VERBAL INSTRUCTIONS
Please stop. Turn to the back of this page. You have TWO MINUTES to complete this task. I will provide a countdown to help you keep track of time.
Remember, artistic ability does not matter. Stick figures are fine if you run short of time and/or artistic ability. Read the directions and begin.
Now, please go back to your DRAWING of the meeting. Make sure you’ve clearly labeled each candidate.
Now we need to ask a few questions about you. Please complete the following questions.
END VERBAL DIRECTIONS, BEGIN QUESTIONNAIRE
Appendix B OLS models predicting articulated height ratios

Appendix C OLS models predicting candidates’ estimated heights


Appendix D Ordered probit models predicting which candidate is drawn taller

Appendix E Sample drawings