I. INTRODUCTION
This paper describes the Rietveld method application to the quantitative analysis of the powder XRD data of inorganic crystalline materials and also serve as an educational paper on the analysis of crystalline portions of sludge deposits from the affected equipment in the refinery and gas plants. The basic premise of this paper − that preferred crystallographic orientation can cause serious systematic errors in quantitative phase analysis (or phase composition analysis, wt%) and crystal structure refinement (Sitepu, Reference Sitepu2002, Reference Sitepu2009; Sitepu et al., Reference Sitepu, O'Connor and Li2005) – is important, and worth discussing. Examples include texture and structural refinement of crystalline scale deposits (calcite – CaCO3), quantitative analysis of iron oxide corrosion products from the boiler tube equipment in a gas plant, i.e., magnetite (Fe3O4), hematite (Fe2O3), goethite (FeO(OH)), and formation material normally found in the sandstone or sand in the form of quartz (SiO2). Other examples include (a) quantitative phase analysis of synthetic mixtures of barite, quartz, and hematite and (b) quantitative phase analysis of sludge deposits that were collected from the equipment parts in a refinery. All these examples are useful in demonstrating quantitative phase analysis by the Rietveld method with the generalized spherical harmonic description for preferred orientation correction (Von Dreele, Reference Von Dreele1997; Sitepu, Reference Sitepu2002, Reference Sitepu2009; Sitepu et al., Reference Sitepu, O'Connor and Li2005), see Section IB. Key information is not just the phase concentrations but also includes the lattice parameters (which can reflect composition) and information derived from the profile parameters and the preferred orientation. All aspects of the microstructure are worth discussing. Calcite, magnetite, and hematite are especially prone to preferred orientation, and so are worth including in the samples discussed. Accurately knowing which phase is involved – along with the structure, texture, and compositions for each of the identified phases in the scale and corrosion deposits – can guide the field engineers at the refinery and gas plants to facilitate the efficient cleaning of the equipment, by drawing up the right procedures and taking preventive action to stop the generation of those particular deposits.
The accumulated sludge deposits’ scales and chemicals layers with hydrocarbons (e.g., oil, lubricant, grease, and water or all) are formed at the different parts of the affected equipment in refineries and gas plants by the combination of inorganic compounds in the forms of scale and corrosion products, and can cause premature equipment failures and temporarily shut down refineries and gas plants (Sitepu et al., Reference Sitepu, AlYami and Al-Zahrani2024; and references therein). Consequently, proper knowledge derived from characterization of these deposits can provide clues, not only to the corrosion mechanism, but also the corroding media source. Therefore, the Research and Analytical Services Department provides support to the refinery and gas plant engineers in identifying and quantifying the nature and source of compounds. The techniques employed include wavelength-dispersive X-ray fluorescence (WDXRF) spectrometry, powder X-ray diffraction (powder XRD), and quantitative Rietveld analysis (Sitepu et al., Reference Sitepu, AlYami and Al-Zahrani2024; and references therein), see Figure 1 and Table I. The findings help guide the engineers in taking proper action to prevent future occurrences and avoid refinery and plant slowdown that may result in loss of production.
Summary of the WDXRF elements concentration (wt%) and phase identification results of powder XRD data of the 0.5 wt% by weight of the crystalline deposits along with the quantitative Rietveld analysis results (wt%) for each of the identified phases.

Zaidi and Sitepu (Reference Zaidi and Sitepu2011) described the sample preparation methods to identify the unknown and complex accumulated deposits from refineries and gas plants, and assessed these methods for each of the as-received sludge deposits. For the oil-based sludge (see Sections IIIA and IIIB), samples were treated with a great care via dichloromethane followed by filtering within the filtration assembly (see Figures 1 and 2 of Sitepu and Zaidi (Reference Sitepu and Zaidi2017) – for details). Approximately 0.5 g by weight of inorganic crystalline deposits (i.e., insoluble part or nonhydrocarbon) were measured by powder XRD (Klug and Alexander, Reference Klug and Alexander1974). Sequentially, the phases within powder XRD data are identified by using a combination of both the Malvern-PANalytical High Score Plus (Degen et al., Reference Degen, Sadki, Bron, König and Nénert2014) software package and that of the Powder Diffraction File (PDF), PDF-4+ release 2023 (ICDD, 2018) from the International Centre for Diffraction Data (ICDD), see Section IA. All of the identified phases were analyzed by quantitative Rietveld analysis with the generalized spherical harmonic description for preferred orientation correction (see Sections IIC, IIIB.1, IIIB.2, IIIB.3, and IIIB.4). Additionally, for materials produced with sulfur product (see Section IIIB.5), deposits required that analysis be performed without pretreatment.
Schematics of the (a) parts of the powder XRD goniometer and optics and (b) integration of XRF with powder XRD as well as with the Rietveld method (Sitepu et al., Reference Sitepu, AlYami and Al-Zahrani2024).

The Rietveld fit for the whole powder XRD pattern of the inorganic crystalline materials of scale deposits in the form of calcite (CaCO3) obtained from the Rietveld refinement with a generalized spherical harmonic description for preferred crystallographic orientation correction. The observed data are indicated by a plus sign and the calculated profile is the solid line in the same field. The sets of vertical lines below the profiles represent the positions of all possible Bragg reflections for the calcite phase.

A. Quantitative analysis of the inorganic deposits by the powder XRD approach
Fawcett et al. (Reference Fawcett, Kabekkodu, Blanton and Blanton2017) and Gates-Rector and Blanton (Reference Gates-Rector and Blanton2019; and references therein) have described the ICDD-PDF-4+ database Release 2023 (ICDD, 2018) primarily as a quality reference tool for the powder diffraction community. Therefore, ICDD edits, publishes, and distributes powder XRD data to facilitate the identification of materials. This article as well as previous works document the use of the PDF database for phase identification (i.e., qualitative analysis, chemical analysis, or finger print) of powder XRD data from the crystalline deposits (Sitepu et al., Reference Sitepu, AlYami and Al-Zahrani2024; and references therein).
The ICDD-PDF + 4 database Release 2023 (ICDD, 2018) contains numerous crystallographic information files (CIFs) of crystalline materials that can be used to determine the phase identification of powder diffraction data. Jenkins et al. (Reference Jenkins, Holomany and Wong-Ng1987) pointed out that since 1941, the PDF has been the primary qualitative crystalline phase identification reference for powder diffraction data. Subsequently, Gates et al. (Reference Gates, Blanton and Fawcett2014) extended the ICDD-PDF database to semi-crystalline and amorphous (noncrystalline) materials. The ICDD-PDF database also provides the details of the crystal structure of many crystalline materials (e.g., space group, lattice parameters, atomic coordinates, and thermal parameters) which can be used to perform phase identification and quantitative phase analysis by the Rietveld method (Hill and Howard, Reference Hill and Howard1987; Bish and Howard, Reference Bish and Howard1988; O'Connor and Raven, Reference O'Connor and Raven1988; Madsen et al., Reference Madsen, Scarlett, Cranswick and Lwin2001; Scarlett et al., Reference Scarlett, Madsen, Manias and Retallack2001, Reference Scarlett, Madsen, Cranswick, Lwin, Edward Groleau, Stephenson, Mark Aylmore and Agron-Olshina2002; O'Dwyer and Tickner, Reference O'Dwyer and Tickner2008; Madsen et al., Reference Madsen, Scarlett, Riley and Raven2013; Whitfield, Reference Whitfield2016; Raven and Self, Reference Raven and Self2017; Ufer and Raven, Reference Ufer and Raven2017; Rowles, Reference Rowles2021; Greasley et al., Reference Greasley, Goolcharan and Andrews2022). Additionally, the Rietveld method can be used to diagnose crystallographic preferred orientation (Li et al., Reference Li, O'Connor, Roach and Cornell1990; O'Connor et al., Reference O'Connor, Li and Sitepu1991, Reference O'Connor, Li and Sitepu1992); extract quantitative texture and orientation details (Von Dreele, Reference Von Dreele1997; Sitepu et al., Reference Sitepu, Schmahl and Von Dreele2002, Reference Sitepu, O'Connor, Brockmeier, Benmarouane, Hansen and Ritter2004); and facilitate crystallographic information via crystal structure refinement (Li et al., Reference Li, O'Connor, Roach and Cornell1990; Sitepu, Reference Sitepu2002, Reference Sitepu2009; Sitepu et al., Reference Sitepu, O'Connor and Li2005; Kaduk et al., Reference Kaduk, Crowder, Zhong, Fawcett and Suchomel2014, Reference Kaduk, Dosen and Blanton2024).
Gates-Rector and Blanton (Reference Gates-Rector and Blanton2019; and references therein) highlighted that the ICDD-PDF-4+ crystallographic database release 2023 (ICDD, 2018) contains structure details within database entries that are useful for phase identification and materials characterization of inorganic and organic diffraction data collected by X-ray, synchrotron, and neutron powder diffraction techniques. Additionally, the database is editorially reviewed and processed according to ISO 9001:2015 and is certified via these quality management requirements. Moreover, the database has been developed as both computer and web accessible and serves a wide range of disciplines covering academic, industrial, and government laboratories.
The greatest advantage of phase identification of powder XRD data with the combined Malvern-PANalytical High Score Plus software (Degen et al., Reference Degen, Sadki, Bron, König and Nénert2014) and the ICDD-PDF + 4 software release 2023 (ICDD, 2018) compared to the other analytical techniques (e.g., X-ray fluorescence, induced-coupled plasma, atomic absorption, etc.) is that the phase identification results can be used to accurately differentiate between different forms of a chemical compound with the same chemical formula, see Section IIB. For example, Sitepu (Reference Sitepu2020; and references therein) described that calcium carbonate minerals calcite (CaCO3), aragonite (CaCO3), and vaterite (CaCO3), which have different crystallographic structures, can be identified as scale formation materials (e.g., calcite or scale deposits [aragonite] or vaterite). Additionally, iron sulfides corrosion products − pyrite (FeS2), marcasite (FeS2), mackinawite (FeS0.9), pyrrhotite (Fe7S8), and greigite (Fe3S4) chemical compositions and with different crystalline structures − can be identified. It is very important to know the form of an iron sulfide because some of these iron sulfides are pyrophoric (pyrrhotite – FeS), presenting a risk of igniting. Moreover, the phase identification results of the powder XRD data can also differentiate among the hydration states of the calcium sulfate hydrate compounds − gypsum (CaSO4·2H2O) from basanite (CaSO4·0.5H2O) and both from anhydrite (CaSO4).
B. Texture and crystal structure refinement by the Rietveld method with the generalized spherical harmonic description for preferred orientation correction
The orientation distribution function used in quantitative texture analysis relies on pole-figure measurements (Bunge, Reference Bunge1982). Von Dreele (Reference Von Dreele1997) incorporated texture analysis (Bunge, Reference Bunge1982; Popa, Reference Popa1992) in the GSAS (Larson and Von Dreele, Reference Larson and Von Dreele2004; Toby and Von Dreele, Reference Toby and Von Dreele2013) Rietveld refinement software for whole diffraction patterns. Rietveld refinement procedures with the generalized spherical harmonic method (Bunge, Reference Bunge1982) for the orientation distribution function has been used successfully (Bunge, Reference Bunge1982; Popa, Reference Popa1992; Von Dreele, Reference Von Dreele1997). To apply the generalized spherical harmonic description, which is generated using selection rules depending on the crystal symmetry of the phase under investigation, the general axis distribution A(ϕ, β, ψ, γ) was used (Bunge, Reference Bunge1982; Popa, Reference Popa1992; Von Dreele, Reference Von Dreele1997):
 $$\eqalign{A( \phi , \;\beta , \;\psi , \;\gamma ) {\rm} &= 1 + \sum\limits_{l = 2}^L {\left({\displaystyle{{4\pi } \over {2l + 1}}} \right)\;\cdot\; }\sum\limits_{m = {-}1}^{ + l} {\sum\limits_{n = {-}1}^{ + l}} \cr & \quad \times{C_l^{mn} K_l^m ( \phi , \;\beta ) K_l^n ( \psi , \;\gamma ) } } } $$
The harmonic terms −  $K_l^m ( \phi , \;\beta )$ and
 $K_l^n ( \psi , \;\gamma )$ − take on values according to the crystal and sample symmetries, respectively. The modified symmetry terms correspond to the angular portions of the atomic orbitals familiar to chemists (Sitepu, Reference Sitepu2009). Terms with l = 0 correspond to s orbitals, and so are not useful for describing preferred orientation. Since diffraction patterns (ignoring the effects of resonant scattering) are centrosymmetric, terms with l odd (which yield noncentrosymmetric orbitals) are not useful for describing preferred orientation. Terms with l = 2 correspond to d-orbitals, l = 4 correspond to g-orbitals, etc. (Bunge, Reference Bunge1982; Popa, Reference Popa1992; Von Dreele, Reference Von Dreele1997). In the diffraction experiment, the crystal (ϕ, β) and sample (ψ, γ) coordinates are determined by the choice of reflection indices (hkl) and sample orientation on the diffractometer, respectively. The texture is then completely described by the set of
 $C_l^{mn}$ diffraction data, all the harmonic coefficients are zero, and therefore, the general axis distribution is unity. The magnitude of the texture can be evaluated from the texture index, J (Bunge, Reference Bunge1982) according to
 $$J{\rm} = 1{\rm} + \sum\limits_{l = 2}^L {\left[{\displaystyle{1 \over {2l + 1}}} \right]} \cdot \sum\limits_{m = {-}l}^l {^{} \sum\limits_{n = {-}l}^l {{\vert {C_l^{mn} } \vert }^2} } $$
Equation (2) was determined from the Rietveld refinement with the generalized spherical harmonic description. In the case of an ideal random orientation, the texture index is unity (Von Dreele, Reference Von Dreele1997).
Rietveld (Reference Rietveld1969), Young (Reference Young1993), and Hewat et al. (Reference Hewat, David and van Eijck2016) described that the Rietveld method adjusts the refinable parameters until the best fit of the entire powder XRD calculated pattern to the entire measured pattern is achieved to acquire crystal structure and texture details from the experimental data set. Larson and Von Dreele (Reference Larson and Von Dreele2004) and Toby and Von Dreele (Reference Toby and Von Dreele2013) developed the below mathematical method that calculates an intensity, Yc, at every point in the pattern, and originally implemented it in the general structure analysis system (GSAS) Rietveld refinement program, i.e.,
 $$Y_c{\rm} = \sum\limits_h {{SKF}_h^2 P( \Delta T_h) {\rm} + Y_b} $$
where the first term is the Bragg scattering, containing a scale factor S, a correction factor K, a structure factor Fh, and a profile function P(ΔTh), as determined by the displacement ΔTh of the profile point from the reflection position, and the second term Yb is the background intensity. The sum is over all profile points in all the scans included in the refinements. Within the correction factor K in Eq. (3) is a term that describes the change in intensity for a Bragg reflection due to texture, i.e., crystallographic preferred orientation of crystalline materials of X-ray, synchrotron, and neutron powder diffraction data (Dollase, Reference Dollase1986; O'Connor et al., Reference O'Connor, Li and Sitepu1991, Reference O'Connor, Li and Sitepu1992; Popa, Reference Popa1992; Von Dreele, Reference Von Dreele1997), see Eqs. (1) and (2).
Larson and Von Dreele (Reference Larson and Von Dreele2004) and Toby and Von Dreele (Reference Toby and Von Dreele2013) described that least squares optimization of Rietveld parameters, which is the minimization of the weighted sum of the squared residual over n observations, can be calculated from the following equation:
 $$R{\rm} = \sum\limits_{i = 1}^n {w_i} ( {Y_i-Y_{ci}} ) ^2$$
where wi is the weighting factor for phase i, Yi is the measured intensity, and Yci is the calculated intensity, see Eq. (3). The sum is the total of over all profile points in all the scans included in the refinement. Rietveld (Reference Rietveld1969), Young (Reference Young1993), McCusker et al. (Reference McCusker, Von Dreele, Cox, Louër and Scardi1999), Larson and Von Dreele (Reference Larson and Von Dreele2004), Toby and Von Dreele (Reference Toby and Von Dreele2013), and Hewat et al. (Reference Hewat, David and van Eijck2016) pointed out in details the mathematical formulae used in the Rietveld refinement to determine the crystallographic R-factors, R p and R wp, which are given by
 $$R_{\rm p} = \sum {\vert {Y_o-Y_c} \vert } {\rm /}\sum {Y_o} $$
 $$R_{\rm {wp}} = \left({M{\rm /}\sum w Y_o^2 } \right)$$
In the present study, the GSAS Rietveld program was used to analyze single-wavelength powder XRD data, in which the generalized spherical harmonic is generated using selection rules depending on the crystal symmetry of the phase under investigation (Von Dreele, Reference Von Dreele1997). One of the objectives of the present study was to characterize the preferred crystallographic orientation and perform crystal structure refinement using powder XRD data of the inorganic crystalline deposits – calcite (CaCO3). The texture and crystal structure refinement of the powder XRD data for calcite were conducted by using the Rietveld method with the generalized spherical harmonic description to extract the preferred crystallographic description directly from a refinement of powder XRD data, see Section IIIA.
C. Quantitative phase analysis by the Rietveld method
Hill and Howard (Reference Hill and Howard1987), O'Connor and Raven (Reference O'Connor and Raven1988), Bish and Howard (Reference Bish and Howard1988), and Madsen et al. (Reference Madsen, Scarlett, Cranswick and Lwin2001, Reference Madsen, Scarlett, Riley and Raven2013) described that quantitative phase analysis (or phase composition, wt%) of multicomponent mixtures using neutron, synchrotron, and X-ray powder diffraction data is being used worldwide to determine the phase composition for each of the identified phases. This quantitative phase analysis method does not require measurement of calibration data or the use of an internal standard; however, knowing the approximate crystal structure for each of the identified phases of interest in a mixture is necessary. The use of an internal standard (Hill and Howard, Reference Hill and Howard1987; Bish and Howard, Reference Bish and Howard1988; O'Connor and Raven, Reference O'Connor and Raven1988; Degen et al., Reference Degen, Sadki, Bron, König and Nénert2014; ICDD, 2018) will allow the determination of total amorphous phase content in a mixture. Quantitative phase analysis (phase composition or wt%), i.e., Wp, for each of the identified phases, p, is proportional to the product of the scale factor, s, as derived in the Rietveld refinement, with the mass and volume of the unit cell according to
 $$W_p{\rm} = s_p( {\rm ZMP}) _p/\sum\limits_{i = 1}^n {s_i{( {\rm ZMV}) }_i} $$
where Z is the number of formula units per unit cell, M is the mass of the formula unit, and V is the unit-cell volume (Å 3), respectively. The disadvantages of the quantitative phase analysis by the Rietveld method are that the analysis is typically standardless, generally returns relative abundances, is typically limited to well-defined crystalline species, and the accuracy can be difficult to determine (and therefore may sometimes yield only semi-quantitative results). A major advantages of the quantitative phase analysis by the Rietveld method is that the calibration constants are computed from simple literature data (i.e., Z, M, and V values) rather than by laborious experimentation calibration. An additional advantage is that all reflections in the pattern are explicitly included, irrespective of overlap. Moreover, the background is better defined since a continuous function is fitted to the whole powder diffraction pattern. Furthermore, the preferred orientation effects can be corrected (Dollase, Reference Dollase1986; Li et al., Reference Li, O'Connor, Roach and Cornell1990; O'Connor et al., Reference O'Connor, Li and Sitepu1991, Reference O'Connor, Li and Sitepu1992; McCusker et al., Reference McCusker, Von Dreele, Cox, Louër and Scardi1999) and determined (Popa, Reference Popa1992; Järvinen, Reference Järvinen1993; Von Dreele, Reference Von Dreele1997; Matthies et al., Reference Matthies, Pehl, Wenk, Lutterotti and Vogel2005; Sitepu, Reference Sitepu2009; Peterson et al., Reference Peterson, Fancher, Frontzek, Bunn, Payzant, An and Agnew2022). Subsequently, crystal structure parameters (Li et al., Reference Li, O'Connor, Roach and Cornell1990; Sitepu, Reference Sitepu2002, Reference Sitepu2009; Sitepu et al., Reference Sitepu, O'Connor and Li2005; Kaduk et al., Reference Kaduk, Dosen and Blanton2024; and references therein) as well as peak profile parameters can be refined as part of the same analysis, enabling improved accurate quantitative phase analysis results for each of the identified phases (Hill and Howard, Reference Hill and Howard1987; Bish and Howard, Reference Bish and Howard1988; O'Connor and Raven, Reference O'Connor and Raven1988; Madsen et al., Reference Madsen, Scarlett, Riley and Raven2013).
The main challenge of the present study was to accurately and precisely separate, measure, and identify powder XRD data of the unknown inorganic crystalline deposits collected from the affected equipment in refineries and gas plants. Once all the phases had successfully been identified within each of the unknown crystalline deposits’ resulting powder XRD data, then the quantitative phase analysis of powder XRD data for each of the identified phases was determined using the Rietveld method with the generalized spherical harmonic description for preferred crystallographic orientation correction (Sitepu, Reference Sitepu2009; and referenced therein).
II. EXPERIMENTAL
A. Sample preparation
Oil-based sludge was treated with dichloromethane and then filtered in the filtration assembly (see Figures 1 and 2 of Sitepu and Zaidi (Reference Sitepu and Zaidi2017) – for details), and therefore, the dichloromethane insoluble part, i.e., inorganic crystalline materials or nonhydrocarbon, were measured by powder XRD data approximately 0.5 g by weight of the unknown inorganic crystalline (see Section IIB) and subsequently identified by using the combined Malvern-PANalytical High Score Plus software (Degen et al., Reference Degen, Sadki, Bron, König and Nénert2014) with the ICDD of the PDF-4+ release 2023 (ICDD, 2018), see Section IIC. Once all the phases had successfully been identified, subsequently: (a) the texture and crystal structure refinement of calcite (CaCO3) (see Section IIIA) and (b) the quantitative phase analysis of powder XRD data for each of the identified phases (see Section IIIB) were determined using the Rietveld method with the generalized spherical harmonic description for crystallographic preferred orientation (see Section IID).
The limitation of the method of sample preparation procedures described by Sitepu and Zaidi (Reference Sitepu and Zaidi2017) and Sitepu and Al-Ghamdi (Reference Sitepu and Al-Ghamdi2019) was extended to identify and quantify the powder XRD data of the inorganic crystalline deposits present in the sludge deposit samples, received from many different affected plant equipment items, located in refineries and gas plants (Sitepu, Reference Sitepu2020; Sitepu et al., Reference Sitepu, AlYami and Al-Zahrani2024). A prerequisite is the accurate phase identification or qualitative analysis results of powder XRD data of the crystalline deposits (or the insoluble parts) (see Section IIC) and quantitative Rietveld analysis (see Section IID) for each of the identified phases.
B. Powder XRD data measurements
The crystalline deposits (i.e., nonhydrocarbon or insoluble part) were manually ground by an agate mortar and a pestle for several minutes to achieve a fine particle size, and mounted into the special powder XRD sample holders by front pressing. Subsequently, step-scanned patterns were measured with a Malvern-PANalytical Bragg-Brentano powder XRD diffractometer fitted with a graphite diffracted beam monochromator at room temperature with a copper X-ray tube (monochromatic Cu Kα 1 = 1.54060 Å) and operated at 40 kV and 40 mA. The powder XRD data were measured from 10 to 120° in 2θ Bragg-angle. An X'celerator position sensitive detector (PSD) was used with a scanning step time of 10 s that ensured reasonable intensity counting statistics. The PSD length in 2θ was 2.12°, with irradiated and specimen lengths of 1 and 10 mm, respectively. A detector step size of 0.04 was employed to provide adequate sampling of the peaks (full width at the half maximum [FWHM]) at approximately 0.11–0.34°, which is consistent with the guidelines described by Hill (Reference Hill1993) who showed that increasing counting times beyond 1 s per step, and reducing the step size below 0.04° in 2θ Bragg angle made negligible improvement to Rietveld parameter estimated standard deviations and crystallographic R-factors (Li et al., Reference Li, O'Connor, Roach and Cornell1990; O'Connor et al., Reference O'Connor, Li and Sitepu1991, Reference O'Connor, Li and Sitepu1992; Sitepu et al., Reference Sitepu, O'Connor and Li2005). All of the samples were spun during the data collection to improve particle counting statistics (Sitepu et al., Reference Sitepu, O'Connor and Li2005); therefore, the intensities were not dominated by a small number of crystallites (Li et al., Reference Li, O'Connor, Roach and Cornell1990; O'Connor et al., Reference O'Connor, Li and Sitepu1991, Reference O'Connor, Li and Sitepu1992; Sitepu et al., Reference Sitepu, AlYami and Al-Zahrani2024; and references therein). Additionally, all of the powder XRD data sets of the inorganic crystalline deposits were then identified by the software package Malvern-High Score Plus software (Degen et al., Reference Degen, Sadki, Bron, König and Nénert2014) combined with the ICDD of the PDF-4+ database release 2023 (ICDD, 2018) (see Section IIC).
C. Phase identification (or qualitative analysis)
In this paper, the Malvern-PANalytical High Score Plus software (Degen et al., Reference Degen, Sadki, Bron, König and Nénert2014), combined with the ICDD of the PDF-4+ database of the standard reference materials − release 2023 (ICDD, 2018; Gates-Rector and Blanton, Reference Gates-Rector and Blanton2019), was used by the authors to determine the phase identification of the powder XRD data of the crystalline deposits present at the sludge samples, which is an excellent analytical technique used for the phase identification of powder XRD data (Sitepu et al., Reference Sitepu, AlYami and Al-Zahrani2024; and references therein). Importantly, powder XRD analysis of the crystalline materials portion of the sludge deposits can accurately be used to differentiate between different crystallographic forms of a calcium carbonate (CaCO3) scale formation [e.g., calcite or scale deposits (aragonite) or vaterite]. Additionally, the iron sulfide corrosion products have a wide range of chemical compositions and different crystalline structures; for example, marcasite (orthorhombic), greigite (cubic), and mackinawite (tetragonal).
D. Quantitative phase analysis (or phase composition, wt%) by the Rietveld method
The comprehensive studies for quantitative phase analyses in this study were conducted following the guidance provided in Hill and Howard (Reference Hill and Howard1987), Bish and Howard (Reference Bish and Howard1988), O'Connor and Raven (Reference O'Connor and Raven1988), and Madsen et al. (Reference Madsen, Scarlett, Cranswick and Lwin2001, Reference Madsen, Scarlett, Cranswick and Lwin2013, and references therein). In a similar manner to these past studies, Rietveld methodology was used in this study to determine the quantitative phase analysis (i.e., phase composition, wt%) for each of the identified phases. Additionally, whole X-ray powder diffraction patterns were simultaneously refined with the crystal structures for each of the identified phases along with the profile function of the instrument. Moreover, the parameters refined for random crystallite orientation, and subsequently with the generalized spherical harmonic description for preferred orientation correction were the same as those described by Sitepu et al. (Reference Sitepu, O'Connor and Li2005).
In the applied X-ray crystallography formulations, Rietveld quantitative phase analysis (or phase composition, wt%) means the weight percentage for each of the identified crystalline materials (i.e., they are summed to 100.00%). Note that all the powder XRD data were collected at room temperature. Additionally, and most importantly, the phase identification of powder XRD data from the crystalline materials portion of the deposits as well as quantitative phase analysis via the Rietveld method with the generalized spherical harmonic description for preferred orientation correction can accurately be used to differentiate between different forms of a calcium carbonate (CaCO3). Calcite has hexagonal structure with the space group of R-3c (No. 167) and cell parameters of a = 4.988 Å, c = 17.068 Å, aragonite has orthorhombic structure with the space group of Pnam (nonstandard settings of Pnam, No. 62) and cell parameters of a = 5.743 Å, b = 7.969 Å, and c = 4.962 Å, and vaterite has hexagonal structure with the space group of P63/mmc (No. 194) and cell parameters of a = 7.135 Å and c = 16.98 Å (Hazen et al., Reference Hazen, Downs, Jones and Kah2013; Sitepu et al., Reference Sitepu, AlYami and Al-Zahrani2024; and references therein).
III. RESULTS AND DISCUSSION
Texture and structural refinement and quantitative phase analysis results obtained from the Rietveld method with the generalized spherical harmonic description for the inorganic crystalline deposits portion of the as-received unknown sludge deposits from refineries and gas plants enabled insights into the everyday processes and failure modes for these industrial facilities. Subsequently, the authors used the findings to support the failure investigation analysis of the affected equipment at many different locations in refineries and gas plants. Each of the (i) texture and structural refinement (see Section IIIA) and (ii) quantitative Rietveld analysis results (see Section IIIB) will be described in turn below.
A. Structural and texture refinement results of calcite (CaCO3)
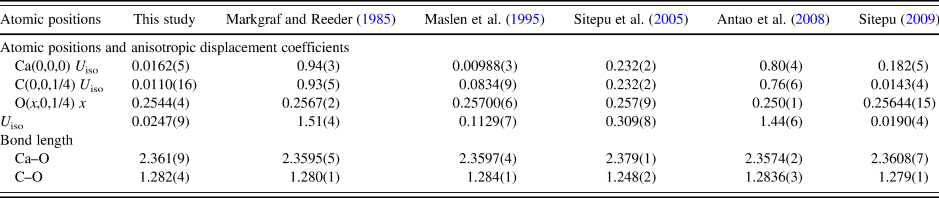
Calcite (CaCO3) was identified from the insoluble portion of the sludge deposits from a gas plant. Preferred orientation modeling for a powder XRD pattern of the calcite mineral (see Tables II–IV for more details) revealed reasonable crystal structure parameters that agreed with the powder XRD single-crystal data of calcite (Markgraf and Reeder, Reference Markgraf and Reeder1985; Maslen et al., Reference Maslen, Streltsov, Streltsova and Ishizawa1995; Sitepu et al., Reference Sitepu, O'Connor and Li2005; Antao et al., Reference Antao, Hassan, Wang, Lee and Toby2008; Sitepu, Reference Sitepu2009) when applying corrections to the intensities in the Rietveld refinement using the generalized spherical harmonic description. Principally, the method can also be used to obtain reasonable structure parameters in textured samples (Von Dreele, Reference Von Dreele1997; Sitepu et al., Reference Sitepu, Schmahl and Von Dreele2002, Reference Sitepu, O'Connor and Li2005; Sitepu, Reference Sitepu2009); however, one must also properly model the texture (i.e., orientation parameters) along with the structural parameters of the refined phase. If the texture of the sample is important, it should be possible to refine reasonable crystal structure parameters of a single powder XRD data set only if the texture can be approximated by a model with cylindrical symmetry with respect to the single powder XRD pattern. If the sample is spun during the data measurements, then cylindrical symmetry is assured. Therefore, the generalized spherical harmonic description is recommended for the preferred crystallographic orientation correction in whole powder XRD pattern refinement of calcite (see Tables II–IV for more details) obtaining both texture and crystallographic parameters (Von Dreele, Reference Von Dreele1997; Sitepu et al., Reference Sitepu, Schmahl and Von Dreele2002, Reference Sitepu, O'Connor and Li2005; Sitepu, Reference Sitepu2009). See Tables II–IV for details of the refinement results.
Summary of the refined cell parameters of calcite (CaCO3) of the approximately 0.5 g by weight of the inorganic crystalline materials of scale deposits in the form of calcite (CaCO3) obtained from the Rietveld refinement with a generalized spherical harmonic description for the preferred orientation correction.

The space group used was R-3c (No. 167) (Maslen et al., Reference Maslen, Streltsov, Streltsova and Ishizawa1995). Wyckoff coordinates: 6(c) are 0,0,0, and 0,0,1/2; 6(a) are 0,0,3/4; and 18(e) are x,0,1/4; −x,−x,1/4; −x,0,3/4; 0,−x,3/4; and x,x,3/4. Cell formula units Z = 6 and chemical formula weight = 100.09. The number in parentheses gives the estimated standard uncertainty for the least significant figure of the parameter.
Summary of the refined atomic positions of the approximately 0.5 g by weight of the inorganic crystalline materials of scale deposits in the form of calcite (CaCO3) obtained from the Rietveld refinement with a generalized spherical harmonic description for the preferred orientation correction.

The space group used was R-3c (No. 167) (Maslen et al., Reference Maslen, Streltsov, Streltsova and Ishizawa1995). Wyckoff coordinates: 6(c) are 0,0,0 and 0,0,1/2; 6(a) are 0,0,3/4; and 18(e) are x,0,1/4; −x,−x,1/4; −x,0,3/4; 0,−x,3/4; and x,x,3/4. Cell formula units Z = 6 and chemical formula weight = 100.09. j = texture index the standard and the deviation is not included as it is unavailable from the GSAS program. The number in parentheses gives the estimated standard uncertainty for the least significant figure of the parameter.
Summary of the figure-of-merit and goodness-of-fit index of approximately 0.5 g by weight of the inorganic crystalline materials of scale deposits in the form of calcite (CaCO3) obtained from the Rietveld refinement with a generalized spherical harmonic description for the preferred orientation correction.

When the structural and texture refinement was conducted on the whole powder XRD pattern of calcite by using the Rietveld method with the generalized spherical harmonic description, the calculated and the measured patterns agreed well (goodness-of-fit index (χ 2 = 1.32)) − see Figure 2 for details. Note that φ is the angle between the pressing axis and the normal of the (104) calcite plane. Figure 3 shows the plots of the pole density distribution function for <104> calcite data derived from the Rietveld refinement with the generalized spherical harmonic description with an orientation angle. It can be seen from Figure 3 that the pole density distribution function is not unity, indicating that the whole powder XRD pattern of calcite is textured (i.e., texture index, J = 1.0854(7)), because in the case of an ideal random orientation sample − pole density distribution function for <104> calcite data is unity (i.e., texture index, J = 1.00). As expected, the pole density distribution function for <104> calcite data is maximum at the orientation angle φ = 0° and minimum at φ = 90°. Note that φ is the angle between the pressing axis and the normal of the (104) calcite plane.
The pole density distribution plot for <104> for calcite (CaCO3) data is derived from the Rietveld refinement with a generalized spherical harmonic description for the preferred orientation correction. The pole density distribution function is maximum at the orientation angle φ = 0° and minimum at φ = 90°. The φ is the angle between the pressing axis and the normal of the (104) calcite plane. The pole density distribution function is unity if the corrosion deposits are randomly oriented, and yields no variation between the crystallographic orientation correction factor and the orientation angle (i.e., straight line).

The crystallographic figure-of-merit − R p, R wp, and R(F 2) − and goodness-of-fit index (χ 2)) − obtained from the Rietveld refinement of the whole powder XRD pattern of calcite without included the generalized spherical harmonic description for the preferred orientation correction (i.e., randomly oriented) are R p = 18.56, R wp = 22.04, R(F 2) = 17.32, χ 2 = 2.5. The corresponding values obtained from the Rietveld refinement of the whole powder XRD pattern of calcite with the generalized spherical harmonic description are R p = 9.75, R wp = 13.30, R(F 2) = 10.15, χ 2 = 1.32, and J = 1.00854(7), see Table IV. The generally lower goodness-of-fit index and crystallography R-factors obtained from the Rietveld refinement of the whole powder XRD pattern of calcite with the generalized spherical harmonic description than the Rietveld results assuming random orientation, which agreed well with the results reported by Sitepu et al. (Reference Sitepu, O'Connor and Li2005), indicates that the generalized spherical harmonic description should be used for correction of the preferred orientation in powder XRD analysis, for both crystal structure refinement and quantitative phase analysis (i.e., phase composition, wt%).
This Rietveld refinement of the whole powder XRD pattern of calcite with the generalized spherical harmonic description has been extended to perform quantitative phase analysis of the crystalline materials of corrosion products (see Section IIIB) in order to improve the phase composition results.
B. Quantitative phase analysis results
1. Iron oxide corrosion products from the boiler tube equipment in a gas plant
The refined structural parameters for the identified phases – magnetite (Fe3O4), hematite (Fe2O3), goethite (FeO(OH)), and silicon oxide (i.e., quartz [SiO2]) phases – agreed well with the corresponding results reported in the literature (Blake et al., Reference Blake, Hessevick, Zoltai and Finger1966; Antao et al., Reference Antao, Hassan, Wang, Lee and Toby2008). Figure 4 depicts the agreement between the calculated and measured powder XRD patterns of the crystalline materials portion of the sludge deposits from the boiler tube equipment in a gas plant. The Rietveld refinement with the generalized spherical harmonic description is illustrated in Figure 4 showing the presence of iron oxide corrosion products in the form of magnetite (Fe3O4), hematite (Fe2O3), goethite (FeO(OH)), and the formation material in the form of silicon oxide (i.e., quartz [SiO2)]. The observed data are indicated by a plus sign and the calculated profile is the solid line in the same field. The sets of vertical lines below the profiles represent the positions of all possible Bragg reflections for the magnetite, hematite, goethite, and quartz phases.
The comparison between the calculated and measured powder XRD patterns from 0.6 to 6.0 Å of the d-spacings (horizontal) for the corrosion deposits from the boiler following the Rietveld refinement with a generalized spherical harmonic description for the preferred orientation correction. The observed data are indicated by a plus sign and the calculated profile is the solid line in the same field. The sets of vertical lines below the profiles represent the positions of all possible Bragg reflections for the magnetite, hematite, goethite, and quartz phases.

Figure 5 shows the variation in the quantitative phase analysis (phase composition or weight percentage (wt%)) obtained from the Rietveld refinement with the March model for the crystallographic preferred orientation correction with the identified phases. It can be seen from Figure 5 that 98.36 wt% of the corrosion product is derived from Fe-based compounds, specifically 45.24 wt% of hematite (Fe2O3), 35.26 wt% of magnetite (Fe3O4), and 17.86 wt% of goethite (FeO(OH)) phases for the corrosion deposit, with the remaining 1.64 wt% from sandstone or sand in the form of quartz (SiO2) phase.
Variation between the quantitative phase analysis results (wt%) obtained from the Rietveld refinement with the generalized spherical harmonic description for the crystallographic preferred orientation correction and the identified phases for corrosion deposits from the specific boiler equipment in the gas plant.

Figure 6 shows the variation between the preferred crystallographic orientation correction factor (or pole density distribution function) and the orientation angle both for corrosion product in the form of the <001> magnetite (Fe3O4) and <001> hematite (Fe2O3) obtained from the Rietveld refinement with the generalized spherical harmonic description. In comparison with initial Rietveld results assuming random orientation (the crystallographic figure-of-merit − R p = 20.93, R wp = 17.35, R(F 2) = 15.31, and goodness-of-fit index χ 2 = 3.12), the corresponding values for all XRD data sets decreased substantially when the Rietveld refinement was conducted using the generalized spherical harmonic description (R p = 10.05, R wp = 13.57, R(F 2) = 8.97, χ 2 = 1.43; and J = 1.01075(4)). However, the goodness-of-fit index (χ 2) figure-of-merit still substantially exceed the ideal random powder diffraction value (χ 2 = 1.00). Note that the pole density distribution function is unity in case of the corrosion deposits are randomly oriented, and yields no variation between the crystallographic orientation correction factor and the orientation angle (i.e., straight line). It can be seen clearly from Figure 6 that the crystallographic preferred orientation correction factors of the corrosion deposits in the form of the <001> magnetite (Fe3O4) phase is higher than that of the corresponding value for the corrosion deposits in the form of the <001> hematite (Fe2O3), indicating that the deposits exhibit the pronounced preferred orientation (or texture of crystalline materials). Therefore, the XRD intensities of the corrosion deposits have to be corrected due to the preferred orientation by using the Rietveld refinement with the generalized spherical harmonic description both for the quantitative phase analysis (phase composition) and crystal structure refinement.
Variation between the March preferred orientation corrections with orientation angle derived from the Rietveld refinement with the generalized spherical harmonic description for the crystallographic preferred orientation correction and the identified phases for (a) the <001> magnetite (Fe3O4) and (b) the <001> hematite (Fe2O3). The pole density distribution function is maximum at the orientation angle φ = 0° and minimum at φ = 90°. The φ is the angle between the pressing axis and the normal of the (001) magnetite and hematite planes. The pole density distribution function is unity if the corrosion deposits are randomly oriented.

2. The synthetic mixture of barite, quartz, and hematite
In addition to iron oxide in the form of hematite (Fe2O3), the formation material in the form of silicon oxide (e.g., quartz [SiO2]) with the ICDD PDF number 01-077-1060 appears in almost all of the corrosion products and, therefore it has been included in the present study. Additionally, the mineral barite (e.g., barium sulfate [BaSO4]) is used in the oil drilling industry for lubrication and, therefore, it is of interest primarily in materials characterization research. Note that the deposits from the equipment at refineries and gas plants sometimes also consist of barite. Therefore, barite is included in this study. The density and color of this natural mineral make barite a valuable product. In each application, the purity and composition of the contaminants should be closely monitored as they may alter the properties and function of the material.
The authors extended the above work to the synthetic mixture of barite, quartz, and hematite powder and performed Rietveld quantitative analysis of the known mixture for testing the reliability and reproducibility of the Rietveld refinement when employing the generalized spherical harmonic description for the preferred orientation correction factor in order to improve the phase composition (wt%) results. The weight percentages (wt%) of the known mixture were prepared by barite (87.0 wt% by weight), quartz (10.0 wt% by weight), and hematite (3.0 wt% by weight). The texture index (see Eq. (2)) results obtained in this study are J = 1.09(8) for barite, J = 1.13(5) for quartz, and J = 1.31(4) for magnetite. Additionally, the quantitative phase analysis (phase composition, wt%) results were 87.8(7) wt% for barite, 9.7(2) wt% for quartz, and 2.5(3) wt% for hematite, respectively, which agreed reasonably well with the known values. The number in parentheses gives the estimated standard uncertainty for the least significant figure of the parameter. Additionally, the refined crystal structure parameters agreed well with the results reported in the literature for barite (Jacobsen et al., Reference Jacobsen, Smyth, Swope and Downs1998), quartz (Antao et al., Reference Antao, Hassan, Wang, Lee and Toby2008), and hematite (Blake et al., Reference Blake, Hessevick, Zoltai and Finger1966), see Table V and Figure 7. Therefore, it can be summarized that the Rietveld refinement – with the generalized spherical harmonic description for the crystallographic preferred orientation correction in powder XRD analysis – yields accurate, reliable, and reproducible results for both crystal structure refinement and quantitative analysis of the investigated deposits.
Summary of the refined structure parameters and weight percentage (wt%) results for the mixture of barite (87.0 wt% by weight), quartz (10.0 wt% by weight), and hematite (3.0 wt% by weight) obtained from the Rietveld refinement with the generalized spherical harmonic description.

The number in parentheses gives the estimated standard uncertainty for the least significant figure of the parameter.
Variation between the quantitative phase analysis results (wt%) obtained from the Rietveld refinement, with the generalized spherical harmonic description for the crystallographic preferred orientation correction, and the identified phases for the powder XRD data of the synthetic mixture of barite (87.0 wt% by weight), quartz (10.0 wt% by weight), and hematite (3.0 wt% by weight).

3. Iron oxide corrosion products from the equipment parts in a refinery
Rietveld quantitative analysis (phase composition, wt%) of the powder XRD data for all of the identified phases showed that the powder XRD data of crystalline materials (i.e., nonhydrocarbon part) of the sludge deposits from the equipment parts in a refinery consisted mainly of 82.0 wt% of iron oxide corrosion products in the form of 56.0 wt% of goethite (FeO(OH)), 15.0 wt% of magnetite (Fe3O4), and 11.0 wt% of lepidocrocite (FeO(OH)), 16.0 wt% of iron sulfide corrosion products in the form of 15.0 wt% of pyrite (FeS2) and 1 wt% of pyrrhotite (Fe7S8) phases, and mixed with the formation materials in the form of 2.0 wt% of quartz (SiO2) phase, see Figure 8. The observation of iron oxide corrosion products (i.e., goethite, magnetite, and lepidocrocite) on the samples suggests that at a high temperature magnetite will coat the iron/steel to prevent oxygen reaching underlying metal. In most cases, lepidocrocite formed at low temperature and with time it transformed into most stable goethite. Akaganeite is formed in marine environments. Additionally, iron sulfide corrosion products (i.e., pyrite and pyrrhotite) appear on the sample indicating that pyrophoric pyrrhotite (FeS) results from the corrosive action of sulfur or sulfur compounds (H2S) on the iron (steel) and moisture.
Variation between the weight percentage (wt%) and the identified phases for corrosion crystalline deposits from the specific boiler equipment in a gas plant, obtained from the Rietveld refinement with the generalized spherical harmonic description.

4. Vanadium oxide, sodium vanadium oxide, and sodium vanadium sulfate hydrate compounds found in the crystalline ash deposits portion from an external surface of the boiler tubes in a refinery
The phase identification of the powder XRD data, which show no amorphous inorganic phases present in the inorganic deposits, was conducted to determine the source and formation mechanism, and therefore the phase composition for each of the identified materials. These results can be used by the engineers to take corrective measures to prevent scale build-up and avoid future tube failure. Following Section IIIB.2, Figure 9 depicts the phase composition obtained from the Rietveld refinement with the generalized spherical harmonic description for each of the identified phases of powder XRD data of ash deposits from the external surface of the boiler tubes in a refinery, where the refinery boiler is an oil-fired boiler. The quantitative phase analysis (or phase composition, wt%) results revealed 70.0 wt% of vanadium oxide (V2O5), 15.0 wt% of sodium vanadium oxide (NaV2O5),13.0 wt% of sodium vanadium sulfate hydrate (Na2V(SO4)2⋅H2O), and 2 wt% mackinawite (FeS) compounds. However, texture parameters are not reported in this paper.
Phase composition results obtained from the Rietveld refinement with the generalized spherical harmonic description for each of the identified phases of powder XRD data of the crystalline ash deposits from the external surface of the boiler tubes in the refinery.

The findings obtained from the Rietveld quantitative phase analysis with the generalized spherical harmonic description suggest that when fuel oil is burned, approximately all of the vanadium and sodium compounds present in the fuel react with oxygen to form V2O5 and Na2O in the furnace and stick to the metal surface. When formed, the two compounds react on the metal surface and form a low melting phase sodium vanadate. Under optimum conditions, both V2O5 and Na2O can form a liquid flux that can protect the oxide scale, exposing the underlying metal to oxidation, and therefore, the ash deposits built up in the boiler tubes in a refinery pose potential corrosion problems. Additionally, when the NaV2O5 appeared in the ash deposits in the boiler tubes of a refinery, fuel-ash corrosion occurred. Fuel oils contain low quantities of vanadium, where sodium and sulfur were used to mitigate fuel-ash corrosion. The other options to prevent the formation of a low melting point phase of the sodium vanadate complexes is by adopting a fuel additive treatment.
5. Iron sulfide corrosion products, ammonium sulfide, and sodium iron sulfate compounds found in the crystalline portion of the sludge deposits from the affected equipment at the sulfur recovery unit
Figure 10 depicts the quantitative Rietveld analysis results for each of the identified phases appearing in all powder XRD data sets of a very small quantity of the inorganic crystalline materials part of the sludge deposits from the sulfur recovery unit. It can be seen from quantitative powder XRD results displayed in Figure 10 that the crystalline materials consist of corrosion products including iron sulfate along with sodium and ammonium iron sulfate. Quantitative Rietveld analysis for all of the powder XRD data sets (i.e., nine different locations inside the vessels of the sulfur recovery) revealed that the highest quantity of iron sulfate corrosion product appeared on condenser tube side #1 and condenser manway cover. Additionally, ammonium sulfate is the highest weight percentage (wt%) product for condenser #4. Moreover, sodium iron sulfate appears at the condenser tube side #1 and condenser #4, but not at the condenser manway cover. It is interesting to note that iron sulfite did not appear at both the condenser tube side #1 and at the condenser manway cover, whereas iron sulfite appears at condenser #4. Also, the trace phases include iron sulfate hydroxide at condenser tube side #1, and ammonium iron sulfate hydroxide at condenser manway cover, see Figure 10(a).
Quantitative Rietveld analysis (phase composition, wt%) results obtained from the Rietveld method with the generalized spherical harmonic description for the preferred orientation correction for all of the powder XRD data sets of crystalline materials part of deposits from the affected equipment at the sulfur recovery unit − (a) condenser tube side #1, condenser #4, and condenser manway cover; and (b) inlet head, waste tubes, condenser #1 tubes, condenser #4 inlets, condenser #4 tubes, and steam drum.

It can be seen from Figure 10(b) that iron oxide corrosion products in the forms of magnetite (Fe3O4) and hematite (Fe2O3) phases only appeared at the steam drum. Additionally, iron sulfate (Fe7S8), sodium iron sulfate (Na3Fe(SO4)3), and ammonium iron sulfates ((NH4)2Fe2(SO4)3) are the major phases that appeared at the condenser #4, condenser #1 tubes, condenser #4 Inlets, and Sample-8 (Condenser #4 tubes). It has to be emphasized that a high weight percentage (wt%) of magnetite (Fe3O4) phase appeared at the steam drum, indicating the presence of dissolved oxygen in the boiler feed water. These findings can guide the engineers at the affected refinery and gas plants to facilitate efficient cleaning of the equipment, by drawing up the right procedures and taking preventive action.
IV. CONCLUSIONS
In the present study, the authors used the High Score Plus software combined with the PDF-4+ database release 2023 (ICDD, 2018) to perform phase identification of powder XRD data sets derived from the crystalline deposits from various units of refineries and gas plants. Subsequently, the Rietveld method – with the generalized spherical harmonic description for the preferred orientation correction (Von Dreele, Reference Von Dreele1997; Sitepu, Reference Sitepu2002, Reference Sitepu2009; Sitepu et al., Reference Sitepu, O'Connor and Li2005, Reference Sitepu, AlYami and Al-Zahrani2024) – of the identified phases – was used to perform texture and crystal structure refinement of scale deposits (calcite – CaCO3) from the boiler equipment at a gas plant. And a quantitative phase analysis was done of the following: (i) iron oxide corrosion products from the boiler tube, (ii) synthetic mixtures of 87.0 wt% by weight of barite, 10.0 wt% by weight of hematite (Fe2O3), and 3.0 wt% by weight of quartz (SiO2), (iii) iron oxide corrosion products from the affected equipment parts in a refinery, (iv) vanadium oxide (V2O5), sodium vanadium oxide (NaV2O5), sodium vanadium sulfate hydrate (Na2V(SO4)2⋅H2O), and mackinawite (FeS) compounds found in the ash deposits part from an external surface of the boiler tubes in a refinery, and (v) iron sulfide corrosion products found at the affected equipment in the sulfur recovery unit. The results revealed:
• Phase identification of the powder XRD data of crystalline deposits obtained via the use of the PDF-4+ database is an excellent means to determine the nature, source, and formation mechanism of deposits formed by the processes in the various units of refineries and gas plants.
• Good agreement between the measured and calculated powder XRD patterns of crystalline scale deposits in the form of calcium carbonate (calcite – CaCO3) from the boiler equipment at a gas plant and the refined crystal structure parameters for calcite obtained from the Rietveld refinement with the generalized spherical harmonic description for the preferred crystallographic orientation correction agreed reasonably well with the powder XRD single-crystal data. Therefore, it is recommended to use this methodology for refinement of crystalline deposits from the refinery and gas plants.
• Magnetite, lepidocrocite, akageneite, pyrite, and pyrrhotite corrosion products appeared in crystalline deposits that were part of the sludge deposits from a refinery. At a high temperature, magnetite will coat the iron/steel to prevent oxygen reaching the underlying metal. At low temperature, lepidocrocite formed, and with time it transformed into the most stable goethite. Additionally, pyrophoric iron sulfide corrosion product, in the form of pyrrhotite (FeS), resulted from the corrosive action of sulfur or sulfur compounds (H2S) on the iron (steel) and moisture.
• Vanadium oxide, sodium vanadium oxide, and sodium vanadium sulfate hydrate compounds were found in the crystalline ash deposits on the external surface of the boiler tubes in a refinery, which suggest that the fuel is poor. Furthermore, the boiler feedwater contains dissolved oxygen, as the corrosion product in the form of hematite (Fe2O3) is present in the boiler deposits.
• Crystalline deposits from the steam drum equipment at the sulfur recovery unit consisted of a high quantity of magnetite, which indicates the presence of dissolved oxygen in the boiler feed water. The high quantity of magnetite and hematite (Fe2O3) are detected at the steam drum, and pyrrhotite, sodium iron sulfate, and ammonium iron sulfates are observed at the condenser.
• Accurately knowing which phases were involved in the crystalline scale and corrosion deposits can guide the field engineers at the refinery and gas plants to identify the root causes of the affected equipment, thereby enabling improved decision-making regarding the right procedures and preventive actions needed to stop the generation of those particular deposits. Therefore, the generalized spherical harmonic description is recommended for the preferred crystallographic orientation correction in powder XRD data analysis, for the quantitative analysis of the crystalline deposits from the refinery and gas plants.
ACKNOWLEDGMENTS
The authors thank the management of Saudi Aramco for permission to publish this article. Also, the authors thank the help provided by the RASD/CPAD/AAG professionals and technicians. The authors are grateful for constructive comments from the anonymous reviewers, Editor-in-Chief Dr. Camden Hubbard and Associate Editor Professor Jose Miguel Delgado who helped to improve the manuscript.
CONFLICTS OF INTEREST
The authors have no conflicts of interest to declare.