Introduction
Ever since in vitro maturation systems have been established for oocytes, embryonic research using cloning and transgenic technique has accelerated because it has been possible to obtain larger numbers of mature oocytes. In particular, compared with the in vivo collection of mature oocytes from large livestock animals such as cattle and pig, in vitro oocyte maturation systems have reduced the cost and time for researchers in acquiring mature oocytes. However, it remains a problem that only few cultured oocytes successfully form embryos after fertilization. In vitro matured oocytes normally display a worse developmental competence than those oocytes matured in vivo (Nagashima et al., Reference Nagashima, Grupen, Ashman and Nottle1996; Ratky et al., Reference Ratky, Rath and Brussow2003). One of the reasons for this low developmental potential is poor cytoplasmic maturation in oocytes cultured in vitro (Abeydeera, Reference Abeydeera2002). Among the factors that could affect cytoplasmic maturation, environmental stresses such as nutrients, amino acids, oxidation and pattern of hormonal stimulation are major factors that may cause in vivo and in vitro differences. Recent studies have tried to elucidate the factors that affect in vitro oocyte maturation with the aim of controlling them to achieve better cytoplasmic maturation (Lee et al., Reference Lee, Kang, Lee and Hwang2005; Faerge et al., Reference Faerge, Strejcek, Laurincik, Rath, Niemann, Schellander, Rosenkranz, Hyttel and Grondahl2006; Noguchi et al., Reference Noguchi, Yoshioka, Kaneko, Iwamura, Takahashi, Suzuki, Arai, Wada and Itoh2007; Funahashi et al., Reference Funahashi, Koike and Sakai2008).
However, it is practically impossible to determine every single stressful factor and control all of them simultaneously. Therefore, we adjusted our approach to focus on increasing the durability against in vitro stress as opposed to reducing in vitro stress. We hypothesised that more oocytes would maintain good cytoplasmic quality if we reinforced the ability of oocytes to endure those stressful factors in an in vitro environment, which differed from in vivo environments.
We considered the idea of autophagy as a mediator for responses to stress factors because autophagy is basically a cellular response to stress factors such as nutrient starvation (Mortimore & Poso, Reference Mortimore and Poso1987), amino-acid deprivation (Mortimore & Schworer, Reference Mortimore and Schworer1977) and oxidative stress (Han et al., Reference Han, Pan, Xu, Xiao, An, Tie, Pan and Li2012).
Autophagy is an evolutionarily conserved process in which intracellular proteins and organelles are sequestered in autophagosomes and are subsequently degraded by lysosomal enzymes in order to recycle cellular components to sustain metabolism and to prevent the accumulation of damaged proteins and organelles (Shintani & Klionsky, Reference Shintani and Klionsky2004; Mizushima, Reference Mizushima2007). Autophagy is a dynamic process that consists of several sequential stages (initiation, elongation, completion, maturation and degradation) that are controlled by a group of autophagy-related genes (Atg genes) (Xie & Klionsky, Reference Xie and Klionsky2007).
In pig embryo research, autophagy during in vitro development has been reported (Xu et al., Reference Xu, Cui, Sun, Lee, Li, Kwon, Lee, Hwang and Kim2011). However, autophagy prior to fertilization has not been studied in porcine oocyte in in vitro maturation systems. Indeed, there are no data to indicate the presence of autophagosomes during this stage in vitro.
Therefore, in this study, we investigated autophagosomes in porcine oocytes during in vitro maturation. We used western blotting and immunostaining of LC3-II, a marker of autophagosomes, to identify autophagosomes. We also performed a quantitative analysis of LC3-II protein in a time course of in vitro maturation.
Microtubule-associated protein light chain 3 (LC3)-II is a promising marker of autophagosomes. In mammals, the C-terminus of the LC3 protein is cleaved by mammalian Atg4 homologues to form LC3-I (Hemelaar et al., Reference Hemelaar, Lelyveld, Kessler and Ploegh2003). The cytosolic LC3-I protein conjugates with phosphatidylethanolamine (PE) via an ubiquitin-like enzymatic reaction to become LC3-II, which subsequently becomes associated with the autophagosomal membrane (Kabeya et al., Reference Kabeya, Mizushima, Ueno, Yamamoto, Kirisako, Noda, Kominami, Ohsumi and Yoshimori2000). Accordingly, the amount of LC3-II corresponds to the amount of autophagosomes.
We treated in vitro cultures with two kinds of inhibitors to confirm the occurrence of autophagic induction and degradation during porcine oocyte maturation. To investigate autophagic induction, we treated in vitro cultures with wortmannin. Wortmannin, which plays a role in blocking the induction of autophagosomes, has been used widely as an autophagy inhibitor based on its inhibitory effect on class III phosphatidylinositol 3-kinase (PI3K) activity (Blommaart et al., Reference Blommaart, Krause, Schellens, Vreeling-Sindelarova and Meijer1997; Wu et al., Reference Wu, Tan, Shui, Bauvy, Huang, Wenk, Ong, Codogno and Shen2010), which is known to be a positive regulator of autophagic induction (Backer, Reference Backer2008). We cultured porcine oocytes with wortmannin for 14 h after which LC3-II protein was evaluated to examine autophagic induction. We also treated oocytes with E64d and pepstatin A, which are inhibitors of lysosomal proteases. In the autophagic degradation process, autolysosomes are formed by the fusion of autophagosomes and lysosomes immediately after the completion of the autophagosome (Dunn, Reference Dunn1990). The autolysosome is degraded subsequently by lysosomal proteases. The lysosomal protease inhibitors E64d and pepstatin A hamper autophagic degradation by inhibiting lysosomal proteases. In autophagic degradation, The LC3-II protein is also degraded by lysosomal proteases during autophagic degradation (Tanida et al., Reference Tanida, Minematsu-Ikeguchi, Ueno and Kominami2005). To investigate autophagic degradation during in vitro culture of porcine oocytes, we cultured these cells with E64d and pepstatin A for 42 h after which we evaluated LC3-II protein levels.
Collectively, we provide evidence for autophagy during the in vitro maturation of porcine oocytes by documenting the presence, start and end of autophagosomes by using the autophagic marker LC3-II and autophagic inhibitors.
Materials and methods
In vitro maturation of oocytes
Porcine oocytes were collected from gilts at a local slaughterhouse and transported to the laboratory in a container within 2 h of extraction. The follicular fluid and porcine oocytes were aspirated from antral follicles (diameter: 3–6 mm) with a 10 ml syringe attached to an 18 gauge needle. Compact cumulus–oocyte complexes (COCs) with uniform ooplasm were selected in phosphate-buffered saline (PBS; Nissui Pharmaceutical, Ueno, Tokyo, Japan) supplemented with 0.1% polyvinyl alcohol (PVA; Sigma Chemical, St Louis, MO, USA). After washing three times in 0.1% PBS–PVA, the COCs were cultured in NCSU-23 medium (Petters & Wells, Reference Petters and Wells1993) supplemented with 50 μM β-mercaptoethanol (Sigma), 0.6 mM cysteine (Sigma), 0.5% insulin (Sigma), 10% (v/v) porcine follicular fluid, 10 IU pregnant mare serum gonadotropin (PMSG; Serotropin; Teikokuzouki, Tokyo, Japan), 10 IU human chorionic gonadotropin (hCG; Puberogen; Sankyo, Tokyo, Japan) and 1 mM dibutyryl cyclic AMP (Sigma) for the first 22 h of maturation at 38.5°C in 5% CO2 in air. The COCs were cultured for a further 20 h in the same medium without hormonal and dibutyryl cyclic AMP supplementation. After cell culture, expanded COC cumulus cells were removed by gentle vortexing in PB1 medium (Quinn et al., Reference Quinn, Barros and Whittingham1982) that contained 0.1% hyaluronidase (Sigma). Oocytes were subsequently processed according to protocols for western blotting and immunostaining.
Western blot analysis of LC3-II
Protein extraction from oocytes was performed at 0 h, 14 h, 28 h and 42 h. At each time point, 33 oocytes denuded by 0.1% hyaluronidase (Sigma) in PB1 medium were placed in 1× sodium dodecyl sulphate (SDS) sample buffer, 0.5 M Tris–HCl (pH 6.8), 10% 2-mercaptoethanol and 20% glycerol. Lysates were cryo-preserved at –80°C. The extraction was repeated three times, after which 99 oocyte lysates for electrophoresis were prepared by combining three samples of 33 oocytes. After heat denaturation, lysates were separated by 12% SDS-PAGE and transferred to Immobilon membranes (Millipore, Billerica, MA, USA). After transfer, the membranes were blocked with 5% skimmed milk for 1 h at room temperature and washed several times with Tris-buffered saline that contained 0.1% Tween 20. The membrane was incubated with rabbit anti-LC3 monoclonal antibody (dilution 1:1000; Cell Signaling, Danvers, MA, USA) overnight at 4°C and then incubated with horseradish peroxidase-labelled anti-rabbit IgG (dilution 1:10,000; Invitrogen, Carlsbad, CA, USA). After several washes with TBS-T, the peroxidase activity was visualized using the ECL Plus western blotting detection system (GE Healthcare, Piscataway, NJ, USA). Signals were detected with an Image Reader LAS-3000 (Fujifilm, Tokyo, Japan).
Immunocytochemistry of oocytes
Immunostaining in oocytes was performed as described previously with slight modifications (Hoshino et al., Reference Hoshino, Yokoo, Yoshida, Sasada, Matsumoto and Sato2004). COCs were denuded after 0 h, 14 h, 28 h and 42 h in culture. Denuded oocytes (DOs) were washed three times in PBS that contained 0.1% PVA (PBS–PVA), then fixed with 4% paraformaldehyde (Sigma) in Dulbecco's PBS(–) that contained 0.1% PVA at 4°C for 90 min. Next, DOs were placed in 0.5% Triton X-100 in PBS(–) that contained 3% BSA(Sigma) at room temperature for 20 min, washed three times in PBS–PVA for 15 min each and stored in PBS–PVA that contained 1% BSA (Sigma) (PBS–PVA–BSA) at 4°C overnight or longer. DOs were then blocked with 10% fetal bovine serum (FBS; Gemini Bio-products, Calabras, CA, USA) in PBS–PVA–BSA at room temperature for 45 min. Oocytes were incubated overnight at 4°C with rabbit anti-LC3 monoclonal antibody (Cell Signaling), the same antibody used in this study for western blotting, at a dilution of 1:200 in 10% FBS in PBS–PVA–BSA. In the control group, oocytes were incubated overnight at 4°C without antibodies. After three washes with PBS–PVA–BSA, oocytes were incubated with Alexa Fluor® 488-labelled goat anti-rabbit antibody (Molecular Probes, Eugene, OR, USA) at a dilution of 1:50 in PBS–PVA–BSA for 40 min at room temperature. After three washes with 0.1% Triton X-100 in PBS–PVA–BSA for 15 min each, the nuclei were labelled with 20 μg/ml propidium iodide (PI) (Sigma) for 60 min at room temperature. After washes with PBS–PVA–BSA, the oocytes were mounted on glass slides. Alexa Fluor® 488 and PI generate green and red fluorescence signals, respectively. The samples were viewed using a LSM700 confocal scanning laser microscope (Zeiss, Feldbach, Switzerland).
Inhibition of autophagosome induction
To inhibit autophagosome induction, wortmannin was added to the culture medium. A 10 mM stock solution of wortmannin was prepared in dimethyl sulphoxide (DMSO) and diluted in the culture medium to a final concentration of 50 μM. DMSO was added to the control culture and all examined culture droplets contained 0.5% DMSO. After 14 h in culture, 99 oocytes from each control and treatment group were lysed for western blotting.
Inhibition of lysosomal degradation
To inhibit autophagosome degradation with lysosomal enzymes, E64d and pepstatin A were added to the culture medium. A 5 mM E64d stock solution and a 2.6 mM pepstatin A stock solution were prepared in DMSO and in 10% (v/v) acetic acid in DMSO, respectively. Then, they were diluted in the culture medium to a final concentrations of 29.8 μM for E64d and 15.6 μM for pepstatin A. DMSO:9.1% (v/v) acetic acid was added to control cultures and all examined culture droplets contained 0.6% DMSO:9.1% (v/v) acetic acid. After 42 h in culture, 99 oocytes from either the control or treatment group were lysed for western blotting.
Results
LC3-II protein levels change over time in culture
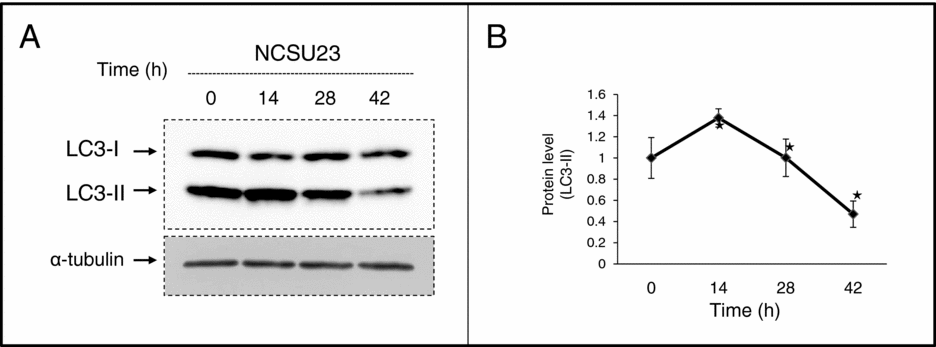
We examined LC3-II protein levels in porcine oocytes in a time course of 0 h, 14 h, 28 h and 42 h of culture in NCSU-23 medium. During the time course, LC3-II levels increased to maximum at 14 h and dropped to a minimum at 42 h (Fig. 1 A). Using the LAS Imaging System (Fujifilm), average band density from three bands per group was determined to be 25.98, 35.80, 26.02 or 12.21% at 0 h, 14 h, 28 h or 42 h, respectively. We calculated the relative band density based on the numerical value of the density at 0 h (Fig. 1 B). LC3-II densities were significantly different between 0 h and 14 h, 14 h and 28 h, and 28 h and 42 h (Fig. 1 B).
LC3-II levels change over time in culture. Cumulus–oocyte complexes (COCs) were cultured in NCSU23 medium for 0 h, 14 h, 28 h or 42 h. LC3-II levels were determined by western blotting (A). The protein density of LC3-II was calculated and the data were expressed based on the control (B). The lysates from each group of 33 oocytes was processed and cryo-preserved after 0 h, 14 h, 28 h or 42 h in culture; lysates from 99 oocytes were loaded in each lane. Data were the mean ± standard deviation (SD) values. *P < 0.05 as compared with the previous time point. n = 3.

LC3 is localized in porcine oocytes during in vitro maturation
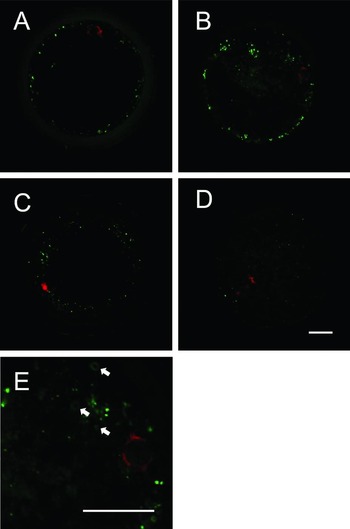
We determined the immunolocalization of LC3 in porcine oocytes after 0 h, 14 h, 28 h or 42 h in culture. The fluorescence signal immunoreactivated to LC3 protein was detected in every group although the 42 h group showed weak signaling intensity (Fig. 2 A–D). Moreover, the dot-shape and ring-shape signals were detected when the image was magnified (Fig. 2 E).
LC3 is localized in porcine oocytes during in vitro maturation. Immunostaining of LC3 was performed on oocytes cultured for 0 h (A), 14 h (B), 28 h (C) or 42 h (D). The photograph taken at 14 h was magnified. Arrows indicate the dot-shapes or ring-shapes of the LC3 immunoreactive signal (E). Oocytes with a nucleus on their equatorial planes and expressing a representative signaling intensity for each time point were selected. Green and red signals indicate LC3 and the nucleus, respectively. Scale bars = 20 μm.

Autophagic inhibitors affected LC3-II levels
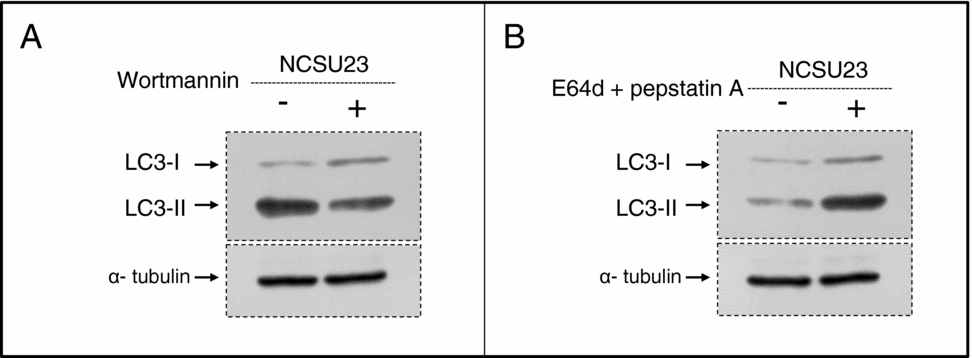
To verify the occurrence of autophagic induction during in vitro maturation of porcine oocytes, we examined the LC3-II levels in the oocytes by western blotting and after a 14 h treatment with wortmannin, a known inhibitor of autophagosome induction. We examined the differences in the LC3-II levels only at the 14 h time point because our previous time-course data from western blotting indicated that the sample at 14 h contained the highest levels of LC3-II, making it easier to distinguish differences between control and treatment groups. We found that compared with the control group, LC3-II levels in the treatment group were decreased by wortmannin treatment (Fig. 3 A).
Autophagic inhibitors affect on LC3-II levels. Cumulus–oocyte complexes (COCs) were cultured in NCSU23 medium. After a 14 h treatment with wortmannin, LC3-II levels were determined by western blotting (A). After 42 h treatment with E64d and pepstatin A, LC3-II levels were determined by western blotting (B). Lysates from 99 oocytes were loaded in each lane.

Using the same method as for wortmannin, we treated oocyte cultures for 42 h with lysosomal protease inhibitors E64d and pepstatin A to verify the occurrence of autophagic degradation during in vitro maturation of porcine oocytes. Compared with the LC3-II levels in the control group, the LC3-II levels in the treatment group were increased by E64d and pepstatin A treatment (Fig. 3 B).
Discussion
This study aimed to investigate if autophagy occurs during porcine oocyte maturation in vitro, with the ultimate goal of understanding the autophagic process so that it could be harnessed to improve in vitro resistance to stress factors. For this purpose, we used the autophagic marker LC3-II to identify the presence of autophagosomes and to demonstrate their induction and degradation in response to factor treatment.
We first used western blotting to establish the presence of LC3-II and its quantitative changes over time in culture. The fact that LC3-II in oocytes cultured for 14 h is higher than that in oocytes cultured for 0 h can be seen as evidence for newly generated autophagosomes. Likewise, lower levels of LC3-II after 42 h than after 0 h, 14 h or 28 h in culture implied that autophagosomal degradation was occurring. However, we cannot simply state that autophagic activity is highest after 14 h and lowest after 42 h of oocyte maturation in culture, because autophagy is such a dynamic process that it is difficult to evaluate autophagic activity by just measuring the autophagosome on the basis of LC3-II levels (Mizushima & Yoshimori, Reference Mizushima and Yoshimori2007). We also need to investigate lysosomal activity when studying autophagic activity further. Nevertheless, we are now certain that autophagosomes are present in porcine oocytes during in vitro maturation and that their presence changes over time in culture. This finding means that it is highly possible that autophagic activity changes over time in culture.
We next established the location of LC3 in porcine oocytes by immunolocalization. Although the LC3 antibody is immunoreactive to both LC3-I and LC3-II, we took the signal intensity of total LC to represent that of LC3-II. This assumption was because LC3-I levels showed very little variation by western blotting. Thus, immunostaining results also supported the presence of autophagosomes during in vitro maturation of porcine oocytes. Moreover, dot-shapes and ring-shapes of the LC3 signal seen in magnified images strongly supported the idea that the LC3 signal is associated with the autophagosome because these dot-shapes and ring-shapes are known to represent autophagosomes (Yano et al., Reference Yano, Mita, Ohmori, Oshima, Fujimoto, Ueda, Takada, Goldman, Fukase, Silverman, Yoshimori and Kurata2008).
Next, we investigated whether autophagic induction occurs during porcine oocyte in vitro culture by treating 14 h cultures with wortmannin, an inhibitor of autophagic induction, over the entire culture period. Wortmannin is widely used as an autophagic inhibitor based on its inhibitory effect on class III PI3K activity (Blommaart et al., Reference Blommaart, Krause, Schellens, Vreeling-Sindelarova and Meijer1997; Wu et al., Reference Wu, Tan, Shui, Bauvy, Huang, Wenk, Ong, Codogno and Shen2010) and is known to be a positive regulator of autophagic induction (Backer, Reference Backer2008). Our result showed that LC3-II levels were reduced by wortmannin treatment. This finding suggests that more newly generated autophagosomes were present in the control than in the treatment group. Even though we could infer that autophagosome were newly generated, by comparison of LC3-II levels at 0 h and 14 h by western blotting, this result provides direct evidence for autophagic induction in porcine oocytes cultured in vitro.
We also demonstrated the occurrence of autophagic degradation by treating 42 h cultures over the entire culture period with E64d and pepstatin A, inhibitors of lysosomal proteases. During autophagic degradation, autolysosomes are formed by the fusion of autophagosomes and lysosomes immediately after the completion of the autophagosome (Dunn, Reference Dunn1990). After this event, the autolysosome is degraded by lysosomal proteases E64d and pepstatin A, hinder autophagic degradation by inhibiting lysosomal proteases. The LC3-II protein is also degraded by lysosomal proteases during autophagic degradation (Tanida et al., Reference Tanida, Minematsu-Ikeguchi, Ueno and Kominami2005). Our observation that LC3-II levels were increased by E64d and pepstatin A treatment implies that more autophagosomes were present in the treatment group than in the control group. In other words, there was more autophagosome degradation by lysosomal protease in the control group than in the treatment group. Even though we could infer autophagic degradation by comparison of western blotting data from the 14 h and 42 h time points, this result provided direct evidence for autophagic degradation in porcine oocytes cultured in vitro.
In this study, we provide evidence for the autophagic process during porcine oocyte maturation in vitro by using the LC3-II marker to detect the presence of autophagosomes as well as their inception and termination. Moreover, our LC3-II western blotting data showed that autophagic activity probably changes over the culture period. Therefore, the role of autophagy may be related to in vitro cytoplasmic maturation of porcine oocytes.
In comparison with findings for mouse and rat, LC3 was not detected in unfertilized oocytes in vivo (Tsukamoto et al., Reference Tsukamoto, Kuma and Mizushima2008; Choi et al., Reference Choi, Jo, Lee, Yoon and Choi2010). Although direct comparison between rodents and porcine should to be treated with caution, the finding in rodents lead us to suspect that autophagy may be activated only during in vitro maturation. If this situation were the case, research on autophagy during in vitro maturation would have greater importance.
Generally, autophagy is known to have a role in both cell survival (Yorimitsu & Klionsky, Reference Yorimitsu and Klionsky2005) and cell death (Gozuacik & Kimchi, Reference Gozuacik and Kimchi2004; Eskelinen, Reference Eskelinen2005). Further investigation is required to determine whether the increase in autophagosomes after 14 h in porcine oocyte culture is related to the role of autophagy in cell survival or cell death. This investigation would clarify ways to control autophagy during porcine oocyte in vitro maturation. We hope that this study will contribute fundamental data for autophagy research into porcine oocyte in vitro maturation systems.
Acknowledgements
This work was supported by a grant from the Japan Society for the Promotion of Science to E. Sato (no. 21248032).