INTRODUCTION
Smallholder farming systems in Southern Africa are dominated by the staple crop maize (Zea mays L.) which is cropped on over 80% of smallholder land area in some areas (Giller et al., Reference Giller, Murwira, Dhliwayo, Mafongoya and Mpepereki2011). Soil organic matter (SOM) inputs produced on-farm are insufficient to maintain soil fertility and mineral fertilisers are expensive and often unavailable (Bloem et al., Reference Bloem, Trytsman and Smith2009). Legumes such as soybean (Glycine max (L.) Merr.) can contribute to improved soil fertility through biological nitrogen fixation when crop residues are incorporated into the soil (Giller, Reference Giller2001; Peoples et al., Reference Peoples, Brockwell, Herridge, Rochester, Alves, Urquiaga, Boddey, Dakora, Bhattarai, Maskey, Sampet, Rerkasem, Khan, Hauggaard-Nielsen and Jensen2009; Sanginga, Reference Sanginga2003; Sisworo et al., Reference Sisworo, Mitrosuhardjo, Rasjid and Myers1990). Incorporation of legumes into maize-based systems can help reduce biotic stresses in cereals such as Asiatic witch weed (Striga asiatica (L.) Kuntze) (Kabambe et al., Reference Kabambe, Katunga, Kapewa and Ngwira2008), improve household nutrition by adding essential amino acids to diets (Bezner-Kerr et al., Reference Bezner-Kerr, Snapp, Chirwa, Shumba and Msachi2007) and provide additional cash income if markets are available (Giller et al., Reference Giller, Murwira, Dhliwayo, Mafongoya and Mpepereki2011).
Between 2003 and 2014, soybean yields in Malawi averaged only 0.88 t ha−1 – substantially less than in Zimbabwe (1.47 t ha−1) or South Africa (1.67 t ha−1) during this period (FAO, 2016). An array of interacting constraints limit soybean yields. These include biophysical constraints such as rainfall distribution and poor soil phosphorus availability as well as socio-economic constraints such as limited market opportunities, labour constraints and limited availability of cash for seeds, fertiliser, inoculant and plant protection agents (Mhango et al., Reference Mhango, Snapp and Phiri2013; Snapp et al., Reference Snapp, Rohrbach, Simtowe and Freeman2002; Van den Brand, Reference Van den Brand2011). Local demand for soybeans has increased substantially over the past 20 years due to increasing demand for poultry feed and processing into infant and baby formula (Tinsley, Reference Tinsley2009). This provides opportunities for smallholder farmers to produce soybean as a cash crop. Yet to be profitable, soybean productivity needs to be enhanced.
Several technologies can contribute to closing the yield gap between actual and attainable yields. Inoculation with B. japonicum, fertiliser application and the use of compost manure can increase soybean yields (Hati et al., Reference Hati, Mandal, Misra, Ghosh and Bandyopadhyay2006; Ndakidemi et al., Reference Ndakidemi, Dakora, Nkonya, Ringo and Mansoor2006). Farmers need to select good quality seed of a genotype that matches the agro-ecological conditions in which the crop is grown. Without access to inoculant, farmers can benefit from growing promiscuous varieties with an improved ability to nodulate with Bradyrhizobium naturally present in the soil (Mpepereki et al., Reference Mpepereki, Javaheri, Davis and Giller2000). Timely planting allows the crop to make optimal use of the available growing season (Davis, Reference Davis1979; Parker et al., Reference Parker, Marchant and Mullinix1981; Summerfield et al., Reference Summerfield, Ellis and Craufurd1996). Matching soybean genotypes with their optimal row spacing and plant populations can result in larger yields if water and nutrients are in sufficient supply (Alessi and Power, Reference Alessi and Power1982; Taylor, Reference Taylor1980). Pests such as termites, caterpillars and pod suckers attack soybeans (Haile et al., Reference Haile, Higley and Specht1998) and their control can enhance production (Sastawa et al., Reference Sastawa, Lawan and Maina2004). The most destructive disease in soybeans in southern Africa is leaf rust (Phakopsora pachyrhizi), which can be controlled by fungicides (Levy, Reference Levy2005) or by growing rust-tolerant genotypes (Jarvie and Shanahan, Reference Jarvie and Shanahan2009). Finally, weed control is required to maximise soybean yields (Odeleye et al., Reference Odeleye, Odeleye and Dada2007).
Current crop management (CM) recommendations in Malawi are largely based on a set of on-station agronomic trials that were conducted without farmer participation (Davis, Reference Davis1979). Yields reported on research stations are often higher than on farm due to better soil fertility and CM (Mugwe et al., Reference Mugwe, Mugendi, Kungu and Muna2009). Therefore, yield response to treatments such as fertiliser, inoculant, manure and plant spacing will be different under on farm conditions. New threats such as leaf rust should also be included in agronomic research. A technology is unlikely to be adopted by farmers unless it fits their socio-ecological niche (Ojiem et al., Reference Ojiem, Ridder, Vanlauwe and Giller2006) and farmers’ preferences are at the forefront (Snapp and Silim, Reference Snapp and Silim2002). Therefore, technologies should be tested and evaluated together with smallholders on their farms (Chamango, Reference Chamango2002).
We report a set of on-farm experiments conducted in central Malawi to: (i) quantify the effects of inoculation, fertiliser, compost manure, improved variety, weed management, plant population and pest and disease control on soybean yields, (ii) assess the economic benefits of these technologies and (iii) understand farmers’ perceptions and rankings of these technologies.
MATERIALS AND METHODS
Study areas and farmer selection
Experiments were conducted in three contrasting agro-ecological zones in the central region of Malawi. In Mchinji district, the trials were established at an altitude of 1050–1150 m above sea level (masl) in a radius of 10 km around Kachamba village (13°44′S, 33°20′E), in Dowa district at an altitude of 1200–1400 masl in a radius of 15 km around Msakambewa trading centre (13°33′S, 33°54′E) and in Salima at an altitude of 550–650 masl in a radius of 5 km around Chitala research station (13°40′S, 34°15′E). Malawi has a unimodal rainfall distribution with rains starting early December and continuing for about 4 months. Average long-term precipitation across the three regions are in the range of 900–950 mm year−1 (Hijmans et al., Reference Hijmans, Cameron, Parra, Jones and Jarvis2005). The dominant soil types are Chromic luvisols in Mchinji and Dowa and Eutric cambisols in Salima.
Participatory agronomic soybean trials were conducted with 120 farmers in total. Farmers were selected in consultation with local field technicians, lead farmers and village chiefs, based on their experience with growing soybeans, motivation to participate, and diversity in gender, age and resource endowment. Structured household surveys were conducted with the participating farmers to gather information on available family labour in men equivalents (ME where an adult male >15 years counts 1, an adult female 0.8 and children between 5 and 15 years are 0.5 ME), arable land area (ha), total value of assets and quality of housing score based on material used for walls, floor and roof.
On-farm experimental design
Two sets of trials were established in the 2009/10 and 2010/11 growing seasons (hereafter referred to as the 2010 and 2011 seasons, respectively) on a total of 144 farmers’ fields on plots cultivated with maize in the previous season. In each region and year, one nutrient management (NM) trial and one crop management (CM) trial were established. The trial design was a random controlled block design (RCBD) with 12 farmers per season per region hosting a single replicate block with five treatments. Trials were researcher-designed and implemented by farmers with assistance of a field technician responsible for monitoring, data collection and the weeding and spraying treatments during the growing season. Some farmers participated in both seasons using a different plot in the second season.
Each NM block consisted of five plots of 10 by 10 m each that were all planted with soybean variety Nasoko, a common specifically nodulating grain type variety widely available in Malawi. Treatments represented a stepwise increase in intensity, namely (T1) farmers practice, (T2) inoculation, (T3) inoculation plus fertiliser rate 1, (T4) inoculation plus fertiliser rate 2, (T5) inoculation plus fertiliser rate 1 plus compost manure. This design was chosen to enable farmers to evaluate various NM options in one block. The inoculant containing B. japonicum strain MAR 1491 was sourced from Zimbabwe and did not contain additional nutrients. Compound fertiliser super-D was applied 2 weeks after planting (WAP) at a rate of 100 kg ha−1 (10 kg N ha−1, 8 kg P ha−1 and 20 kg K ha−1) for rate 1 (T3 and T5) and 300 kg ha−1 (30 kg N ha−1, 24 kg P ha−1 and 60 kg K ha−1) for rate 2 (T4). Compost (T5) was sourced locally and was made mainly from maize and legume crop residues. In 2010, three sub-samples of compost were collected from each region and chemical analysis showed an average pH of 7.5, 4.2 % OC, 0.013 % P, 0.21 % N and an ash content of 10.0 %. The manure was incorporated at a rate of 6 t ha−1 in the surface 20 cm of soil two weeks before planting. Farmers were free to follow their own practices regarding row spacing, sowing rate, planting date, weeding date and frequency and pest and disease control as long as these practices were constant across all plots.
Each CM block also consisted of five plots of 10 by 10 m reflecting a stepwise increase in management intensity with treatments (T1) local variety, (T2) improved variety, (T3) as T2 but with improved weed management, (T4) as T3 with increased plant population, (T5) as T4 with pest and disease control. This design was chosen to demonstrate options to enhance soybean yields without application of fertiliser or manure. T1 was planted with unsorted soybean grains of unknown variety locally procured from traders or farmers in each region and T2–T5 were planted with variety Nasoko. The field technician weeded T3–T5 manually at 2 and 6 WAP. Farmers followed their own weeding regime in T1 and T2. In T1–T3 farmers were free to decide on their preferred ridge spacing, plant population and planting methods. In T4 and T5, soybean was planted in two lines (20 cm between lines; 5 cm between seeds) on ridges spaced 75 cm apart. This resulted in a seeding rate of about 533 000 seeds ha−1 aiming for approximately 400 000 plants ha−1 at 75–80% germination. In T5, caterpillars (loopers) were controlled by spraying 300 ml ha−1 Cypermethrin at 3, 7 and 11 WAP and leaf rust was prevented by spraying 500 ml ha−1 Folicur (tebuconazole 250 g l−1) at 7 and 11 WAP. Seeds in all treatments were inoculated at planting.
Soil sampling and data collection
Five topsoil samples (0–20 cm) were collected from each block and combined in a composite sample, which was mixed, air-dried, crushed and passed through a 2-mm sieve. Samples were analysed at IITA-Malawi and Chitedze Research Station for SOC% (Walkley–Black), total N% (micro-Kjeldahl), available P (Bray-1), K (Mehlich-3 method), soil pH (CaCl2) and texture. In each region, the field technician collected rainfall data using a rain gauge and three farmers using a calibrated water bottle and a ruler. The date of effective planting rains, defined as the date at which at least 25 mm of accumulated rainfall was received within 10 days, not followed by a period of 10 consecutive days with an accumulated rainfall less than 2 mm (Tadross et al., Reference Tadross, Suarez, Lotsch, Hachigonta, Mdoka, Unganai, Lucia, Kamdonyo and Mchinda2007), was recorded. Farmers’ practices recorded by the field technicians included actual planting and weeding dates, the number of ridges and their spacing, the number of rows sown per ridge and the number of plants counted on two selected ridges in each plot at 3 WAP. Weed pressure was scored visually from 1 (<10% of the plot surface covered with weeds) to 5 (>90% of the plot surface covered with weeds) at 5, 8 and 11 WAP. Pest and disease incidence was scored visually on leaves at half the plant height at 3, 7 and 11 WAP before spraying. Leaf damage was scored as the average percentage of leaf area defoliated and leaf rust incidence as the percentage of leaf area covered by rust lesions.
At mid pod-filling stage (R5.5), three sub-samples of biomass were taken in each plot by harvesting 0.5 m of a ridge at a randomly selected spot. Sub-samples were combined and fresh weight was determined in the field. Samples were oven-dried at 70 °C until constant weight to determine dry matter concentration. Nodulation was assessed by uprooting six sampled plants and scoring on a scale of 1–5 with 1 being no nodulation and 5 abundant nodules observed.
At crop maturity, plots were harvested excluding the outer ridges and the 1.5 m ridge-length from which the biomass sub-samples were collected. Harvested plants were threshed and weighed, and a sub-sample of the grain was taken from each plot to assess moisture concentration and 100 seed weight. Yields were adjusted to 13% grain moisture concentration.
Partial gross margin analysis
Partial gross margins in the NM trials were calculated for the various input combinations in T2–T5 relative to the farmers practice (T1). In the CM trials, the margins were calculated for increased plant population (T4) and spraying (T5). Variety Nasoko (T2) and weed management (T3) were excluded since these treatments did not enhance yields relative to T1. Therefore, T3 was considered as a base case in the analysis.
Marginal revenues were calculated by multiplying the marginal grain yields with the average farm-gate price farmers received from vendors in the months May to July following harvest (US$0.67 kg−1). The marginal costs include variable and fixed marginal costs (Table S1 in Supplementary Material) where the variable costs represent the (post-) harvest costs that result from increased yields and the fixed costs represent the procurement and transport costs of the inputs. Labour costs are those of hired labour commonly used in the study areas based on information from local informants. Costs and benefits were calculated in US$ at the official exchange rate of 150 MWK per US$ at the time the field work was conducted. The incremental value to cost ratio (VCR) was calculated for each technology by dividing the marginal revenue by the marginal production costs. We calculated the percentage of farms with a VCR > 2 for each technology since this is often considered to be a sufficient economic incentive for adoption by smallholder farmers (Kelly, Reference Kelly2006).
Technology evaluations and ranking
In each region, field days were organised each season when the crop was around the mid-pod filling stage. After a visit to a block of the NM and the CM trial, group discussions were held. Early planting was not a treatment in the trials but was included in the evaluations because farmers considered it to be an important factor determining yield. Each farmer evaluated the technologies early planting, optimal weed management, spraying against pests and diseases, planting two lines per ridge, variety choice, inoculation, fertiliser application and compost manure by noting their advantages and disadvantages. This was followed by a pair wise technology ranking exercise where each farmer selected the preferred technology out of a set of two technologies until all eight technologies were compared with each other. Grain yields and their implications for technology adoption were discussed in meetings with participating farmers after each growing season.
Data analysis
Statistical analyses were conducted in Genstat 12.2 VSN International Ltd. Average yields of blocks (average of T1–T5), wealth indicators and soil characteristics were subjected to general analysis of variance (ANOVA) to identify differences between regions and to test for region × year interactions. The treatment effects on yield, crop components, pest and disease incidence and first weeding date were tested in both trials for the whole data set (there was no blocking effect of region or season). We also evaluated whether the treatment responses were different for the regions or years by testing for interactions. Pair wise ranking data were analysed by adding a score of 1–7 to each technology for each farmer based on the number of times the technology was preferred over other technologies. General ANOVA was used to identify differences in scores for technologies across regions and years. The advantages and disadvantages of technologies were analysed using frequencies.
RESULTS
Households, soils and rainfall in the study regions
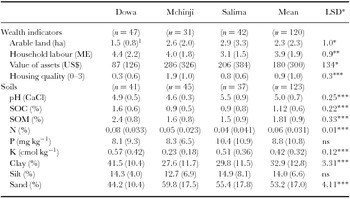
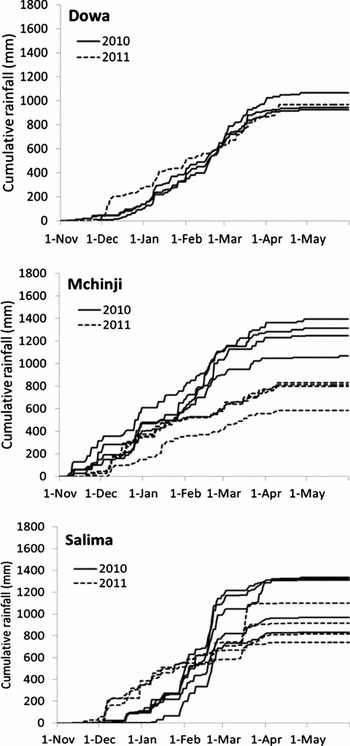
The three regions varied in wealth, soil characteristics and rainfall distribution (Table 1 and Figure 1). In Mchinji, the planting rains started about a month earlier than in the other regions. Total rainfall was sufficient for soybean production, but the distribution was uneven in Salima in 2010 (Figure 1). Farmers in Mchinji owned more assets such as a house with an iron sheet roof, a television, radio, phone, irrigation pump or bicycle. In Dowa, most houses were constructed of mud with a grass roof and farmers owned only few assets. On the other hand, soils in Dowa contained more SOC, N and clay than the other regions (Table 1). Soil available P and exchangeable K were expected to be limiting (P < 10 mg kg−1 and K < 0.02 cmol kg−1) in 76 and 16% of the fields in Dowa, 71 and 47% in Mchinji and 77 and 0% in Salima, respectively. Soil pH was generally not limiting because 96% of the fields fell within the range (4.2–7.5 (CaCl2)) considered suitable for soybean production.
Wealth indicators and soil characteristics in three districts in central Malawi.

*LSD = Least significant difference between means, significant at *p < 0.05, **p < 0.01, ***p < 0.001, ns = not significant. Values in brackets represent the standard deviation from the mean.
Cumulative rainfall data collected by four farmers in each region in 2010 and 2011. Each line represents the data from a single farmer.

Trial performance and yields
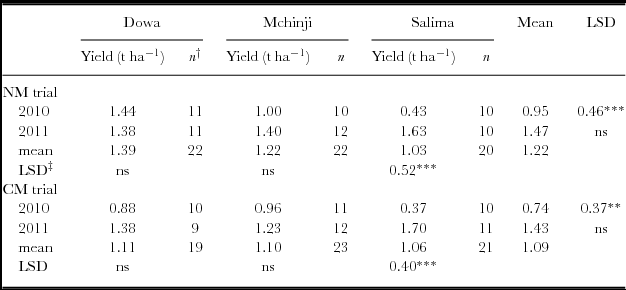
Yields averaged 1.22 t ha−1 in the NM trials and 1.09 t ha−1 in the CM trials (Table 2). Yields in Salima in 2010 were significantly less than in Mchinji and Dowa, and also less than in Salima in 2011. Poor yields in Salima in 2010 can be explained by drought stress after planting and water logging in the middle of the growing season (Figure 1), grasshoppers attacking emerging plants and a small number of weeding operations per block. No other significant differences in yield performance between regions or years were observed. The trials were planted on average 21 (3–44) days after the first planting rains, on ridges spaced 77 (59–100) cm apart.
Mean soybean yields observed in each region and year.

† n = number of replicate blocks, ‡LSD = Least significant difference between means, significant at *p < 0.05, **p < 0.01, ***p < 0.001, ns = not significant.
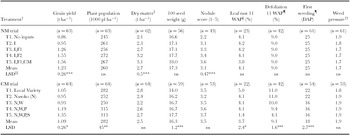
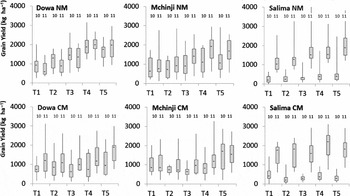
The yield responses to treatments (Table 3) were consistent across regions and years. However, the boxplots in Figure 2 show wide variation in yields achieved across the replicate blocks within each region and year in both trials.
Yields, crop growth characteristics, pest and disease incidences and timing of first weeding in the different treatments of the NM and CM trial (averaged over seasons and study areas).

†W=Weeding at 2 and 6 WAP, P = Increased plant population, S = Spraying, I = Inoculant, F1 = Fertiliser rate 1, F2 = Fertiliser rate 2, CM = Compost Manure. ‡Oven-dried above-ground biomass at mid pod-filling stage (R5.5). §Leaf rust at 11 WAP in Mchinji. No leaf rust was found in Salima, no data from Dowa. ¶No data for Dowa. ††Average weed pressure score of up to three measurements per field with 1 = no weed cover and 5 = full weed cover. ‡‡LSD = Least significant difference between means, significant at *p < 0.05, **p < 0.01, ***p < 0.001, ns = not significant.
Yield variability in the NM trials with T1; no inputs, T2; inoculation (I), T3; I + fertiliser rate 1 (F1), T4; I + fertiliser rate 2 and T5; I + F1 + compost manure, and in the CM trials with: T1; local variety, T2; Nasoko, T3; improved weeding regime, T4; increased plant population and T5; spraying, for the 2010 (10) and 2011 (11) growing seasons.

The NM trial yields ranged from 0.43 t ha−1 in Salima 2010 to 1.63 t ha−1 in Salima 2011 (Table 2). Yields increased from 0.86 t ha−1 in the control to 1.56 t ha−1 with a combination of inoculation, 100 kg ha−1 fertiliser and 6 t ha−1 compost manure (Table 3). Of this yield increase of 0.70 t ha−1, 0.09 t ha−1 could be attributed to inoculation (T2–T1), 0.31 t ha−1 to fertiliser application (T3–T2) and 0.30 t ha−1 to compost manure application (T5–T3). Increasing the fertiliser rate from 100 (T3) to 300 kg ha−1 (T4) enhanced yields by 0.29 t ha−1. Compost manure (average 252 kg ha−1 OC, 12.6 kg ha−1 N, 0.8 kg ha−1 P) had roughly the same effect on the yield as the additional 200 kg ha−1 inorganic fertiliser (20 kg ha−1 N, 16 kg ha−1 P, 40 kg ha−1 K). Inoculation resulted in better nodulation scores. Increased nutrient inputs resulted in more dry matter accumulation at R5.5 (Table 3). The yields for the various NM treatments varied considerably across replicate blocks (Figure 2), but differences between treatments were significant in each region and year except in Salima in 2010.
Soybean yields in the CM trial ranged from 0.37 t ha−1 in Salima in 2010 to 1.70 t ha−1 in Salima in 2011 (Table 2). The variety Nasoko (T2) did not give better yields than the local varieties (T1) but Nasoko had a larger grain size (Table 3). The ‘improved’ weeding treatment (T3) did not result in better yields than the farmers’ weeding practice (T2) since the average weed pressure scores and the number of weedings recorded in T3 were similar to the farmers’ practice. Farmers’ first weeding in T1 and T2 was done on average 6 days later, though still 3 days earlier than farmers’ practice in the NM trials (Table 3). It was observed that 40% of the farmers followed exactly the first weeding date of the field technicians. The increased plant population treatment (T4) resulted in an average yield increase of 0.25 t ha−1. However, an increased plant stand was observed in only 74% of the sites. In 32% of the sites, farmers planted two lines per ridge in both T3 and T4. Despite this, a yield increase was observed in 82% of the replicate blocks, while the average plant population increased from 250 000 to 315 000 plants ha−1 (Table 3). This was less than the intended 400 000 plants per ha−1 due to poor germination, grasshopper damage to emerging plants in Salima, termite damage and birds removing seeds after planting. Application of Folicure and Cypermethrin (T5) increased yields on average by 0.16 t ha−1. In Salima, leaf rust was not observed and spraying was not effective (Figure 2). In Mchinji, leaf rust scores were significantly reduced by spraying (Table 3). The highest leaf rust incidence was observed in Mchinji in 2010 with an average incidence of 8.0% at 11 WAP (n = 11) and spraying increased yields from 0.86 to 1.47 t ha−1. Though there was some caterpillar damage in all sites and seasons, the percentage of defoliation was unlikely to result in economic loss.
Partial gross margin analysis
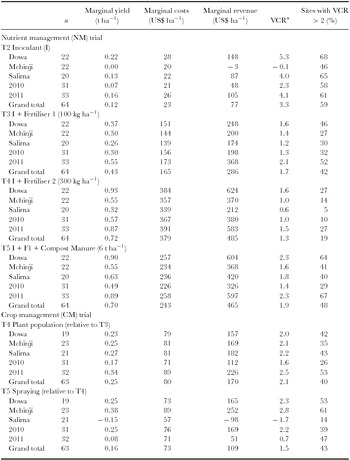
The investment costs and economic benefits of the technologies tested in the trials varied considerably (Table 4). Inoculation was the cheapest technology requiring an investment of only US$23 ha−1 including transport to the nearest city for procurement. It was profitable with an average VCR > 2 in both years, though the marginal yields were low resulting in relatively low absolute profits. Fertiliser application was the most expensive technology but resulted in relatively high marginal revenues (Table 4). The low VCR for the high fertiliser dose shows that large fertiliser applications are unlikely to be attractive to farmers. The low fertiliser rate (100 kg ha−1) combined with inoculation was attractive in 2011 (VCR 2.1) but less so in 2010 (VCR 1.3). Yields in 2010 were smaller than in 2011 which also affected the marginal yields and revenues resulting from fertiliser application. The most profitable package in the NM trial was the combination of inoculation, fertiliser rate 1 and compost manure (T5) with a profit of US$100 ha−1 in 2010 and US$339 ha−1 in 2011 and a mean VCR > 2 in 2011. The marginal costs of compost manure in T5 was US$98 ha−1, considerably less than the full fertiliser application rate in T4.
Partial gross margin analysis for the input treatments in the NM trial and increased plant population and spraying in the CM trial by location and year.

*Value Cost Ratio.
Increasing the plant population resulted in an average VCR > 2 in all regions and on 40% of the farmers’ fields. The economic benefit was stronger in 2011 (VCR 2.5) than in 2010 (VCR 1.6). Spraying resulted in average VCR > 2 in Dowa and Mchinji but resulted in economic loss in Salima due to the absence of leaf rust. The largest revenue in the CM trial was obtained in Mchinji in 2010 by spraying with a VCR > 2 on 73% of the fields and a marginal revenue of US$410 ha−1 (data not shown).
Farmers’ perceptions
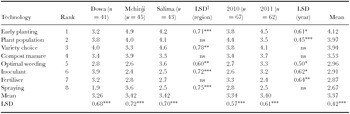
The farmers ranked early planting as the most preferred technology (Table 5), even though it was not a treatment in the trials. However, they also recognised that planting too early increases risks of dry spells at the start of the season and fungal infections of the crop at the end of the season when rains continue (Table 6).
Pairwise ranking of technologies by farmers. Scores are the average number of times the farmers preferred the technology over other technologies.

†LSD = Least significant difference between means, significant at *p < 0.05, **p < 0.01, ***p < 0.001, ns = not significant.
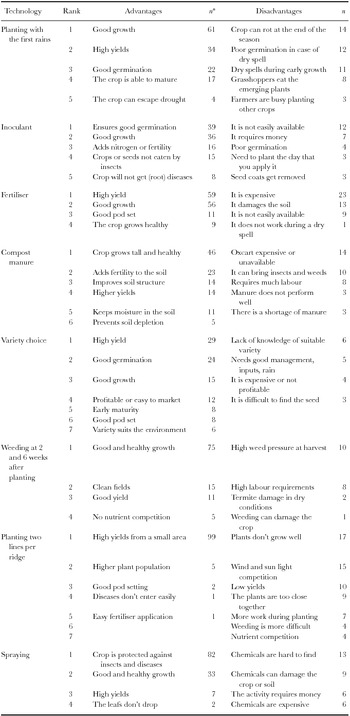
Advantages and disadvantages of technologies identified by farmers.

*n = the number of times the advantage or disadvantage is mentioned.
Technologies tested in the NM trials were ranked relatively low (Table 5). Inoculant is not easily available to the farmers, inorganic fertiliser is considered very expensive, and applying compost manure involves high investments in labour and transport in an oxcart (Table 6). In Dowa, inoculation was ranked higher than in Mchinji and Salima and even higher than early planting. This may be related to the higher marginal yields and VCR for inoculant compared to the other regions (Table 4). Farmers in Mchinji preferred compost manure over inoculant and inorganic fertiliser (Table 5).
Increasing the plant population received the highest ranking after early planting (Table 5), though farmers mentioned higher labour requirements and competition for water and nutrients as constraints (Table 6). Variety choice in general was ranked highly, though not specifically in favour of the variety Nasoko. Disadvantages are the high costs, limited access to certified seeds and limited knowledge of suitable varieties (Table 6). Optimal weed management was considered significantly more important in Salima than in the other regions. This agreed with our observed high frequency of weeding in Salima in 2011. Spraying was the least favoured technology due to difficult access to chemicals and high costs (Table 6). Only in Mchinji, where leaf rust incidence was high, farmers considered spraying as an important option (Table 5).
DISCUSSION
Trial design and implementation
The treatments were chosen to increase management or input intensity in a stepwise fashion, and this proved to be a suitable method to test and evaluate a set of technologies in a limited number of treatments together with farmers. The small number of treatments allowed a large number of farmer replications, which was needed to capture a representative sample of the highly variable conditions in farmers’ fields. A limitation of this trial design, however, is that some of the technologies are only tested in combination with others, and not as stand-alone treatments that can be compared directly with farmers practice. For example, in T3 in the NM trial, the combined inoculum and fertiliser application may have given synergistic effects, as increased availability of P can stimulate nitrogen fixation and the response to inoculation. The yield response to fertiliser without inoculants may be weaker. Similarly, the impact of fungicide spraying (T5) in the CM trial may be weaker with lower plant populations. Further, interactions between CM and NM treatments in the two trials could not be assessed with the current design.
Soybean performance across regions and years
The average farmers’ practice yield for variety Nasoko was 0.86 t ha−1 (Table 3) which is comparable to the national average of 0.88 t ha−1 in 2003–2014 (FAO, 2016). Current global soybean yields are about 2.5 t ha−1 (Ray et al., Reference Ray, Mueller, West and Foley2013) and are predicted to increase to about 3.0 t ha−1. Observed average yields in the most intense treatment of the NM trial (T5: inoculant, fertiliser and compost manure) and the CM trial (increased plant population and spraying treatment) equalled 1.6 and 1.4 t ha−1, far less than the global averages. Combining the treatments from the NM and CM trials may have resulted in higher yields. Moreover, multiple production constraints likely interact to determine yields on smallholder farmers’ fields (Fermont et al., Reference Fermont, van Asten, Tittonell, Van Wijk and Giller2009). This is evident from the large variability in yield amongst farmers’ replicate blocks (Figure 2). Some blocks achieved yields of over 3 t ha−1 demonstrating the potential for smallholders to achieve high yields when constraints are addressed simultaneously.
Soybean productivity was influenced by factors that varied amongst regions and years. Better soil fertility perhaps gave farmers in Dowa an advantage over the other regions (Table 1), but delays in planting probably caused yield reductions. In Salima, erratic rainfall distribution, grasshopper attacks and fast growth of weeds suppressed yields in the first season. Because of these unfavorable growing conditions, none of the technologies were economically interesting in Salima in 2010. In the second season, more motivated farmers, better weed control and equal rainfall distribution resulted in relatively large yields (Table 2), despite the poorer soil fertility in Salima compared with Dowa. Mchinji experienced better rainfall in the first season (Figure 1) but yields were suppressed by leaf rust. In the second season, leaf rust pressure was less, resulting in better yields despite the lower rainfall. In short, a combination of soil characteristics, rainfall distribution, time of planting, time and frequency of weeding, leaf rust incidence, grasshopper damage and the experience and motivation of farmers and technicians all influenced soybean productivity, though the exact contributions of each of these factors cannot be quantified.
Evaluation of technologies
A combination of inoculation, inorganic fertiliser application and compost manure resulted in significant yield increases (Table 3) and was profitable (Table 4). The yield responses to these inputs would most likely be even higher if the choice of weed management, seed rate, planting date and pest and disease control were not left to farmers’ preferences. Inoculation is a cheap and generally profitable technology (Table 4), yet farmers do not know where it can be procured and they struggle to grasp the concept of biological nitrogen fixation. These may be reasons for the low ranking of inoculant by farmers (Table 5). Private sector involvement in the development, registration and marketing of high quality inoculants may improve opportunities for uptake of this technology in the future. An alternative approach to ensure effective N2-fixation is to grow promiscuous soybean genotypes that nodulate with indigenous bacteria in the soil (Mpepereki et al., Reference Mpepereki, Javaheri, Davis and Giller2000), though also these genotypes may still benefit from inoculation (Pule-Meulenberg et al., Reference Pule-Meulenberg, Gyogluu, Naab and Dakora2011).
Farmers prefer not to apply fertiliser to soybean, despite the observed yield response. This seems justified given the high investment costs, low VCR (Table 4), and preference of farmers to allocate resources to maize and cash crops such as cotton and tobacco. A study in Kasungu District (Kamanga et al., Reference Kamanga, Whitbread, Wall, Waddington, Almekinders and Giller2010) showed a soybean yield response of 0.5 t ha−1 as a result of 20 kg P ha−1 applied as triple super phosphate (TSP), indicating that P-based fertiliser applications in soybean can be profitable. Research in north east Zimbabwe showed that on more fertile soils the economic potential of targeting manure and P fertiliser to soybean is larger than targeting it to maize in the rotation (Zingore et al., Reference Zingore, Murwira, Delve and Giller2008). An alternative strategy to improve soil P status could include the use of local rock phosphate (Wendt and Jones, Reference Wendt and Jones1997). In the past, uptake of technologies such as fertiliser and hybrid maize seeds in Malawi depended strongly on subsidies, since these inputs are otherwise not affordable to most rural households (Carr, Reference Carr1997; Chirwa, Reference Chirwa2005).
Compost manure was preferred over inorganic fertiliser by farmers (Table 5) since it can be made on-farm with main costs being household labour and transport of manure to the field. However, the quantity of manure that can be produced in-situ is limited and there are often alternative, competing uses of crop residues, e.g. for animal feed or mulching (Giller et al., Reference Giller, Witter, Corbeels and Tittonell2009). Soybean residues are more likely to be used for compost since soybean is threshed at the household, whereas maize residues usually remain in the field. The nutrient concentrations in the compost used in this study (4.2% C, 0.21% N and 0.013% P) were low though typical of the farmers’ situation. Despite the fact that the additional 200 kg ha−1 mineral fertiliser (NM-T4) contained more NPK than the 6 t ha−1 compost manure (NM-T5), the yield response was comparable. Compost manure probably gave additional benefits such as impacts on the crop water balance or nutrients other than NPK (Steiner et al., Reference Steiner, Teixeira, Lehmann, Nehls, de Macêdo, Blum and Zech2007). Breeding efforts have significantly increased soybean yield potential over the last decades in sub-Saharan Africa (Tefera et al., Reference Tefera, Kamara, Asafo-Adjei and Dashiell2009). Farmers perceived variety choice as an important production factor, despite the fact that Nasoko did not outperform the local varieties (Tables 3 and 5). Farmers evaluating the CM trial were aware of the importance of weeding (Tables 5 and 6) and their weed management practices were quite similar to the proposed improved weeding regime. Precise recommendations on weeding dates and frequencies may not be suitable since the optimum timing of weeding is determined by various factors such as weed pressure, rainfall, termites, fertiliser use and labour supply (Dimes et al., Reference Dimes, Muza, Malunga and Snapp2002; Kamanga et al., Reference Kamanga, Waddington, Whitbread, Almekinders and Giller2013; Orr et al., Reference Orr, Mwale and Saiti2002). Research in western Kenya showed that one instead of two weeding operations reduced soybean yields with 5%, while reducing total labour costs for production by 36% (Vandeplas et al., Reference Vandeplas, Vanlauwe, Driessens, Merckx and Deckers2010) indicating there is more to consider than yields only. Increasing the plant population improved yields and resulted in economic benefits (Tables 3 and 4), while the additional costs were small (Table S1 in Supplementary Material). Since farmers prefer to maintain the 90-cm ridge spacing used in maize in the rotation, sowing two lines on each ridge is a better approach to increase plant population than reducing ridge spacing. Soybean leaf rust is a serious threat to the future of soybean farming in sub-Saharan Africa (Kawuki et al., Reference Kawuki, Adipala, Lamo and Tukamuhabwa2003). The yield response to spraying Folicur (tebuconazole) at 7 and 11 WAP in Mchinji and Dowa where leaf rust was present is a significant finding, especially in case the leaf rust epidemic will spread further. In this study, leaf defoliation by insects was low, and we can assume the yield response to spraying was mainly due to leaf rust control.
Early planting, despite not being a treatment in the trials, was ranked by farmers as the most important practice to ensure good yields (Table 5) by reducing the risk of drought stress at flowering and pod filling (Dogan et al., Reference Dogan, Kirnak and Copur2007; Doss et al., Reference Doss, Pearson and Rogers1974). However, farmers usually plant crops such as maize, tobacco and cotton first, resulting in delayed planting of soybean.
CONCLUSIONS
Through farmer participatory research, we could identify economically viable and farmer acceptable methods to increase soybean productivity. While variability in yield within treatments amongst farmers was high, some plots gave yields of more than 3 t ha−1. This confirms that a wide gap exists between farmers’ current yields in Malawi (0.88 t ha−1) and what is attainable if limiting constraints are addressed. While the application of mineral fertiliser helped to increase yield, farmers preferred to apply compost manure, due to the high investment costs and low VCR of mineral fertiliser, and farmers’ preference to allocate resources to maize and cash crops. Inoculation of soybean seeds led to modest yield increases, but was the cheapest and most cost-effective technology with a VCR > 2 on 59% of the farms. Its adoption is limited by the poor availability of quality inoculants. Increasing plant population was a relatively cheap and effective way to increase yields, without the use of fertiliser inputs, and was highly ranked by farmers. Fungicide spraying was found to be a cost effective technology to increase yield under smallholders’ conditions when leaf rust was present. Limited purchasing power, awareness of farmers, access to inputs, the role of soybean in the cropping system, labour availability and risks associated with variability in yield responses to technology are important factors emerging from the participatory research approach that should be considered in the development of CM recommendations.
Acknowledgements
The lead author thanks the Dutch Ministry of Foreign Affairs for funding his position at the International Institute of Tropical Agriculture (IITA) during which the research was conducted. Thanks to IITA for operational funds and to HAS University of Applied Sciences for providing time to write up this paper. This research would not be possible without all the feedback from the participating farmers in Dowa, Mchinji and Salima and the assistance of the field technicians.
SUPPLEMENTARY MATERIALS
For supplementary material for this article, please visit http://dx.doi.org/10.1017/S0014479716000430.