Employment and wages for unskilled workers in China experienced two distinct phases between the late 1970s and the early 2010s. The labour market in China from the late 1970s and into the 1990s was characterized by its steadily growing employment and low, fairly stable wages.Footnote 1 From the late 1990s until the early 2010s, however, two new trends emerged: a further acceleration of employment of rural low-skilled labour and rising wages in all unskilled sectors. This was shown clearly by Alan de Brauw and colleagues who found that an increasing number of young rural workers were transitioning from agriculture to industry work.Footnote 2 By the early 2000s, virtually all young rural citizens were employed off-farm.Footnote 3 During this period, not only was employment rising but so were wages. During the early 2000s, the annual real wage grew at an average of 13.8 per cent.Footnote 4 Similar changes in wages and employment occurred for workers at every level of skill and education during this time.Footnote 5
Although limited research has been conducted on employment and wages since the early 2010s, certain changes in the nature of economic activities suggest that there may be new patterns of growth that are and will be emerging in China's economy. In manufacturing, for example, China's increased wages during the previous decade influenced international firms such as Samsung and Adidas to offshore some of their manufacturing from China and to begin to produce more manufactured goods in Vietnam and Ethiopia.Footnote 6 In certain manufacturing industries, firms inside China also began to move towards investing in large-scale automation.Footnote 7 Finally, in the construction sector, housing markets in many cities have started to become oversaturated in recent years,Footnote 8 and in the case of a number of the nation's infrastructure projects, such as China's expressway system and its high-speed rail network, the programmes have largely been completed.Footnote 9 Such economic forces (for example, globalization, automation) mean that the economy could possibly begin to experience shifts in the nature of employment for certain portions of the labour force. When such shifts have occurred in other countries, the resulting displacement of workers ultimately led to radically realigned employment patterns.Footnote 10 Unfortunately, in the case of China, few studies have examined recent employment trends, especially those of lower-skilled workers who may be the ones most affected by layoffs in the manufacturing and construction industries.
If, in fact, employment patterns have been changing, then there is an outstanding question as to the wage trends of low-skilled workers in those sectors (for example, the service sector), as many factors in China's economy in the 2010s may influence wages, both positively and negatively. Turning to international examples, as nations have pushed into the upper to middle-income phases of economic growth, there is often an expansion of the middle class, which creates a rising demand for services.Footnote 11 Indeed, China's middle class has not only emerged but also steadily grown in recent years,Footnote 12 in no small part owing to the rapid growth of highly educated, high-skilled workers employed in high-tech, finance, healthcare, education and related industries.Footnote 13 The rise of a large middle class would, at least by itself, forecast growth in China's own low-skilled service industries, which, if strong enough, might mean low-skilled wages should stay high or even continue to rise. Such trends are predicted by Albert Park and Fang Cai, who, in the early 2010s, noted that the increasing scarcity of labour (in China's growing economy) should result in increased benefits and security for low-skilled workers.Footnote 14
There also are a number of factors, however, that forecast a less rapid rise in the demand for services (when compared to growing upper to middle-income economies), which, in the face of a rapidly growing supply of labour in the service sector, could limit wage growth or even cause wages to fall. The first of these factors is the low share of GDP in China that is allocated to consumption. Despite the commitment of China's government to move from investment- to consumption-based growth, economic growth as recently as 2015 and 2016 relied in large part on considerable government investment, which effectively means China's government is not following through on its commitment.Footnote 15 In addition, when income does end up in the hands of consumers, owing to the high levels of risk they face in the absence of a deep/wide social safety net (for instance, unemployment, retirement, catastrophic healthcare costs, high housing prices),Footnote 16 savings rates are high among the middle class.Footnote 17 All of these factors may lead to less consumption by the middle class and thus lower demand for services, which will exert a downward pressure on wages in the low-skilled service industry. These two sets of trends (one that will increase and one that will reduce demand) combined have produced a situation in which there is relatively large uncertainty in terms of the future of wage growth in certain key sectors of China's economy after the mid-2010s.
The goal of this paper is to overcome a gap in the literature to describe the trends of employment and wages in the Chinese economy after the early 2010s, with a focus on the low-skilled sector. First, we examine government-published employer data, establishing trends both generally and within specific industries and subeconomies. Second, we identify trends in wage data, again both generally and at the subeconomy level. Finally, we attempt to explain how wage polarization has affected China's economy in the past and how it may continue to shape key sectors of the economy in the future.
Data
The data utilized in this paper are official, national-level statistics, collected annually by the National Bureau of Statistics of China (NBS).Footnote 18 The employment and wage data from the NBS are compiled by various departments that each employ separate methods of data collection. One method, which yields what we refer to as census data, surveys citizens directly about their employment information. This method supplies information on total employment and is based on the Census of Demographic Changes. The second method, which produces the data we call employer survey data, collects information on employees by surveying their employers. This method supplies information not only on total employment but also on various trends in the workforce, including industry and subeconomy employment and wages.Footnote 19 This paper examines and utilizes both of these sources of data.Footnote 20
In this paper, the census data and employer survey data are used in several ways. For statistics on total employment, we use census data to analyse employment trends. Total employment is then broken down, again using census data, into three sectors: primary, secondary and tertiary. For urban employment, however, we use both census and employer survey data. We use employer survey data when we categorize urban employment data by industries. We first break down employment by industry into four different categories: manufacturing, construction, low-skilled services and high-skilled services. Later, we break down urban employment into formal and informal subeconomies, also using employer survey data.Footnote 21 Here, “informal” implies labour that is often temporary and non-contractual and that lacks any worker protection.Footnote 22 For wage data, we exclusively use the employer survey, with the exception of data on rural–urban migrant workers, for which a distinct survey is administered by the NBS.Footnote 23
Overall Employment Trends
Total employment grew slowly between 2004 and 2018, with several exceptions. Since data collection began in 2004, total employment experienced modest annual gains and even began to decline post-2017 (Figure 1). Indeed, when considering employment growth rates, we can see that overall employment growth was relatively low after the mid-2000s – consistently under 1 per cent – until it became negative for the first time in 2018 (Figure 2).
General Trends in Employment
Source: Rural–urban migrant employment data are from NBS “Annual report of monitoring survey on national rural–urban migrant workers” (NBS 2009–2017); NBS (www.stats.gov.cn).

General Growth Rates of Employment
Source: Rural–urban migrant employment data are from NBS “Annual report of monitoring survey on national rural–urban migrant workers” (NBS 2009–2017); NBS (www.stats.gov.cn).

Although total employment was relatively stagnant, urban employment rose continuously (Figure 1). The census data show that from 2004 to 2018, urban employment increased from under 300 million workers to more than 400 million. Moreover, during those same years, employer survey data show an even sharper rise, from 200 million workers to around 400 million. Although the two sets of data have different starting points, they begin to converge post-2012.
Rising employment in urban labour markets can be seen in Figures 1 and 2. Although urban employment growth rates are consistently higher than the total employment growth rate, the rates of growth have steadily declined in recent years, as evidenced by the employer survey data and the census data. The employer survey data show that urban employment growth rates started tapering off in 2013, while census data show that this decline began three years earlier, in 2010. Even though these trends started at different points in time, they both show an overall decrease in employment growth rates among urban workers. Despite this decline, urban growth rates in 2018 were still at least two percentage points higher than total employment growth rates.
Employment trends by sectors and industries
Although total employment has begun to stagnate and even decrease, this is not the case for all sectors and industries within China's economy, which display markedly different trends. In 1999, employment in the primary sector (mainly agricultural work) comprised half of all employment but fell steadily after 2002, dropping from 350 million to around 200 million workers (Figure 3). Within this decline, in 2011, employment in the primary sector (which was falling) was surpassed by employment in the tertiary sector (which was rising). Similarly, in 2014, employment in the primary sector fell below that of the secondary sector and has exhibited a continuing negative growth trend in the years following.

Unlike the primary sector, secondary sector employment (mostly manufacturing and construction) was rising until the year 2012 (Figure 3). From 1999 to 2012, secondary sector employment rose from 150 million to around 232 million workers, where it reached its peak. After this point, employment began to shrink, falling to 218 million workers in 2017.
Contrary to the primary and secondary sectors, the tertiary sector, which includes two subsectors (the low-skilled service sector and the high-skilled service sector, which includes high technology, banking and education), has consistently shown growth from 1999 to 2017, growth which has accelerated over this period. After 2011, the tertiary sector, in fact, became the most highly employed sector in China's economy, surpassing the primary sector. By 2017, the tertiary sector employed around 350 million people. Owing to the large increase and acceleration of tertiary sector employment, there are now increasingly divergent employment gaps between the tertiary sector (which is growing) and the primary and secondary sectors (which are contracting).
Similarly, when focusing on urban employment, we see that trends diverge importantly by sectors and industries. In Figure 4, urban employment is divided into four categories: secondary sector employment, which is further broken down into manufacturing and construction, and tertiary sector employment, which is further broken down into low-skilled and high-skilled service industry employment. These data are drawn from the employer survey, which allows for this division of sectors. When looking at manufacturing and construction, the data show that after 2014, employment in both industries started to decline (Figure 4), following the trend of secondary sector employment according to the census data (Figure 3).
Industry Trends in Urban Employment
Source: NBS (www.stats.gov.cn).
Notes: Low-skilled services include wholesale and retail trades, transport, storage and post, hotels and catering services, leasing and business services and services to household, repair and other services. High-skilled services include information, transmission, software and information technology, financial intermediation, real estate, scientific research and technical services, education, health and social services, culture, entertainment and sports.

In sharp contrast to the manufacturing and construction sectors, the data show a steady rise in employment in the high-skilled and low-skilled service industries. Specifically, Figure 4 shows growth in low-skilled services that, in 2008, surpassed the employment of high-skilled services and began to accelerate even further after 2010. The data also show a steady, consistent rise in high-skilled services employment from 2004 to 2017, which, although large, does not match the pace of the low-skilled service industry.
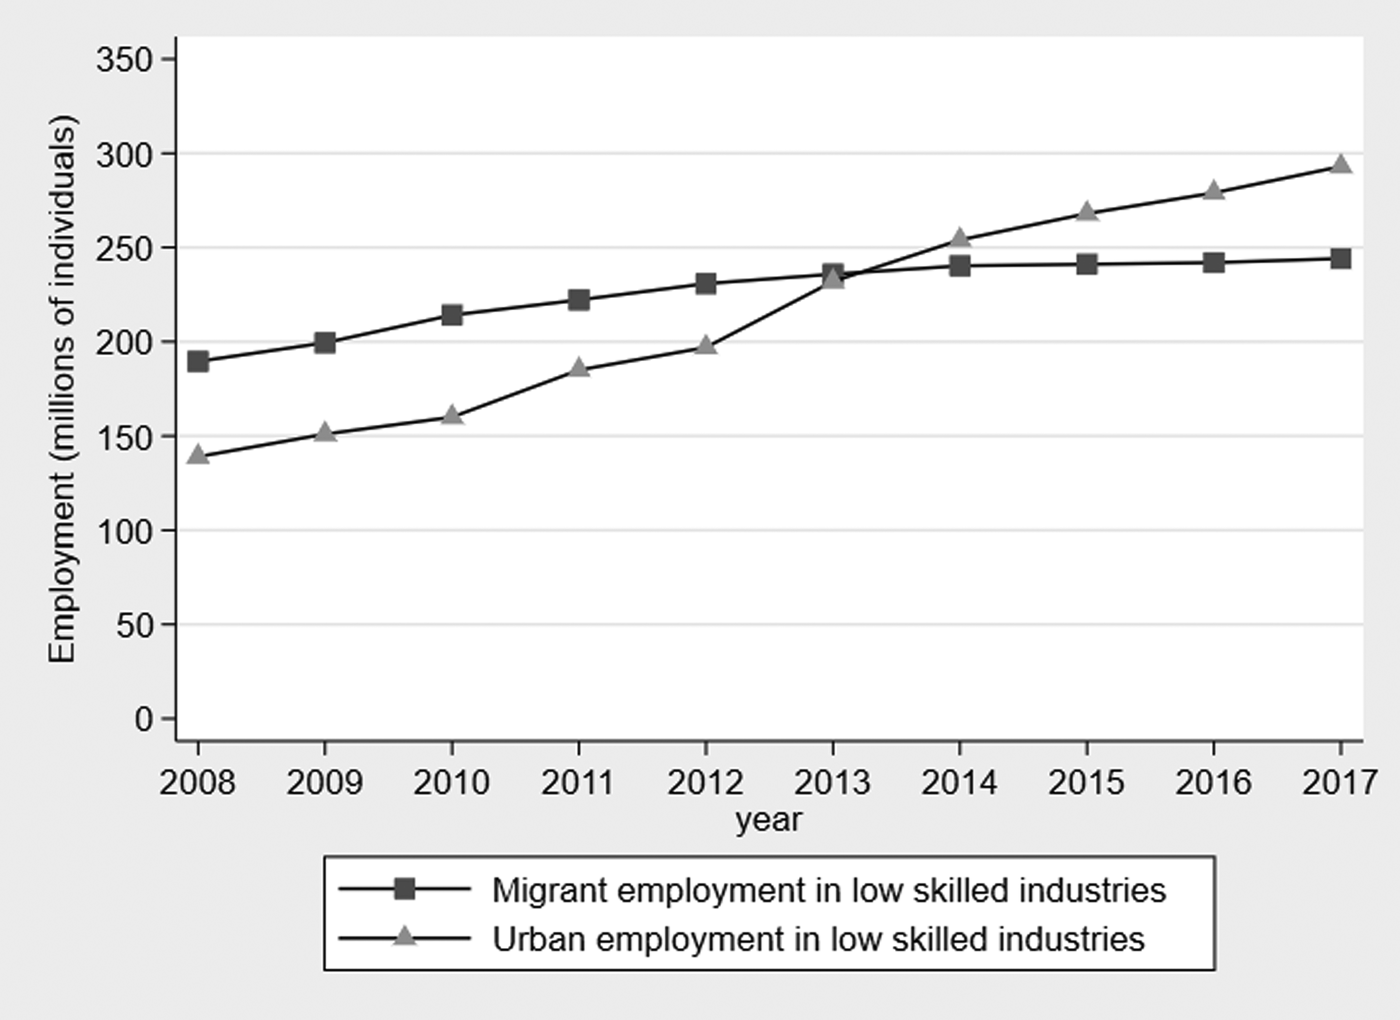
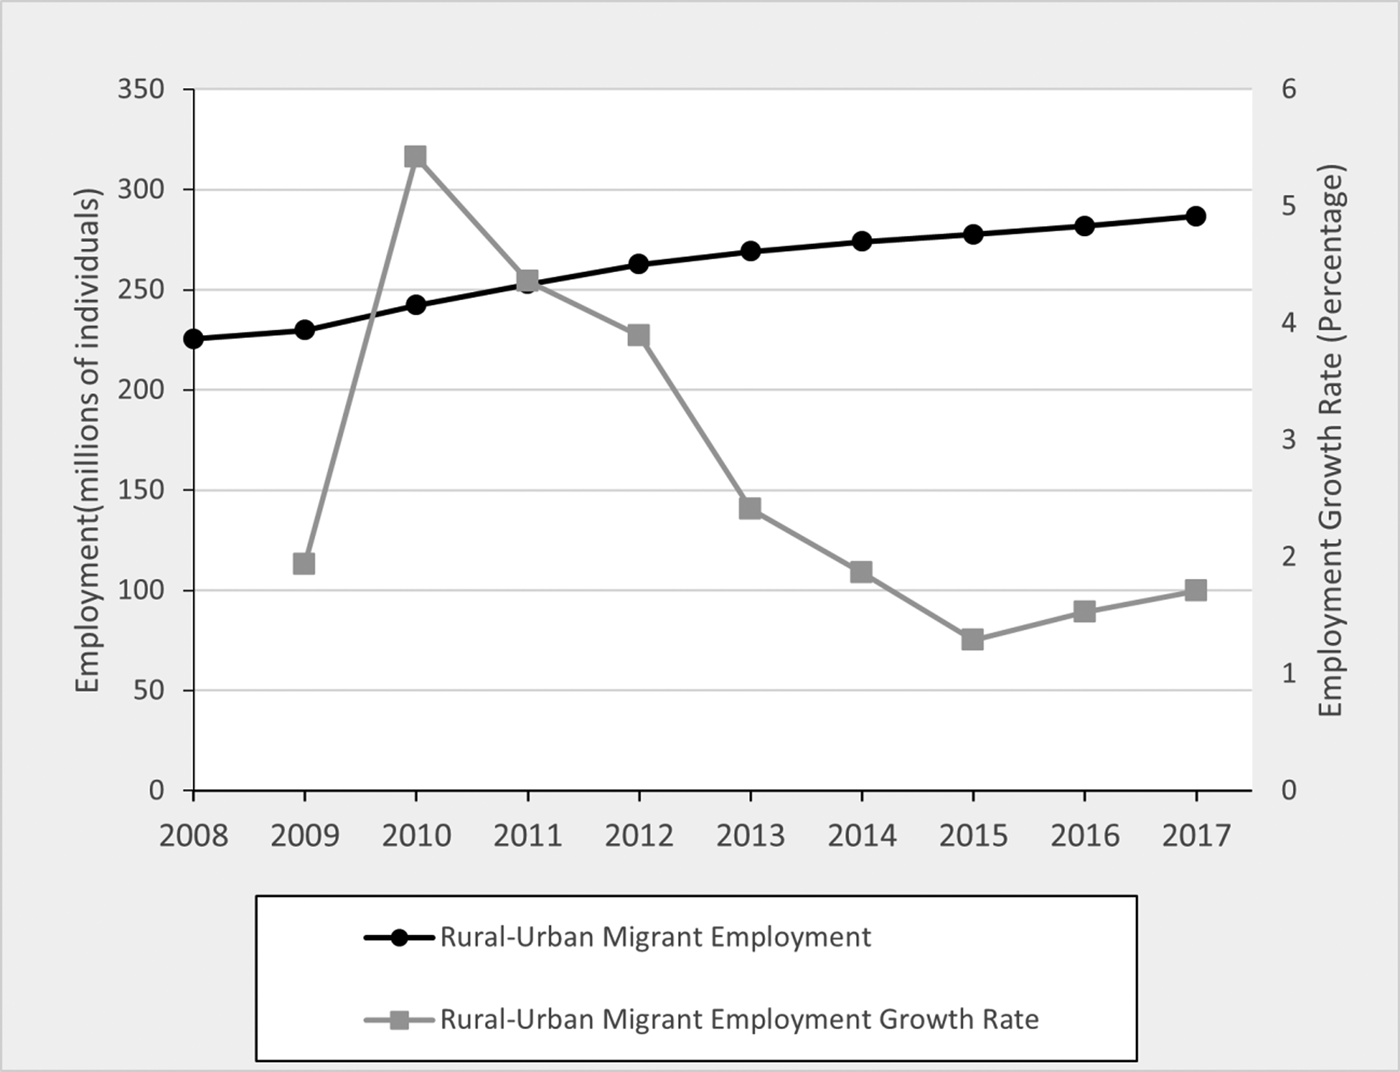
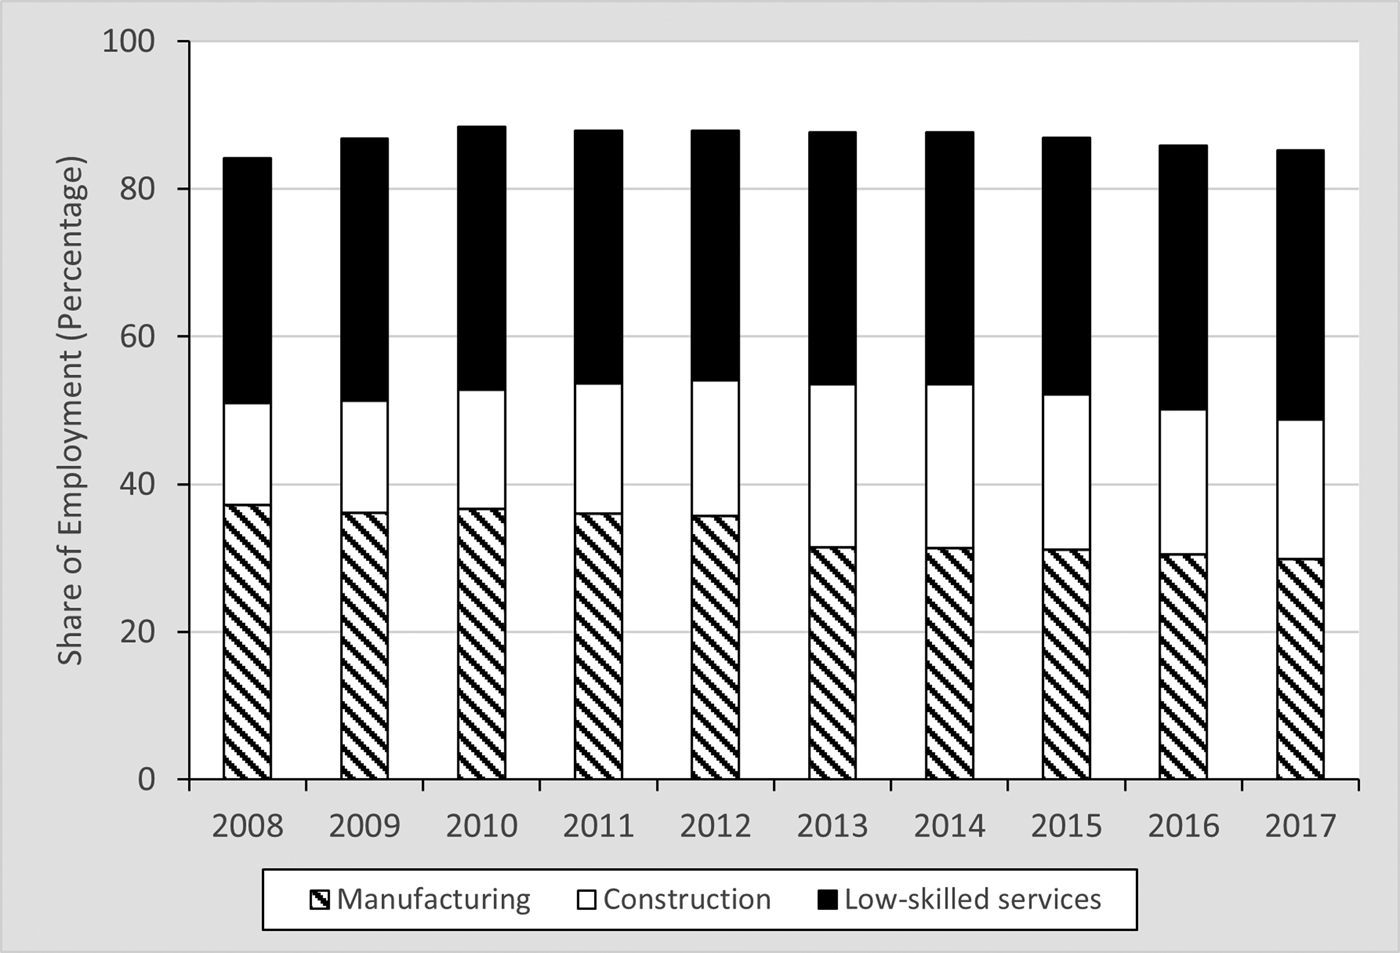
On the whole, the number of migrant workers is increasing; however, the rate of this growth is slowing (Figures 5 and 6), which is almost certainly owing to the close ties between the employment structure of migrant labour and low-skilled labour in general. As of 2017, low-skilled jobs accounted for 84.4 per cent of migrant labour (Figure 7), or around 244 million workers. As a whole, low-skilled jobs employed 293 million workers, implying that the large majority of low-skilled employment is migrant labour.
Low-skilled Employment Trends of Migrant and Urban Employment
Source: Rural–urban migrant employment data are from NBS “Annual report of monitoring survey on national rural–urban migrant workers” (NBS 2009–2017); NBS (www.stats.gov.cn).
Note: Low-skilled industries include manufacturing, construction and low-skilled services.

General Trends of Rural–Urban Migrant Employment
Source: Rural–urban migrant employment data are from NBS “Annual report of monitoring survey on national rural–urban migrant workers” (NBS 2009–2017).

Industry Trends in Rural–Urban Migrant Employment
Source: Rural–urban migrant employment data are from NBS “Annual report of monitoring survey on national rural–urban migrant workers” (NBS 2009–2017).
Notes: Low-skilled services include wholesale and retail trades, transport, storage and post, hotels and catering services and services to household, repair and other services.

Employment trends in the formal and informal economies
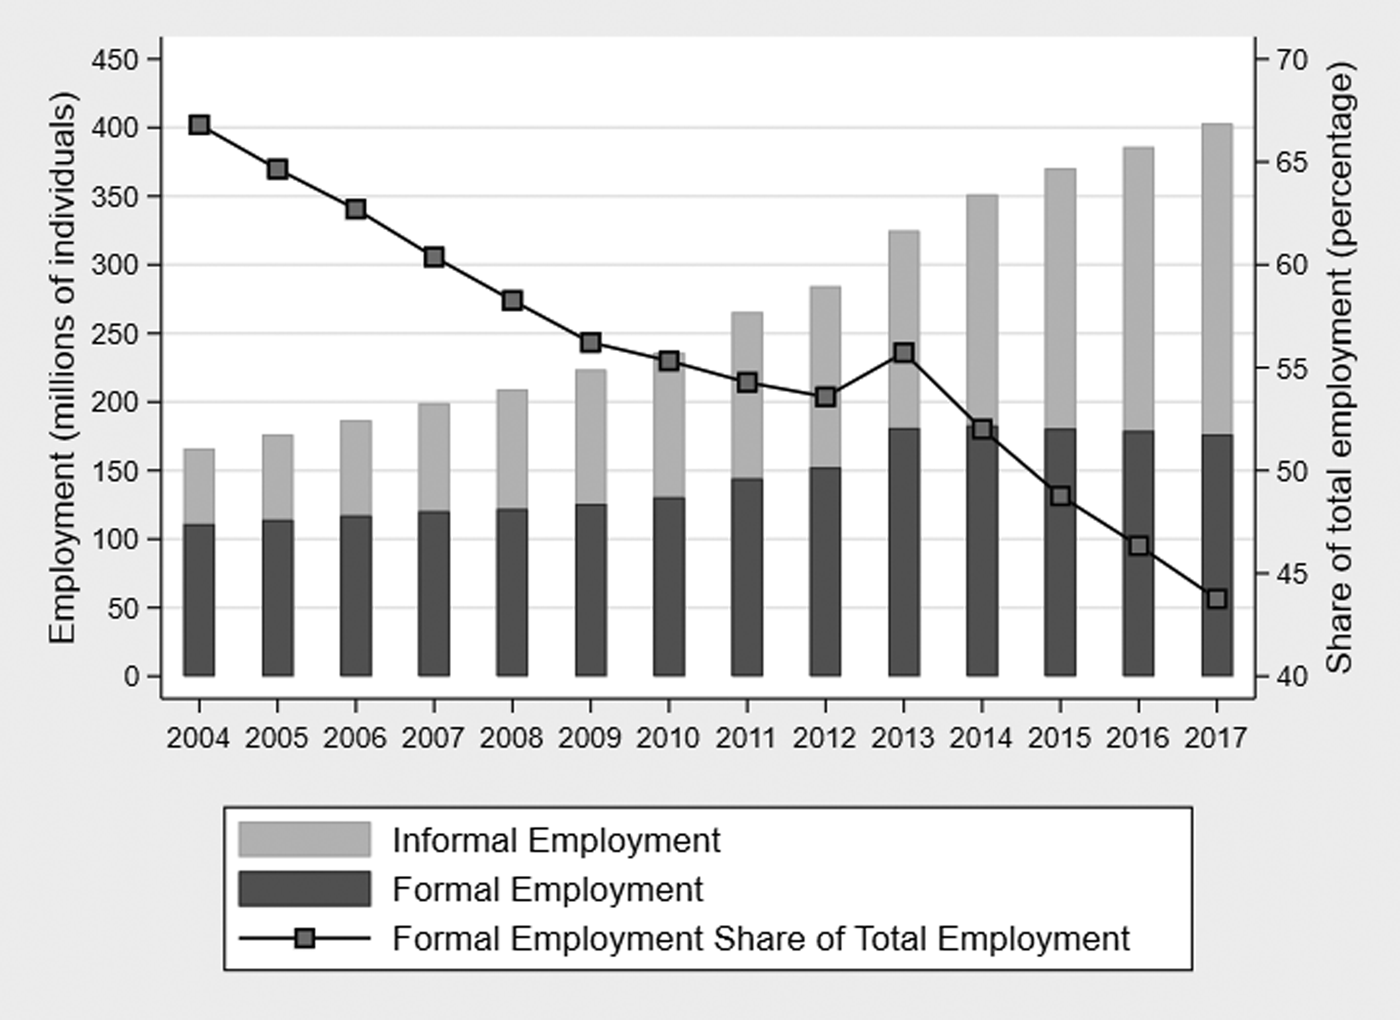
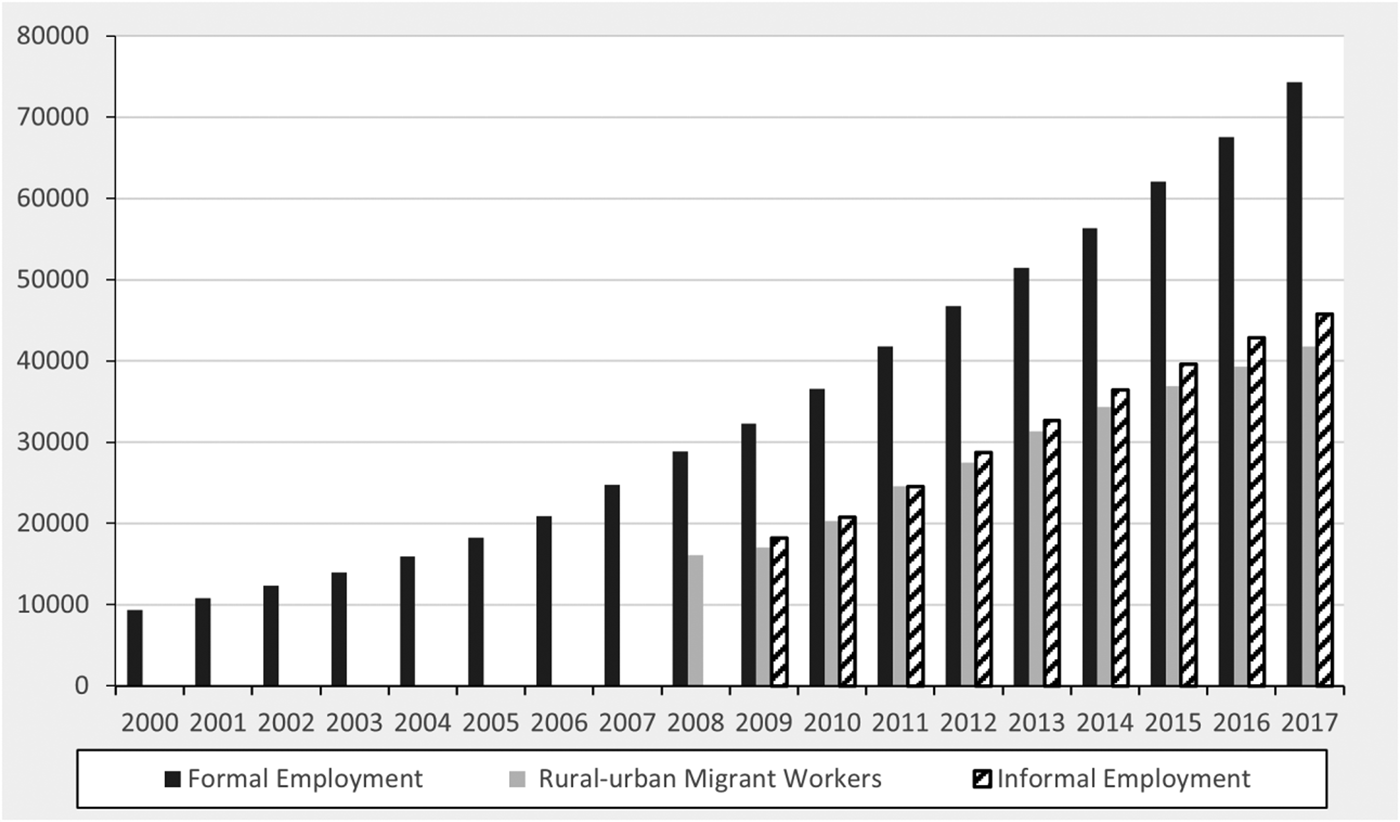
Urban employment data can also be broken down into subeconomies (formal and informal), which also have unique and important trends. Figure 8 shows a large rise not only in total urban employment but also in the share of employment in the informal subeconomy. In 2004, around 67 per cent of total employment was in the formal subeconomy but, by 2017, this had fallen to less than 44 per cent, essentially reversing the formal and informal shares of total employment. The steepest drop in the formal employment share began in 2013 and has trended downward since.

Figure 9 illustrates the driving forces of the overall employment trends when various industries, side by side within each subeconomy, are taken into consideration. Decreasing employment in manufacturing and construction (Panel A) appears to have caused the decline of formal employment in the share of total employment (Figure 8). Despite these declines, high-skilled services in the formal subeconomy grew at a relatively steady pace. When considering the informal subeconomy, however, we see increasingly large growth in the low-skilled service industry (Panel B). By 2017, the low-skilled service industry had grown to 72 per cent of the informal subeconomy, at around 155 million workers. Thus, low-skilled services are essentially synonymous with China's informal subeconomy as a whole.
Industry Trends in Formal and Informal Employment
Source: NBS (www.stats.gov.cn).
Notes: Low-skilled services include wholesale and retail trades, transport, storage and post, hotels and catering services, leasing and business services and services to household, repair and other services. High-skilled services include information, transmission, software and information technology, financial intermediation, real estate, scientific research and technical services, education, health and social services, culture, entertainment and sports.

Summary of the characteristics of employment trends
Although total employment has maintained general stability, when broken down into industries, sectors and subeconomies, a few divergent trends surface. When considering the formal subeconomy as a whole, we see widespread stagnation, and employment even fell between 2013 and 2017, from 181 million workers to 176 million. More specifically, employment in manufacturing and construction began to decline after 2013, while employment in the high-skilled service industry has risen slowly but steadily.
In contrast, when looking at trends in the informal subeconomy, we see that employment growth has largely outpaced that of the formal subeconomy. Predominantly owing to low-skilled services, growth in the informal subeconomy was steady between 2004 and 2013, after which it accelerated. Although these trends began in the early 2000s, they became much more pronounced in 2012 and 2013, indicating the possibility that China may have begun a new phase of economic growth. To further analyse this potential phase of growth, we will now examine wage trends in China's economy.
Overall Wage Trends
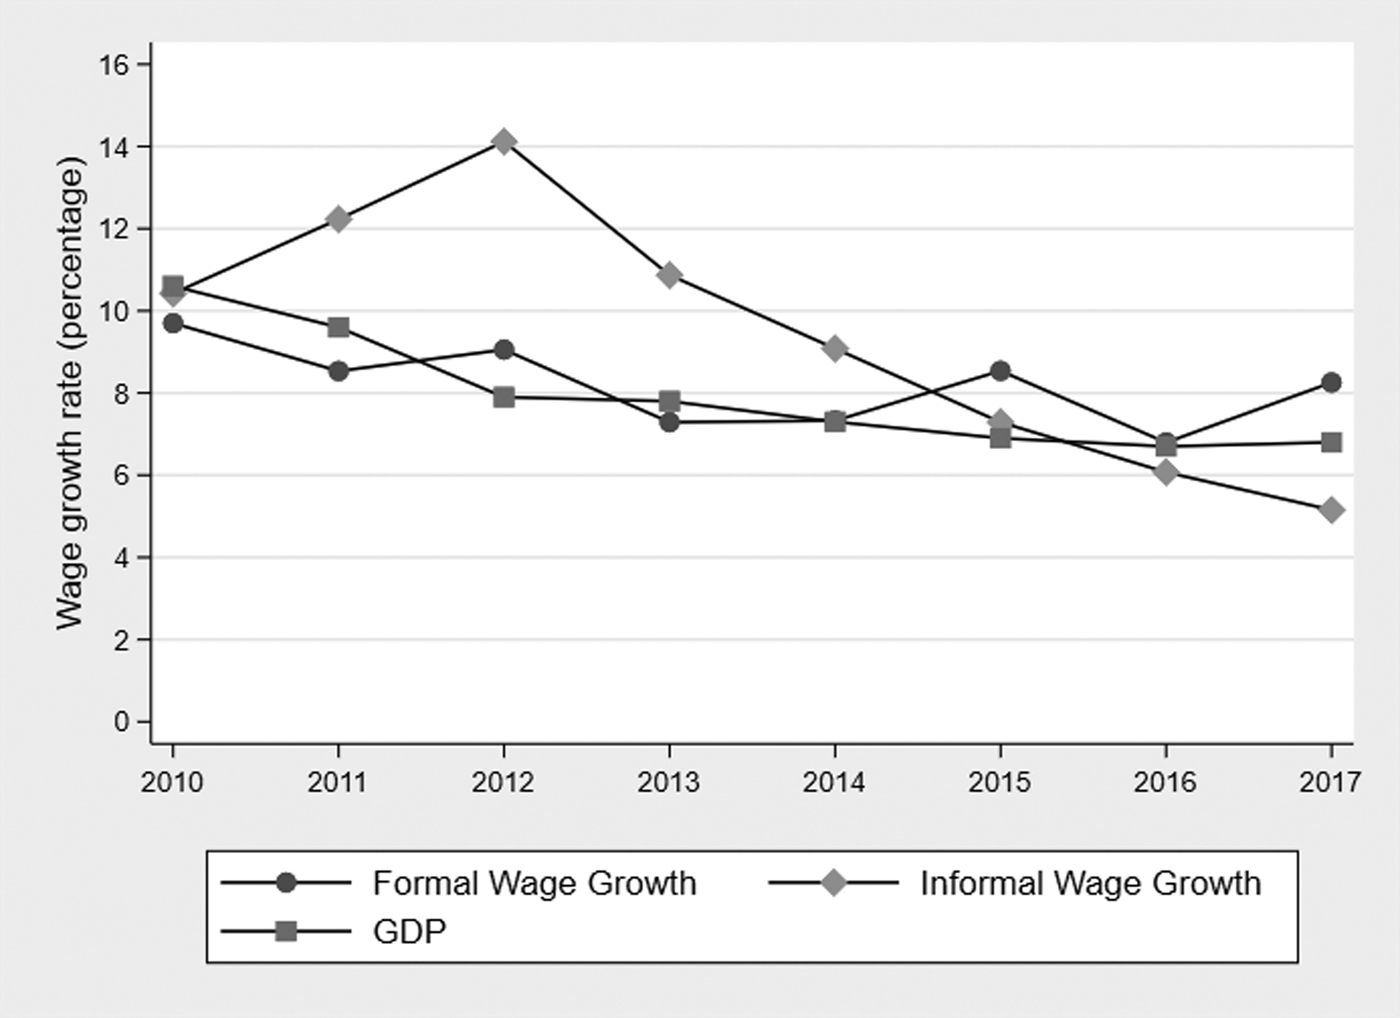
Although wages have generally trended upward since the year 2000, trends are not consistent for every type of employment. Figure 10 provides a breakdown of the wage growth rates from 2010 to 2017 for the formal subeconomy, the informal subeconomy and GDP for comparison, using data from the employer survey. When looking at wage growth for the informal subeconomy, we see that it rose until 2012, at which point the rate of growth began to decline and continued to do so. By 2016, the growth of GDP overtook informal wage growth, a gap that has continued to widen. When looking at wage growth in the formal subeconomy, we see that the general trend has been fairly even. Until 2014, formal wage growth had been declining gradually. In 2015 and 2017, however, formal wage growth saw upward spikes that allowed it to overtake GDP and informal wage growth.
Formal and Informal Average Annual Wages, Real Growth Rates
Source: NBS (www.stats.gov.cn).

To better understand which workers constitute the informal subeconomy, Appendix Figure A.1 (online) provides a comparison of the annual wage growth of informal employment and rural–urban migrant employment. To further the comparison, Appendix Figure A.2 provides a replication of Figure 10, replacing informal subeconomy wage growth with rural–urban migrant wage growth. Appendix Figure A.1 shows that average annual wage growth is almost identical for informal employment and rural–urban migrant employment. Appendix Figure A.2 shows the same situation, mimicking the trends found in Figure 10. Thus, the terms “rural–urban migrant employment” and “informal subeconomy employment” are essentially interchangeable.
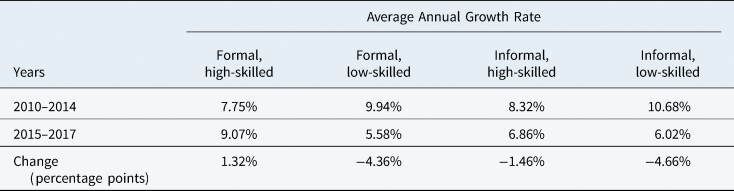
Table 1 provides a further breakdown of formal and informal wage trends by skill type. From 2010 to 2014, the average annual growth rate of formal high-skilled wages was 7.75 per cent (row 1, column 1) and rose to 9.07 per cent in the period 2015–2017 (row 2, column 1). In contrast, informal low-skilled wage growth was 10.68 per cent in the period 2010–2014 (row 1, column 4) but fell to 6.02 per cent in the period 2015–2017 (row 2, column 4), falling below formal high-skilled wage growth. This reversal of formal and informal wage growth rates illustrates the trends found in Figure 10. Further, we find that formal, low-skilled wage growth fell by 4.36 percentage points between the 2010–2014 period and the 2015–2017 period (row 3, column 2), almost exactly the same as informal, low-skilled wage growth, which fell 4.66 percentage points between the two periods (row 3, column 4). Examining all four skill and sub-economy categories, we find that only formal, high-skilled wage growth increased between the two periods (row 3).
Skill Type Breakdown of Average Annual Real Growth Rates

Source: NBS (www.stats.gov.cn).
Notes: Low-skilled industries include manufacturing, construction, wholesale and retail trades, transport, storage and post, hotels and catering services, leasing and business services and services to household, repair and other services. High-skilled industries include information, transmission, software and information technology, financial intermediation, real estate, scientific research and technical services, education, health and social service, and culture, entertainment and sports. The wage growth rate of informal high-skilled industries is calculated as an arithmetic average growth rate. The wage growth rates of formal low-skilled industries, informal low-skilled industries and formal high-skilled industries are weighted average growth rates. Real wages are defined as nominal wages adjusted for CPI.
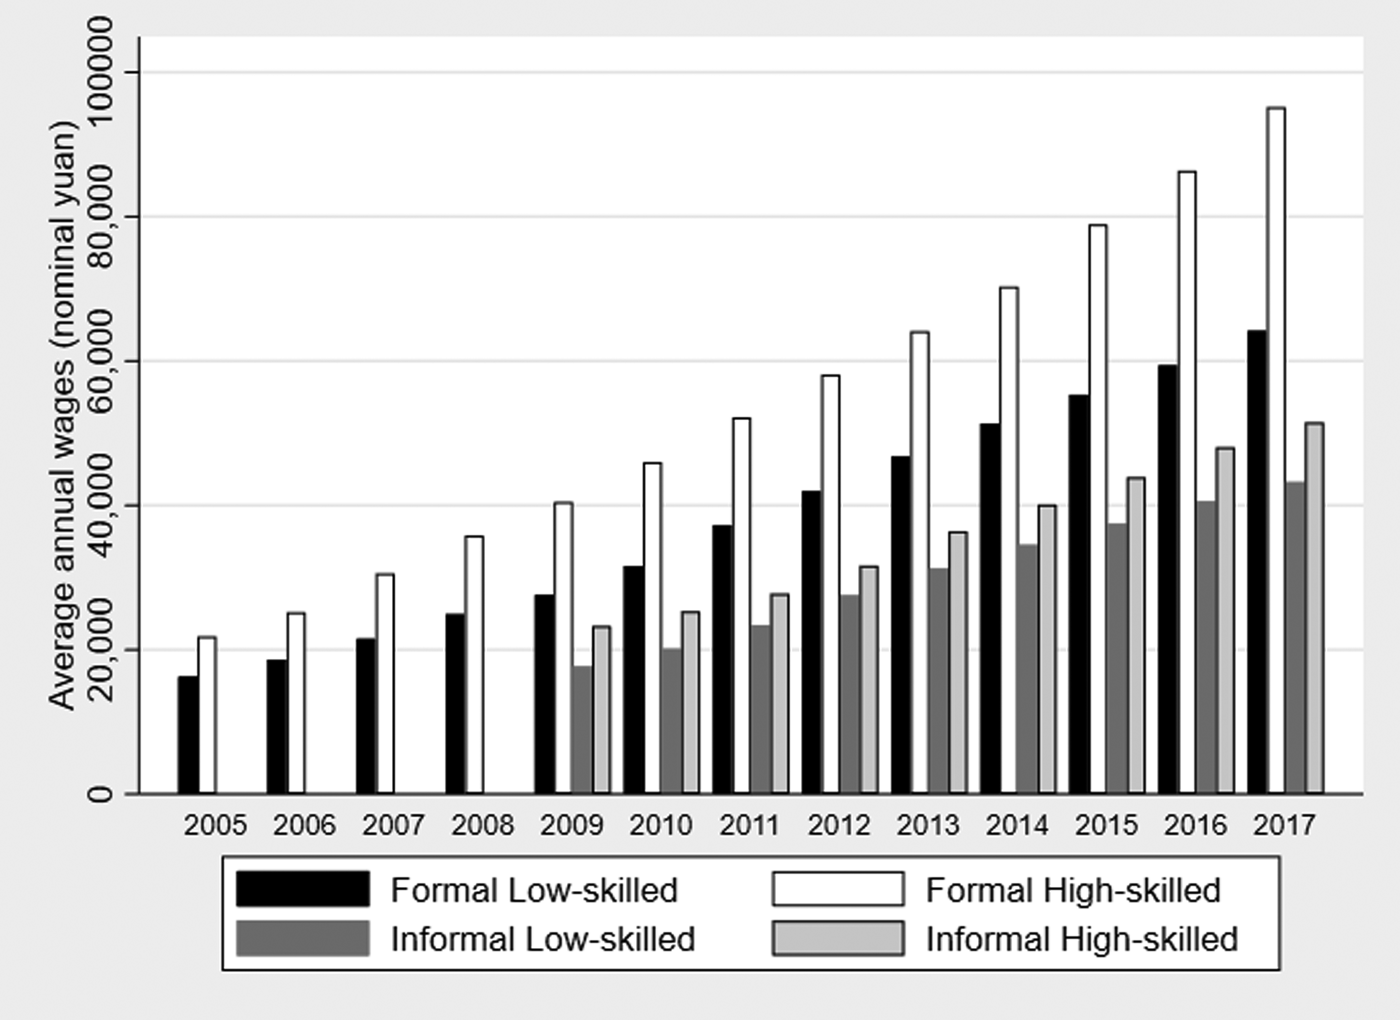
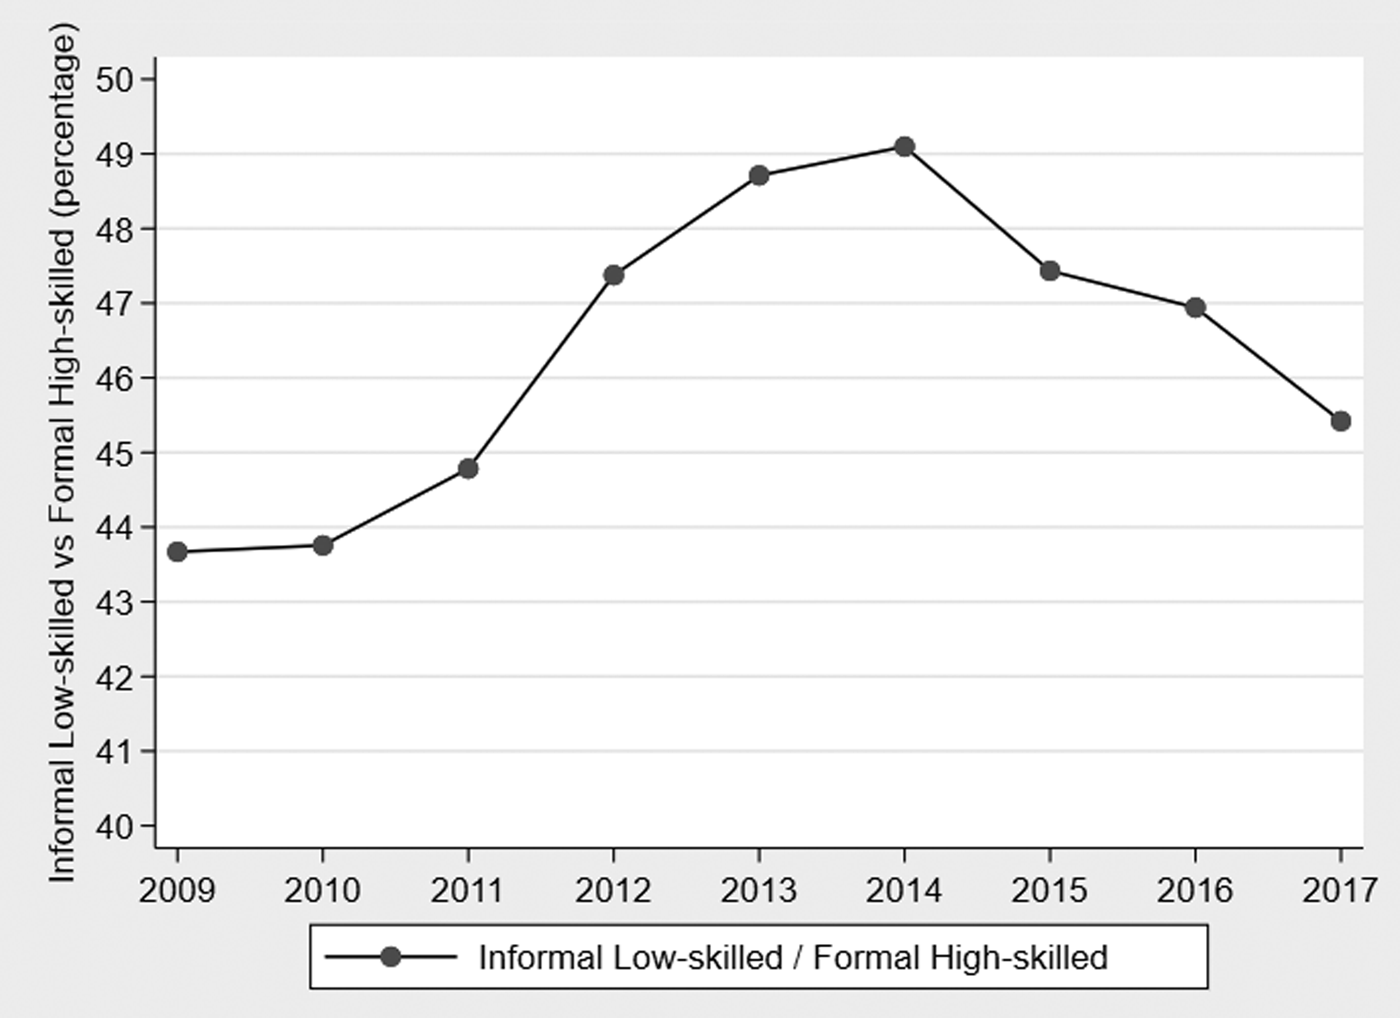
The raw wage data tells a further story of polarization. As shown in Table 1, formal, high-skilled wage growth rates have increased on average, while informal, low-skilled wage growth rates have decreased on average. On top of this, when viewing the raw wages themselves (Figure 11A), formal high-skilled wages begin at a level that is at least twice as high as that of informal low-skilled wages. Combined with the polarizing growth rates, this wage gap has only widened in recent years, and points to an increasingly polarized future. This can be seen in Figure 11B, which compares informal, low-skilled wages to formal, high-skilled wages. Prior to 2013–2014, average low-skilled wages were actually catching up to average high-skill wages; however, low-skilled wages peaked at 49 per cent of high-skilled wages in 2014 and have been declining ever since.
Urban Average Annual Wages, 2005–2017 (Nominal Yuan)
Source: NBS (www.stats.gov.cn).
Notes: Low-skilled industries include manufacturing, construction, wholesale and retail trades, transport, storage and post, hotels and catering services, leasing and business services and services to household, repair and other services. High-skilled industries include information, transmission, software and information technology, financial intermediation, real estate, scientific research and technical services, education, health and social services, culture, entertainment and sports.

Urban Average Annual Wages Gap between Formal High-skilled and Informal Low-skilled, 2009–2017 (Nominal Yuan)
Source: NBS (www.stats.gov.cn).
Notes: Low-skilled industries include manufacturing, construction, wholesale and retail trades, transport, storage and post, hotels and catering services, leasing and business services and services to household, repair and other services. High-skilled industries include information, transmission, software and information technology, financial intermediation, real estate, scientific research and technical services, education, health and social services, culture, entertainment and sports.

Formal, Informal and Rural–Urban Migrant Average Annual Wages, 2000–2017 (Nominal Yuan)
Sources: Rural–urban migrant wage data are from NBS “Annual report of monitoring survey on national rural–urban migrant workers” (NBS 2009–2017); NBS (www.stats.gov.cn).

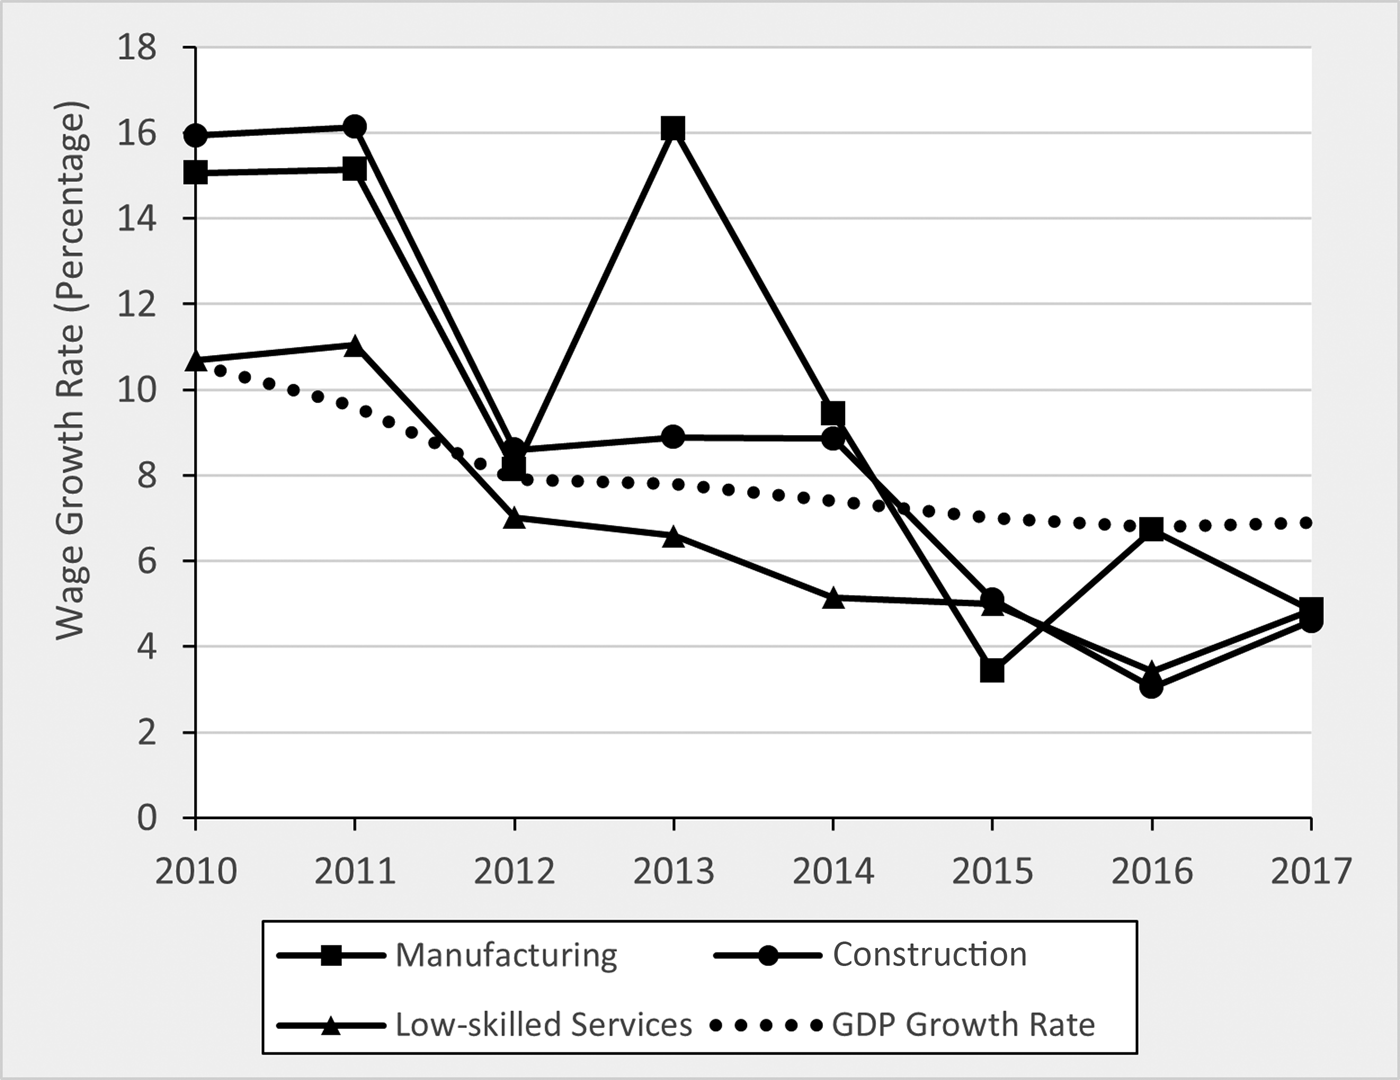
Turning to wage growth in the rural–urban migrant population (Figure 12), we again see trends similar to that of informal employment. Before 2014, the wage growth rate of the manufacturing and construction industries was higher than that of GDP; however, after 2014, these sectors joined low-skilled services with growth rates that fell below that of GDP. The wage growth rate of low-skilled services has experienced a fairly steady downward trend, dipping below the GDP growth rate in 2012, a gap which has continued to widen.
Industry Trends in Rural-Urban Migrant Average Annual Wages, Real Growth Rates
Source: Rural–urban migrant wage data are from NBS “Annual report of monitoring survey on national rural–urban migrant workers” (NBS 2009–2017); NBS (www.stats.gov.cn).
Notes: The rural–urban migrant average annual wage in each industry is calculated from average monthly wages. Low-skilled services include wholesale and retail trades, transport, storage and post, hotels and catering services and services to household, repair and other services. The wage of low-skilled services is a weighted average, weighted by the employment of each industry from the previous year. Real wages are defined as nominal wages adjusted for CPI.

Summary of the characteristics of wage trends
Despite the diversity of wage trends found in the data, two primary trends appear when looking at different subeconomies, industries and sectors. The first of these trends is wage growth in the formal subeconomy, which has surpassed not only that of GDP but also wage growth in the informal subeconomy, which itself has fallen below GDP. When considering different skill levels, the growth rate of high-skilled wages has increased, whereas the growth rate of low-skilled wages has decreased. Although the data necessary to determine the root causes are not present in this study, rising polarization between high- and low-skilled wages appears to be leading to divergence in wage and wage growth trends between the formal and informal subeconomies.Footnote 24
Overall, when comparing these wage trends to the employment trends discussed earlier, we find two main subeconomy trends. Although the formal high-skilled industries saw moderate employment growth in recent years, wages in these industries saw rapid growth during that same time. Informal low-skilled industries, in contrast, saw accelerating growth in employment, much faster than that in the formal subeconomy, but also a reduction in the growth of wages. Even though an empirical analysis is still needed (although beyond the scope of this paper), below, we draw on some of the forces that drove the economy in the 2010s (as discussed above) to provide a series of hypotheses for further study.
Before discussing the trends presented above, it should be noted that China often experiences economic variation between geographic regions, and thus we present a regional breakdown of employment and wage trends in eastern, central and western China in the online Appendix Figures A.3–A.11. Aside from very small regional variations, we largely find quite similar employment and wage trends throughout China. Notably, employment in the low-skilled service sector has experienced the largest growth, with high-skilled services experiencing moderate growth while other industrial sectors (for example, manufacturing and construction) have stagnated. These trends are exaggerated when employment is divided into the formal and informal subeconomies. In terms of differences, employment trends in central and western China are almost identical, while eastern China has a larger share of manufacturing employment as compared to the other regions. Additionally, employment growth trends are larger in eastern China, and remain relatively lower in the central and western regions. In terms of wage trends, wage growth in all regions is very comparable. Informal wage growth begins high in all regions, falling below GDP growth around 2014–2015, while formal wage growth begins relatively low, but surpasses GDP growth and informal wage growth around the same 2014–2015 period.
Discussion
The polarization of employment and wages that has been demonstrated in this paper suggests that China's economy may be facing a new and potentially serious problem in the coming years. In the 13th Five-Year Plan (FYP) (2016–2020),Footnote 25 China attempted to narrow the growing inequalities between urban and rural areas through a set of substantial reforms intended to increase urbanization of the population. These reforms included construction of affordable urban housing, creation of urban jobs, increased social welfare and changes to the household registration (hukou 户口) system.Footnote 26 If these reforms had been fulfilled, the economic gap between urban and rural citizens could have been much smaller than it is today.
Unfortunately, owing to shifting global and economy-wide factors such as automation and the globalization of supply chains (and other factors), growth of employment in the manufacturing sector has slowed.Footnote 27 The effects of these shifts can be seen in the data presented above: as the demand for labour in the manufacturing and construction industries has fallen in China, low-skilled wages in these industries have stagnated, and many of the now-redundant low-skilled workers have been forced to shift into the low-skilled service sector. The migration of labour, alongside the shifting economy-wide and global factors that caused it, has forced China to alter plans for its economy. Automation alone has proved to be a characterizing factor in the nature of employment in manufacturing and is behind the shift of workers to other sectors. According to the International Federation of Robotics, between 2005 and 2016 the growth rate of China's industrial robot stock reached 38 per cent and, in 2016 alone, China accounted for around 30 per cent of the global market for robots.Footnote 28 Moreover, Yongqin Wang and Wen Dong show that robot application has a sharp substitution effect on labour demand, as a 1 per cent increase in industrial robot usage was associated with a 0.18 per cent decrease in labour demand.Footnote 29 In particular, because of the shift of manufacturing from China to other countries, employment in China decreased by 1.70 million in 2012, and is predicted to have decreased by 2.03 million in 2020.Footnote 30 On top of this employment loss, foreign direct investment (FDI) in manufacturing alone decreased continuously by an average of US$3.1 billion per year between 2012 and 2017.Footnote 31 As a result, targets for GDP growth have been lowered and even removed, as the proposals for the 14th FYP (2021–2025), introduced during the Fifth Plenum in October 2020, do not include any annual growth targets.Footnote 32 Instead, a new goal of doubling GDP by 2035 was introduced,Footnote 33 which, if met, would mean only a 4.7 per cent average annual growth rate, which is significantly lower than the annual growth rate targets in the 12th and 13th FYPs.Footnote 34
In this period of slow economic growth, how will China address the employment and wage problems it had previously been attempting to solve? In the 14th FYP, China introduced two proposals to reduce the rural–urban economic disparity, the first of which aims to improve rural employment and income levels.Footnote 35 This proposal would increase urbanization of small towns and small and medium cities via urban renewal, construction and renovation, and simultaneously revitalize rural areas via agricultural development.Footnote 36 Clearly, China is attempting to move workers displaced from manufacturing and construction in China's mega-cities into less-central urban areas or back to farming and agriculture. The question is, of course, will there be employment in these areas?
The second proposal, the implementation of a dual circulation economy, introduced in the 14th FYP, is designed to solve the employment problem in these fourth- and fifth-tier cities and rural areas (as well as the rest of China). Through this policy, domestic demand is supposed to become the main driving force of the economy (while the second component of this policy is supposed to be the continuation of international trade, albeit at a reduced volume). This lessening of trade, and the associated falling work, as well as the jobs lost through automation and supply chain relocations, is supposed to be offset by the higher domestic demand for workers induced by greater levels of urbanization. Unfortunately, the cities affected by the increased urbanization outlined in the 14th FYP, by definition, have little if any manufacturing (and low levels of construction in the long run) and so only demand for services remains. Because demand for services is driven mostly by the local population and since the income of the newly arriving families (laid-off workers and new job entrants from rural communities) in no small part will be low income, demand for any products or services will remain restricted (since low-income individuals have a relatively low demand for services). Hence, it is difficult to imagine how there will be a surge of income in these literally thousands of newly created mini-urban centres. Therefore, employment opportunities for these newly urbanized rural workers will be extremely limited and relegated to the low-wage, informal service sector, continuing the trends observed in this study.
This is the challenge faced by China's government and its people. If these trends continue, the polarization of employment and wages may grow only wider. As we argue here, although we hope that we are wrong, it is uncertain whether the strategies proposed in the 14th FYP will halt this emerging cycle.
Supplementary material
To view supplementary material for this article, please visit https://doi.org/10.1017/S0305741022001692.
Acknowledgements
We acknowledge financial support from the National Social Science Foundation of China (Grant No. 22BJY110) and National Natural Science Foundation of China (Grant No. 71804132). We wish to thank the many anonymous reviewers for their constructive advice.
Conflicts of interest
None.
Yiran XIA is a professor in the Business School of Wenzhou University, China. She has long been engaged in the study of labour mobility, human capital agglomeration and labour polarization. Her work has been published in Comparative Economic Studies, Economic Research Journal (in Chinese) and Management World (in Chinese), among others. Her book, The Power of Space: Human Capital Accumulation through Agglomeration, was published by Shanghai People's Press.
Dimitris FRIESEN is an academic editor in the Freeman Spogli Institute for International Studies at Stanford University. His research has focused mainly on nutrition, health and education in rural China.
Nourya COHEN is an undergraduate student at Stanford University.
Caijie LU is a graduate student in the Business School of Wenzhou University, China. He mainly studies the polarization of the labour market and the complementarity of high-low skilled labour.
Scott ROZELLE is the Helen F. Farnsworth senior fellow and the co-director of the Stanford Center on China's Economy and Institutions in the Freeman Spogli Institute for International Studies and Stanford Institute for Economic Policy Research at Stanford University. His research focuses almost exclusively on China and is concerned with agricultural policy, including the supply, demand and trade in agricultural projects; the emergence and evolution of markets and other economic institutions in the transition process and their implications for equity and efficiency; and the economics of poverty and inequality, with an emphasis on rural education, health and nutrition.