

Introduction
The training demands placed on the equine athlete must be supported with proper nutrition. Besides the common balanced diet of hay/grain/water, many trainers include nutritional supplements in a horse's daily regimen. Fed primarily for their caloric and mineral value, some supplements may also contain performance-enhancing compounds such as citrates and/or sodium bicarbonate. The administration of sodium bicarbonate can enhance the performance by increasing the buffering capacity of blood and extracellular fluids of muscleReference Frey, Kline, Foreman, Brady and Cooper1–Reference Auer, Skelton, Tay and Badlock9. Administering sodium bicarbonate or other alkalinizing agents via a nasogastric tube prior to competition is a well-known (and illegal) abuse of the buffering capabilities of these compoundsReference Frey, Kline, Foreman, Brady and Cooper1–Reference Auer, Skelton, Tay and Badlock9. This practice, commonly known as ‘milkshaking’, is not only a potential threat to the heath and welfare of the horse, but it also affects the integrity of the entire racing industryReference Frey, Kline, Foreman, Brady and Cooper1–Reference Auer, Skelton, Tay and Badlock9.
To counter this threat, many racing jurisdictions measure total plasma carbon dioxide (tCO2) concentration before or after a race. Plasma tCO2 concentration is an important physiological factor that is controlled to ensure the tight regulation of blood pHReference Lloyd, Reilly and Rose4, Reference Auer, Skelton, Tay and Badlock9–Reference Kauffman, Kline, Forman and Lyman13. Mammals, such as horses, transport 90–95% of all CO2 produced in metabolically active tissue to the lungs in the form of carbonic acidReference Lloyd, Reilly and Rose4. This chemical species rapidly dissociates to bicarbonate and hydrogen ions in the presence of an aqueous environment, and thus renders tCO2 an effective measure of bicarbonate concentration within blood plasmaReference Lloyd, Reilly and Rose4. Multiple papers have reported that the average plasma tCO2 concentration for racing horses is ~30 mmol l− 1Reference Lloyd, Reilly and Rose4, Reference Auer, Skelton, Tay and Badlock9–Reference Kauffman, Kline, Forman and Lyman13. Thus, to avoid false positives, most racing jurisdictions have set the threshold for a positive test at 37 mmol l− 1Reference Lloyd, Reilly and Rose4, Reference Auer, Skelton, Tay and Badlock9–Reference Kauffman, Kline, Forman and Lyman13, which is approximately 4 standard deviations from the mean. However, one should caution that this threshold is based on a natural physiological marker, and the administration of any substance (legitimate like a feed supplement or illicit like a ‘milkshake’) that alters acid–base status can push a horse towards the threshold recognized as an actionable positive.
Variations in diet have the potential to affect acid:base status in the horseReference Kauffman, Kline, Forman and Lyman13. It has been shown that horses on pasture have different plasma tCO2 concentrations when compared with horses fed a hay/grain rationReference Kauffman, Kline, Forman and Lyman13. Other studies have shown that dietary cation and anion differences may have an effect on the acid–base status of horses consuming various types of starchReference Kauffman, Kline, Forman and Lyman13, Reference Mueller, Topliff, Freeman, MacAllister, Carter and Cooper14. In addition to forage and hay/grain, racehorses are often fed pelleted feeds which may contain ingredients having the potential to act as an alkalinizing agent. Unfortunately, there are no published studies on the effects of pelleted feed supplements on plasma tCO2 concentrations, particularly during high-intensity exercise. This lack of information is a potential problem for racehorse owners/trainers, who feed supplements in good faith, unaware of any possible effect on tCO2. Therefore, the purpose of this study was to measure the effect of three commercially available pelleted supplements (chosen based on the frequency of their use in New Jersey) on plasma tCO2 concentrations in Standardbred horses before and after exercise.
Materials and methods
All methods and procedures used in this study were reviewed and approved by the Rutgers University Institutional Review Board for the Care and Use of Animals. Prior to beginning the study, ten clinically healthy unfit Standardbred mares (~522 kg, 9–13 years old) were trained (taught) to run on a high-speed equine treadmill (Sato I; Equine Dynamics, Lexington, KY, USA). The horses were also familiarized with the equipment present in the Equine Science Center's exercise physiology laboratory. This study followed a semi-randomized, crossover, repeated-measures design. The three commercial products used as treatments included Strategy Professional Formula GX, Omolene 200 and Drive. These products were chosen based on the frequency of their use by Standardbred/Thoroughbred owners and trainers in New Jersey. A fourth treatment of regular oats was used as a control. While the ingredients and quantities of ingredients in each product are proprietary information, the labels for Strategy and Omolene 200 did not indicate the presence of any alkalinizing substances at the time the study was conducted. Since then the ingredients have changed, and it is recommended that one reads all labels before considering a feed supplement. The label for Drive (Omco, Inc., Ondon, IN, USA) listed cobalt carbonate and iron carbonate as trace ingredients.
The ten mares were randomly divided into two groups, group A and group B (five mares in each group), based solely upon the days they were to run on the treadmill. The amount of pelleted feed given to each horse was based on the product's guidelines for mature sedentary horses and based on body weight (average daily amounts were as follows: Strategy – 2.6 kg day− 1, Omolene – 2,4 kg day− 1, Drive – 0.45 kg day− 1 and oats 2.5 kg day− 1). Each mare received one of the four supplement treatments according to a randomly assigned treatment schedule. After a 7-day feeding period, the groups were subjected to a simulated race test (SRT) on a high-speed treadmill with blood samples taken before supplementation ( − 4 h), 10 min prior to exercise and at 0, 60 and 90 min post-exercise. Following the SRT, the horses were switched to one of the other treatmentsReference Ciolino, Lehnhard and McKeever15–Reference Szucsik, Balaskonis and McKeever17. Supplementation was administered in stalls in the morning and afternoon followed by turnout to dry lot paddocks. In the outside paddocks, the mares were housed in groups and fed approximately 12 kg horse− 1 day− 1 of mixed alfalfa-grass hay divided into two feedings per 24-h period. Water and trace-mineral blocks were available ad libitum.
Pre-testing protocol
On the morning of testing, the horses were brought in from turnout and kept in stalls until the testing was complete. The horses were fed their pre-measured morning treatment rations along with hay and water. Testing began approximately 4 h later at 10.00 h. Pre-exercise blood samples were taken using an 18-gauge needle and two tubes containing lithium heparin (Vacutainer; Becton Dickinson, Parsippany, NJ, USA). These samples were placed in crushed ice for later analysis.
Simulated race test
The horses underwent a simulated race test (SRT) on a treadmill with a fixed 6% inclineReference Ciolino, Lehnhard and McKeever15–Reference Szucsik, Balaskonis and McKeever17. The SRT protocol began with a 2 min warm-up at 4 m s− 1, followed by 2 min at the velocity required to reach VO2max and concluded with a 2-min cool-down at 4 m s− 1Reference Ciolino, Lehnhard and McKeever15–Reference Szucsik, Balaskonis and McKeever17. Blood samples were taken immediately post-exercise and again at 60 and 90 min. All blood samples were stored on ice for analysis later in the dayReference Ciolino, Lehnhard and McKeever15–Reference Szucsik, Balaskonis and McKeever17.
Assays
Two 7 ml blood samples were taken at each measurement interval. One of the tubes from each collection point was centrifuged (Model TJA-6; Beckman-Coulter; Brea, CA, USA) at 1500 × g at 4°C for 10 min. An ion-selective analyser (Synchron ELISE; Beckman) was used to determine the plasma concentrations of tCO2, sodium, potassium and chloride ions. The instrument was calibrated using primary standards, and linearity was confirmed using linearity check solutions (Casco, Portland, ME, USA). In addition, plasma lactate concentration was measured using a lactate analyzer (1500 Sport; Yellow Springs Instrument Company, Yellow Springs, OH, USA). The second 7 ml sample was used to measure the packed cell volume using the microhaematocrit technique and total protein concentration method (mg dl− 1) via refractometry. Plasma strong ion difference (SID) was calculated as followsReference Stewart18, Reference Constable19:

All samples were analysed in duplicate.
Statistical analysis
Data were analysed using ANOVA for repeated measures (Sigmastat Version 1.0). The planned post hoc comparison of means was conducted using the Student–Newman–Keuls method and the appropriate error term. The null hypothesis was rejected when P < 0.05.
Results
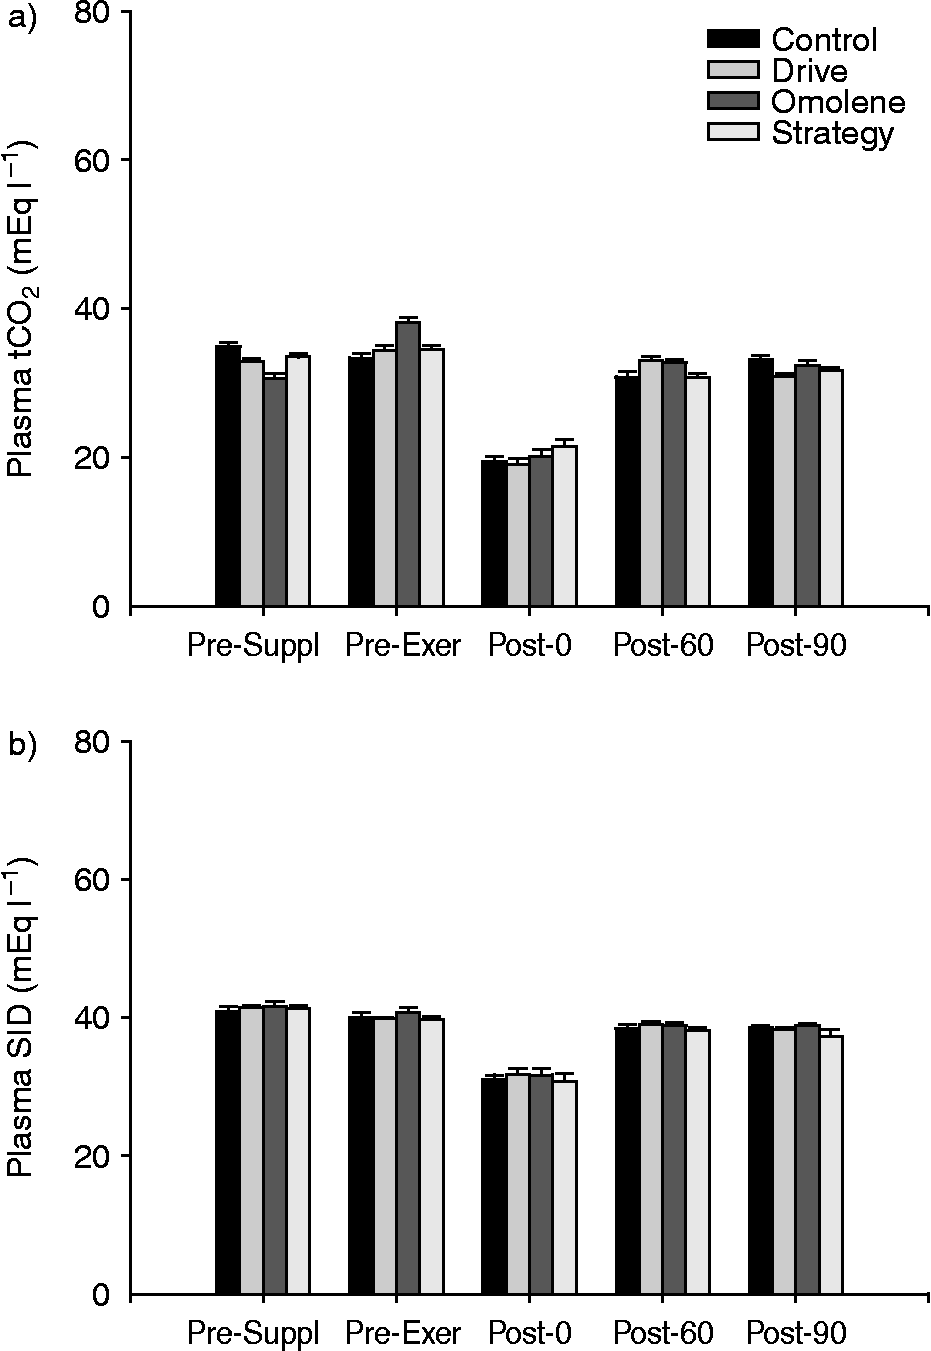
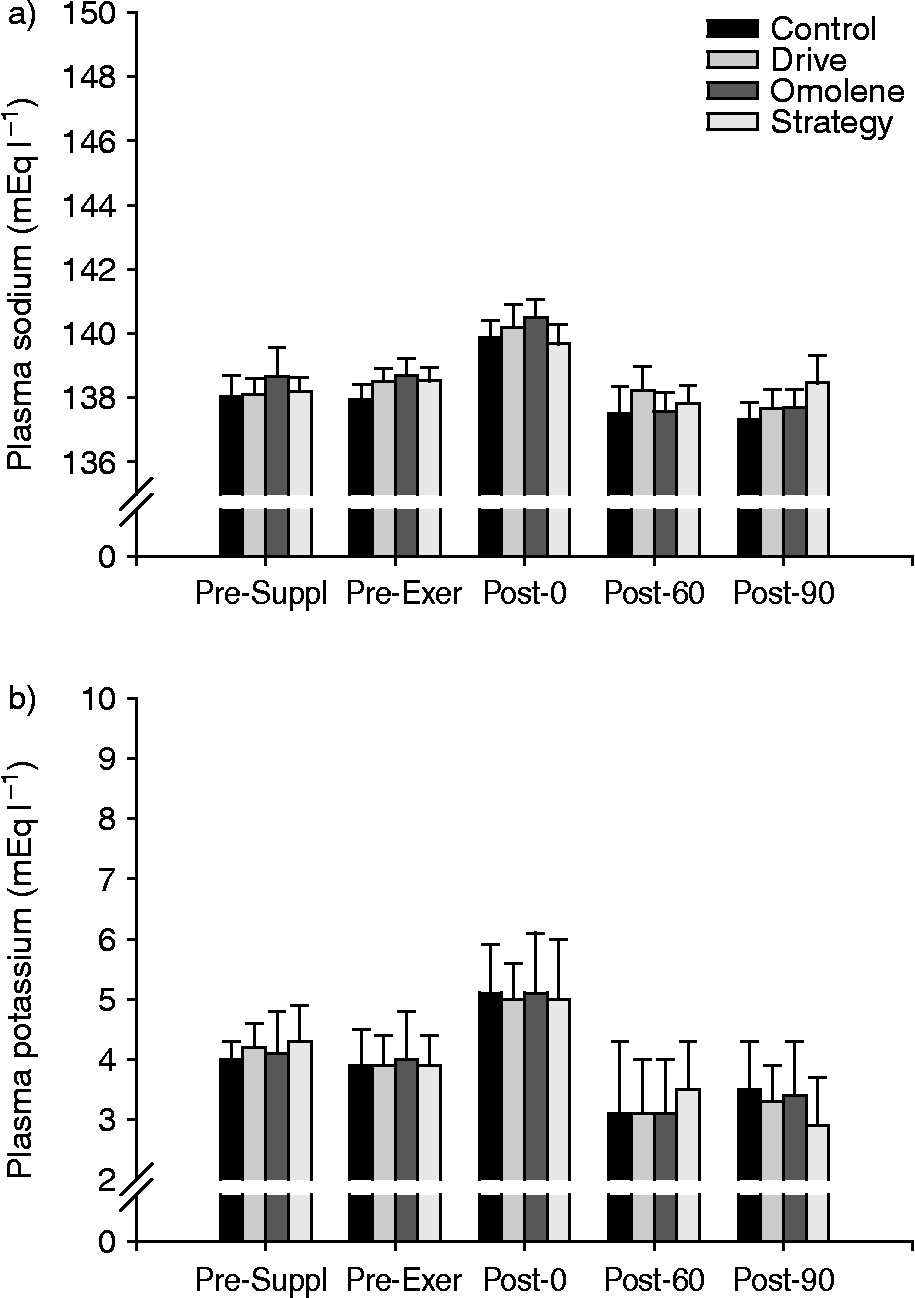
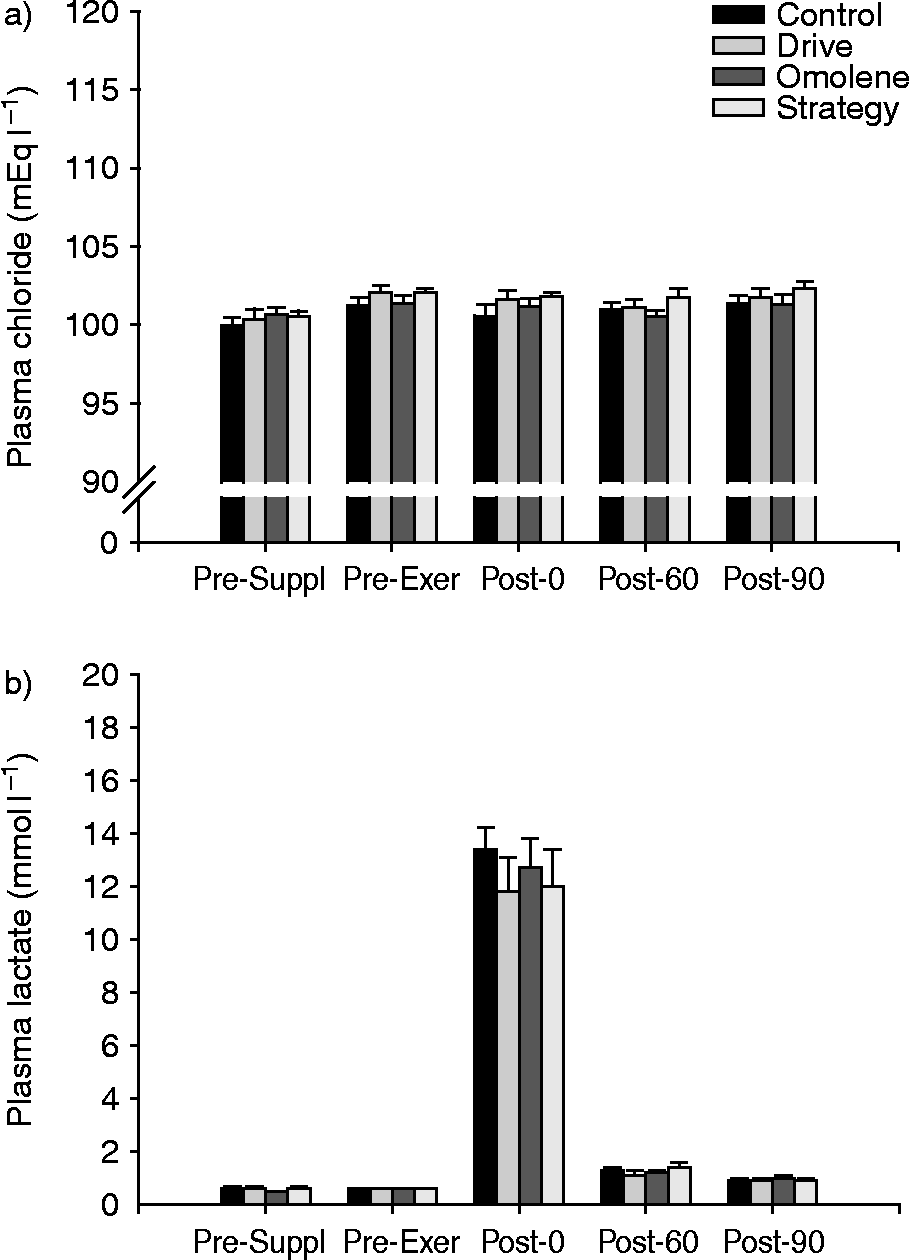
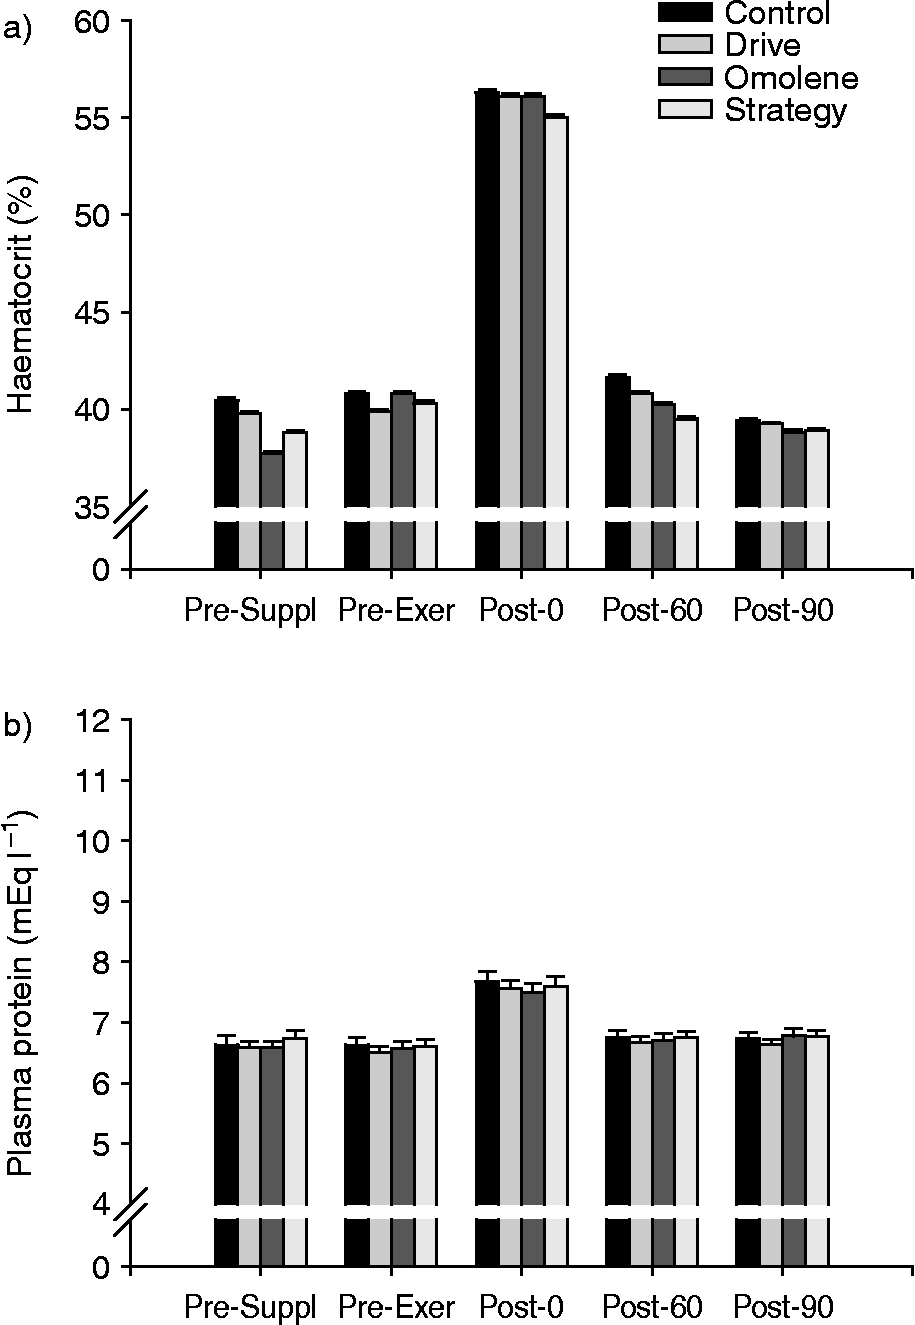
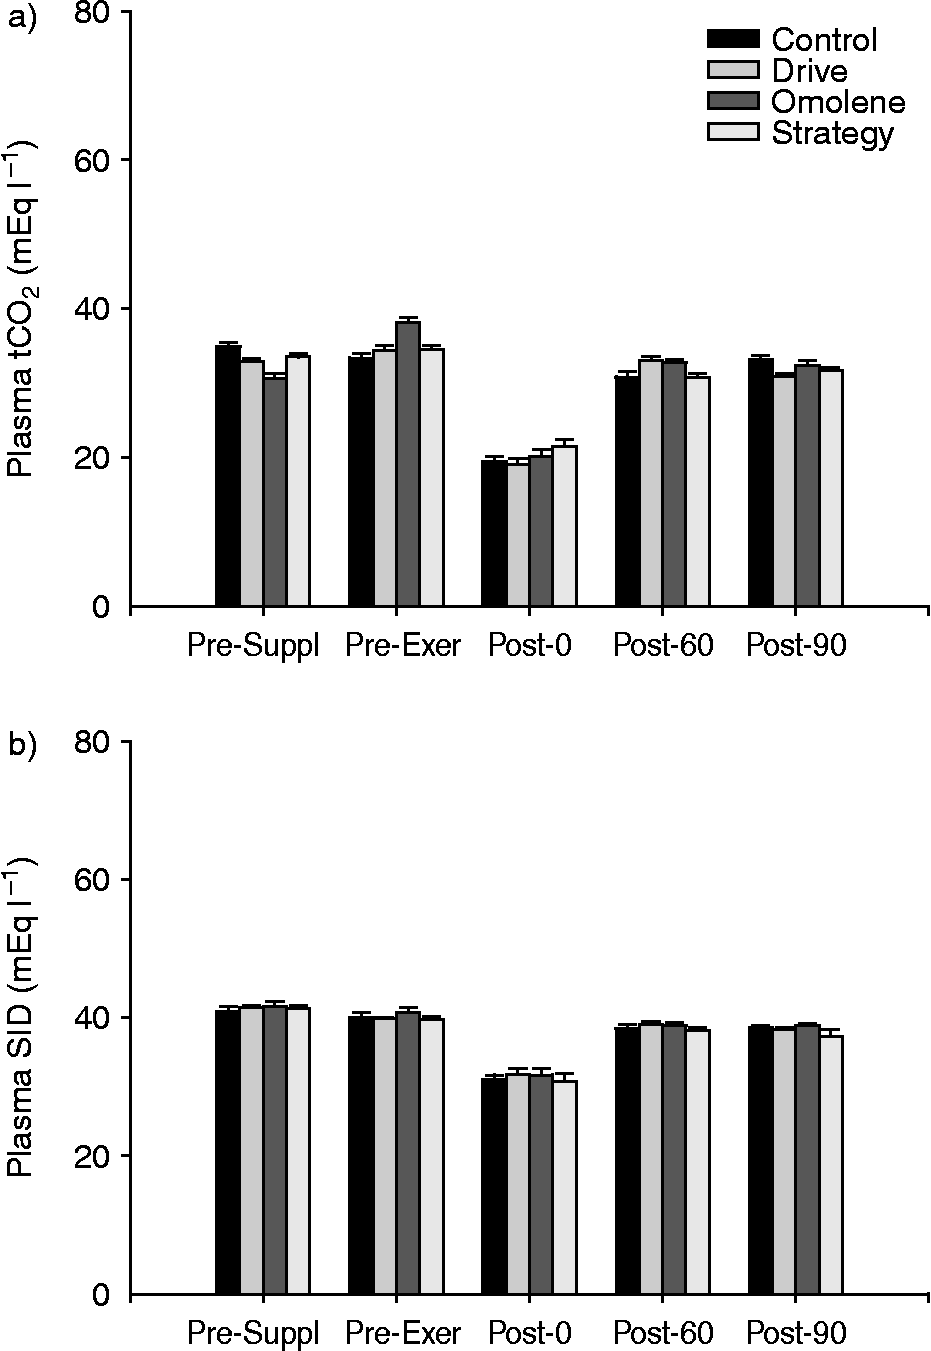
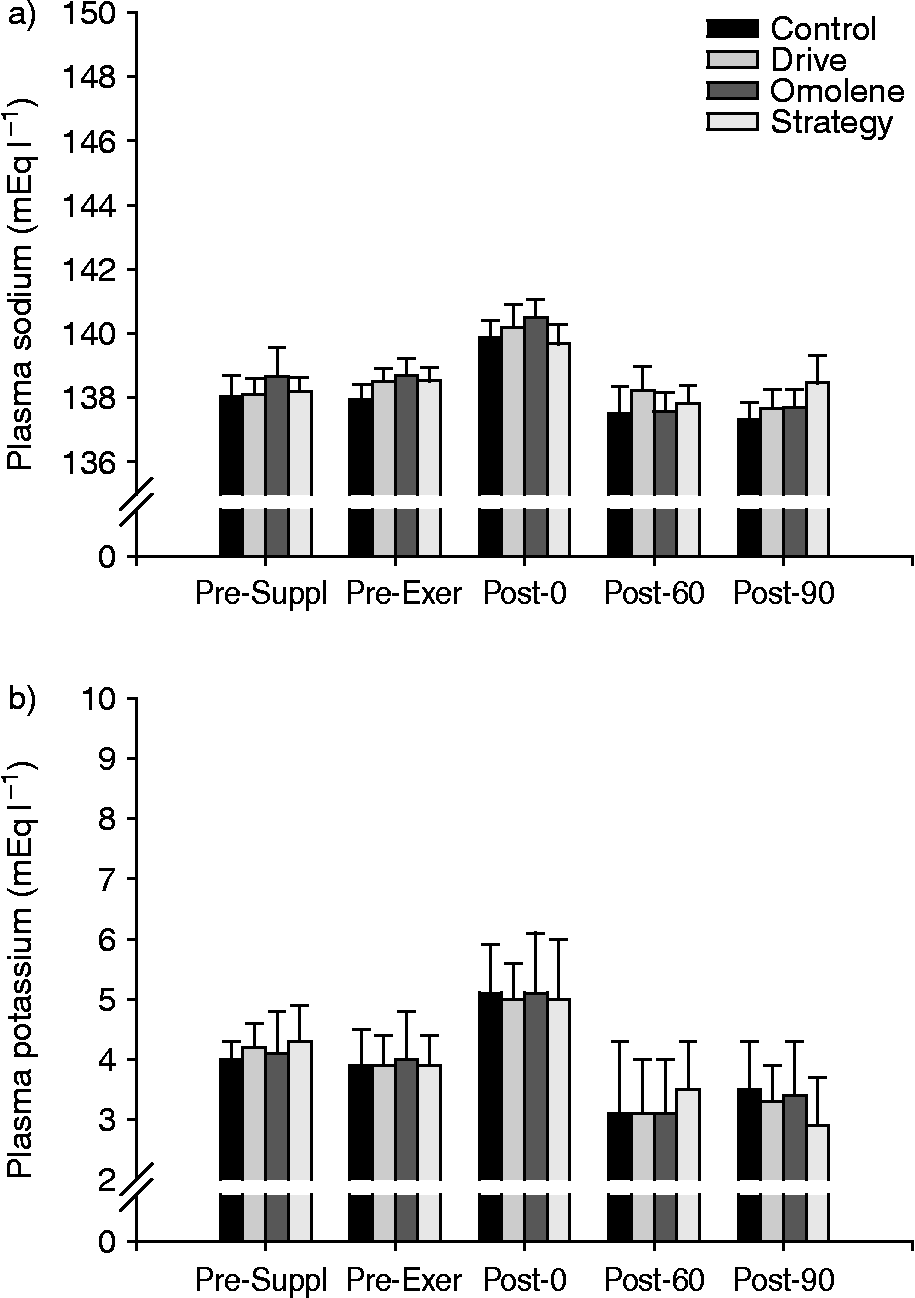
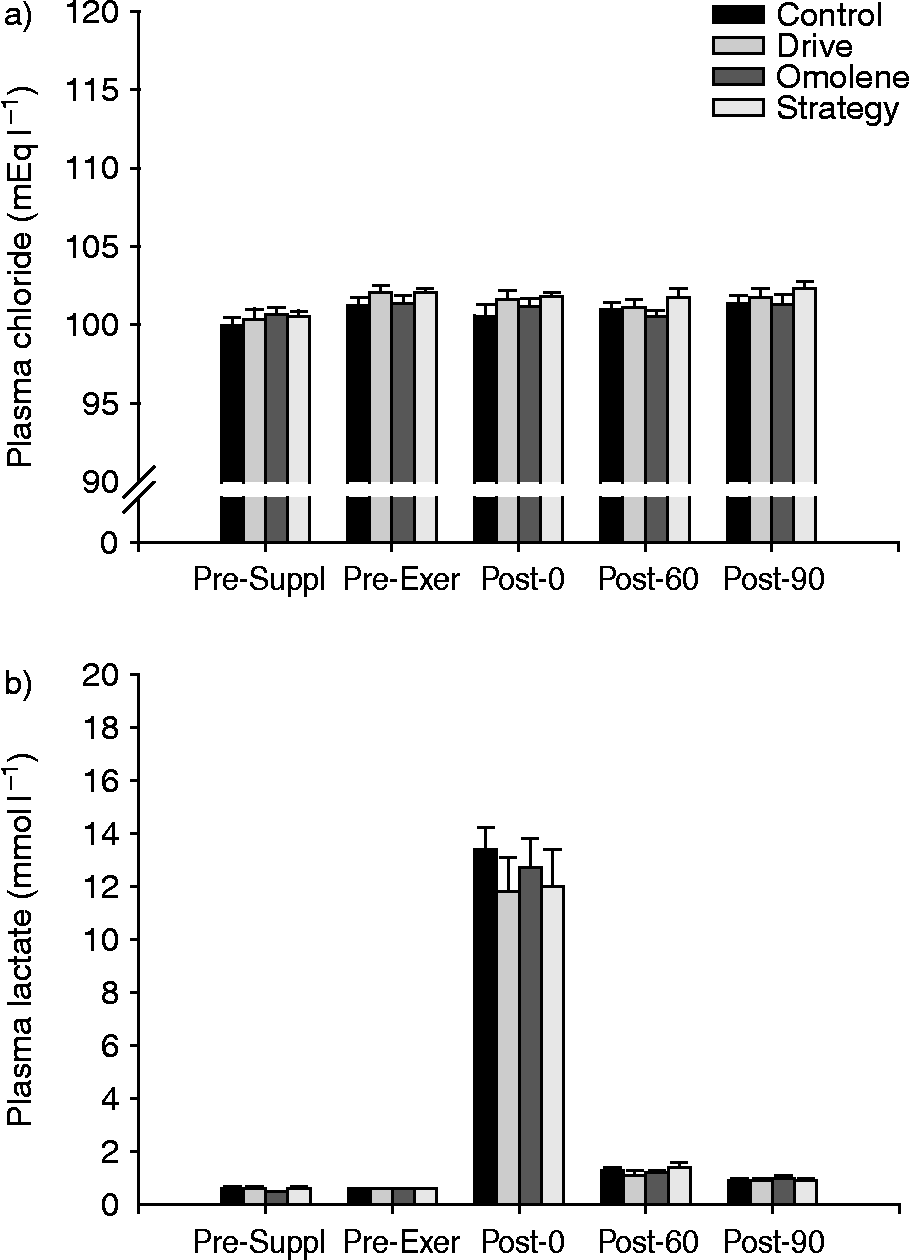
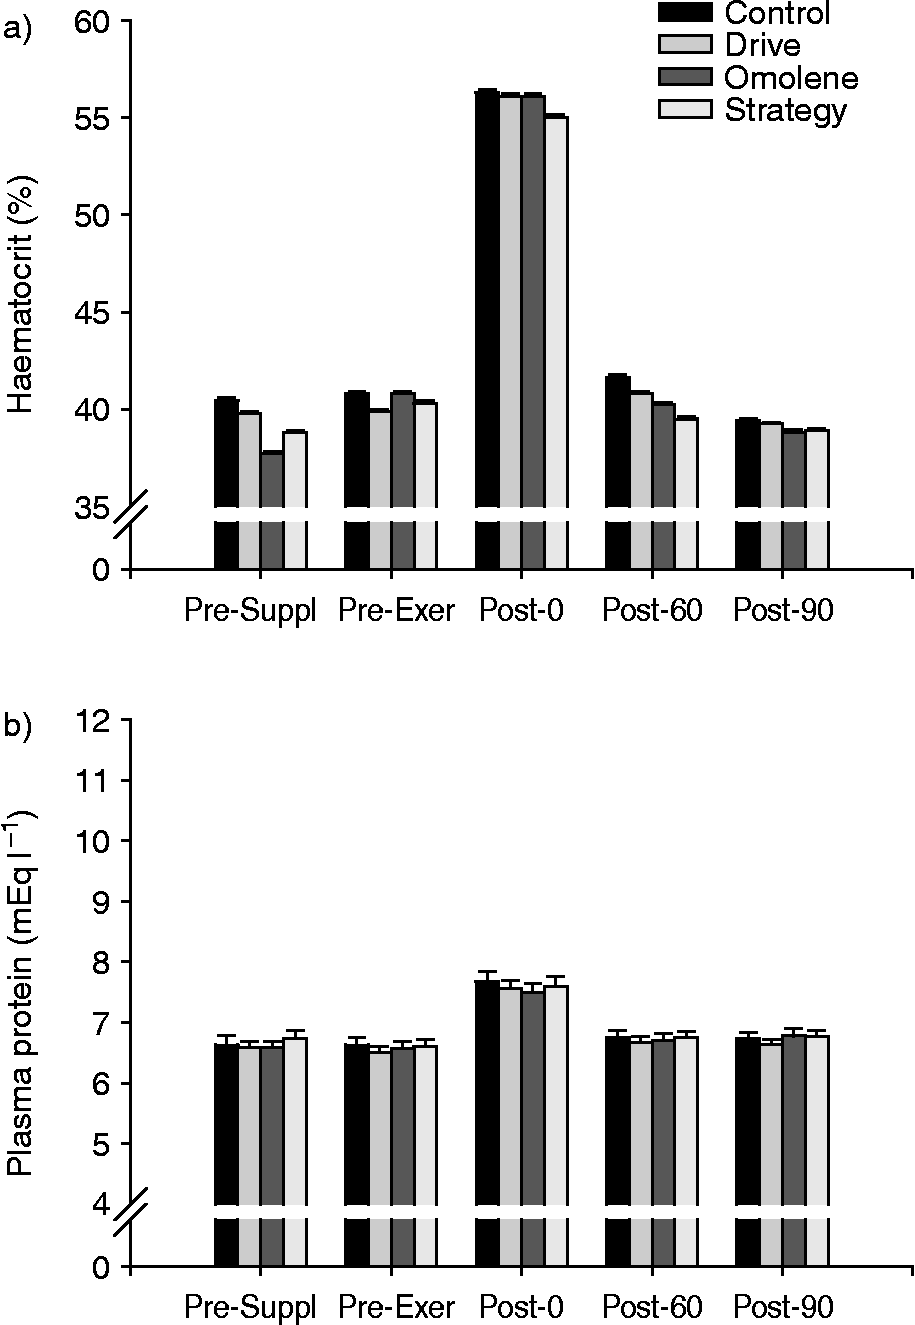
There were no effects (P>0.05) of diet supplement on any of the parameters measured. Plasma tCO2 concentrations were within the normal range before, during and after exercise for all treatments. The increase in plasma tCO2 concentration (Fig. 1a) and SID (Fig. 1b) that occurred during exercise and the corresponding decrease during recovery represented a normal exercise-induced metabolic acidosis. Plasma tCO2 concentrations returned to resting values by the 60-min post-exercise interval. Exercise caused significant (P>0.05) increases in plasma Na+ concentration (Fig. 2a), plasma K+ concentration (Fig. 2b), plasma lactate concentration (Fig. 3b), haematocrit (Fig. 4a) and total plasma protein concentration (Fig. 4b). All these parameters also returned to pre-exercise levels by 60 min of recovery. There were no significant exercise-induced changes in plasma chloride concentration (Fig. 3a).
Mean ± SE plasma total plasma bicarbonate (tCO2) concentration (a) and strong ion difference (b) measured before supplementation (Pre-Suppl), before exercise (Pre-Exer), immediately after the simulated race test (SRT; Post-0), and at 60 and 90 min post-SRT. There were no differences (P>0.05) between dietary treatment groups at any of the five time points. Exercise resulted in decreases (P < 0.05) in plasma tCO2 concentration and strong ion difference immediately post-exercise, with a return to pre-exercise values by 60 min post-exercise (P>0.05). SID, strong ion difference
Mean ± SE plasma sodium concentration (a) and plasma potassium concentration strong ion difference (b) measured before supplementation (Pre-Suppl), before exercise (Pre-Exer), immediately after the simulated race test (SRT; Post-0), and at 60 and 90 min post-SRT. There were no differences (P>0.05) between dietary treatment groups at any of the five time points. Exercise resulted in an increase (P < 0.05) in plasma sodium and potassium concentrations immediately post-exercise, with a return to pre-exercise values by 60 min post-exercise (P>0.05)
Mean ± SE plasma chloride concentration (a) and plasma lactate concentration (b) measured before supplementation (Pre-Suppl), before exercise (Pre-Exer), immediately after the simulated race test (SRT; Post-0), and at 60 and 90 min post-SRT. There were no differences (P>0.05) between dietary treatment groups at any of the five time points. There was no effect of exercise (P>0.05) on plasma chloride concentration; however, exercise resulted in a substantial increase in plasma lactate concentration immediately post-exercise, with a return to pre-exercise values by 60 min post-exercise (P>0.05)
Mean ± SE plasma haematocrit (a) and plasma total protein concentration (b) measured before supplementation (Pre-Suppl), before exercise (Pre-Exer), immediately after the simulated race test (SRT; Post-0), and at 60 and 90 min post-SRT. There were no differences (P>0.05) between dietary treatment groups at any of the five time points. Exercise resulted in an increase (P < 0.05) in haematocrit and plasma total protein concentration immediately post-exercise, with a return to pre-exercise values by 60 min post-exercise (P>0.05)
Discussion
The major finding of the present study was that there was no change in plasma tCO2 concentrations or SID due to any of the four dietary treatments. This is consistent with the observation that at the time of the experiment, the dietary supplements used lacked the ingredients needed to produce elevated tCO2 concentrations. The results are similar to those of other studies that have examined the effects of anti-ulcer medicationsReference Ciolino, Lehnhard and McKeever15, Reference Caltibilota, Milizio, Malone, Kenney and McKeever16 and electrolyte supplementsReference Szucsik, Balaskonis and McKeever17. The observation that there were no differences in plasma tCO2 concentrations measured in the pre-supplement time point suggests that the 7-day period used to adjust the mares to each of the feed supplements was an ample amount of time to allow for complete adjustment to changes in diet. This is consistent with a study which found that the greatest differences in tCO2 concentration in horses fed different diets occurred within 2 days of changing dietsReference Kauffman, Kline, Forman and Lyman13. Thus, 7 days were enough to give the horses' digestive system as well as the natural tCO2 concentrations time to adjust. Some researchers have argued that starch intake can alter blood pH levelsReference Ralston, Puzio and Cuddeford20. However, a study conducted at Oklahoma State University found that there were no significant differences in blood pH between starch sources and starch intakeReference Mueller, Topliff, Freeman, MacAllister, Carter and Cooper14. Therefore, based on the observed lack of difference between groups, we can conclude that the starch content of the feeds used in the present study did not alter the plasma tCO2 concentrations.
Plasma sodium and chloride concentrations remained relatively constant across treatment groups during testing, indicating that the supplements administered had no effect on the electrolyte concentrations before or after exercise. The proportional changes in sodium and chloride concentrations, as well as in plasma protein concentrations, suggest that this was most likely due in part to fluid shifts induced by exercise. Plasma potassium concentrations, however, exhibited a greater proportional increase immediately post-exercise, and then decreased and remained below pre-exercise levels until after the collection of 90-min blood samples. This could have been due to the fact that exercise results in a release of potassium from the contracting muscles, which then increases the amount of potassium found in the plasma and decreases the intracellular content of potassiumReference Carlson21. Following exercise, the potassium in the plasma decreases due to the recovery of intracellular potassiumReference Carlson21.
The haematocrit and total plasma protein readings were normal. The post-exercise haematocrit levels rise due both to the contraction of the spleen, which serves as an erythrocyte reservoir in response to exerciseReference Carlson21, and to exercise-induced decreases in plasma volumeReference McKeever, Hinchcliff, Reed and Robertson22.
In conclusion, the dietary supplements tested in this experiment showed no signs of altering tCO2 concentrations in the ten Standardbred mares that underwent evaluation. Based on this experiment, supplements that do not contain excessive amounts of bicarbonate, citrate or other forms of non-bicarbonate alkalinizing agents should not produce a marked increase in tCO2 concentrations.
Acknowledgements
The authors thank the undergraduates enrolled in the Research Problems in Animal Science as well as the graduate students and equine care staff for their assistance with data collection and the exercise testing, Jennifer McKeever for conducting the lactate measurements and for her help in the preparation of the manuscript, and Philip Lorimer and the NJ State Police Meadowlands Equine Drug Detection Laboratory for technical support. Research support was provided by a grant from the New Jersey State Initiative on Equine and the New Jersey Agricultural Experiment Station. Conflict of interest: None of the authors of this paper has a financial or personal relationship with other people or organizations that could inappropriately influence or bias the content of the paper.