During the last decade, the “big data” revolution has taken the private and public sectors by storm. Increased computing capacity and the spread of computational knowledge generated the expectation that organizations and municipalities use large quantities of data to drive decision making. However, as researchers have identified, the possession of large datasets does not guarantee that scientific evidence for policy making is easily generated due to various challenges. Municipalities may lack the expertise or staffing to analyze the data, or they may have so much data that they suffer “digital exhaust” (Mergel, Rethemeyer, and Isett Reference Mergel, Rethemeyer and Isett2016) and cannot meaningfully use it for decision making. Relatedly, political science and public administration programs face the challenge of training students for success in this environment. We believe that one remedy to both challenges is the adoption of coproduction as a pedagogical strategy. This strategy brings together the analytical abilities of universities with the data and policy knowledge of municipal practitioners in a partnership that helps the city wrangle their data and trains students through real-life policy analysis.
As we demonstrate in this article, intentional applications of coproduction can help municipalities overcome the challenges of big data and scarce resources to improve service delivery. Furthermore, coproduction can be incorporated into political science and public administration programs as a pedagogical tool to empower student learning and enhance the nature of university–municipality partnerships. Incorporating applied coproductive projects into the curriculum increases student engagement, improves student preparedness for contemporary working environments, and provides real-life experience to include in applications and resumés.
Intentional applications of coproduction can help municipalities overcome the challenges of big data and scarce resources to improve service delivery.
This article describes a coproductive project with a municipal emergency communications center. It places our partnership in the context of coproduction, explains our pedagogical strategy, describes our case study, and reports on project feedback. The findings demonstrate an effective method of participative coproduction through academic partnerships with the public sector that is focused on engagement in such a way that may be unique among common forms of campus–community partnerships. We believe our example could be extended and applied to a range of policy-analysis and research-methods settings. Although our project was initiated by the city, other universities could emulate this coproductive example by inviting community proposals and re-creating their own Community Data Partnership (CDP).
BIG DATA AND COPRODUCTION IN CONTEXT
Big data is a prominent topic of conversation across economic sectors, academic disciplines, public service, and private life. Exponential advancements in computing capabilities continually facilitate increases in data collection, management, and analysis capacity. Through basic recordkeeping, many municipalities and government agencies have troves of data that could be used to promote good governance through evidence-based decision making. However, simply because data may be present, identifying and using appropriate data presents myriad challenges and dangers.
Beyond technical know-how and capacities, the volume of data creates what some scholars have called “digital exhaust”—that is, an overwhelming amount of data generated by routine processes that are not designed for analysis (Mergel, Rethemeyer, and Isett Reference Mergel, Rethemeyer and Isett2016). This requires analysts to consider carefully the preferred research questions, examine the data present, supplement the data as needed, clean and in many cases recode the data, and simplify questions when the existing empirical data are not adequate (Lavertu Reference Lavertu2016; Mergel, Rethemeyer, and Isett Reference Mergel, Rethemeyer and Isett2016). Compounding these challenges is the fact that whereas municipalities generate the data, they often lack the equipment, personnel, and resources necessary for analysis. Additionally, as Kitchin (Reference Kitchin2014) highlighted, the analysis of big data can suffer from an epistemological and theoretical unmooring that causes more harm than good without a scientifically responsible approach. Given these challenges, teams whose members have research experience (e.g., university faculty and students) can provide useful analysis through participative coproduction projects.
A widely cited definition of “coproduction” identifies it as the “process through which inputs used to produce a good or service are contributed by individuals who are not ‘in’ the same organization” (Ostrom Reference Ostrom1996). Ostrom (Reference Ostrom1996) described the role of citizens in actively producing goods and services in the context of a “synergy” between government and the governed. Expanding on Ostrom’s conceptualization of coproduction, Alford (Reference Alford2014) noted that the citizens involved in coproduction do not necessarily need to be the consumers of that service. Coincidentally and beneficial for our project, both Ostrom and Alford used case studies with municipal emergency management as demonstrations of coproduction (Alford Reference Alford2014; Ostrom et al. Reference Ostrom, Parks, Whitaker and Percy1978).
Participative coproduction is characterized as distinct from coproduction related to the consumption of service provision (Bovaird Reference Bovaird2007; Brudney and England Reference Brudney and England1983; Osborne and Strokosch Reference Osborne and Strokosch2013). This model of coproduction is motivated to “improve the quality of existing public services through participative mechanisms at the strategic planning and design stage” of the process via “participative planning instruments” (Osborne and Strokosch Reference Osborne and Strokosch2013). This holistic model of coproduction articulated by Osborne and Strokosch (Reference Osborne and Strokosch2013) influenced the general pedagogical approach used by the authors of this article.
We view the coproductive partnership between the city and students as a mechanism for experiential learning. Providing real-life opportunities to apply classroom learning can be beneficial to students and has proven successful in other examples, including teaching public-opinion research (Berry and Robinson Reference Berry and Robinson2012), improving large-class engagement (Forestal and Finch Reference Forestal and Finch2020), and enhancing classroom accessibility (Currin-Percival and Gulahmad Reference Currin-Percival and Gulahmad2020). Through applied data-analysis opportunities, students learn data science beyond the classroom (Williams et al. Reference Williams, Brown, Davis, Pavri and Shafiei2021) through ethically and scientifically responsible approaches to big data (Kitchin Reference Kitchin2014). Coproduction as pedagogy extends the traditional experiential-learning approach by deliberately placing students in discussions with municipal leaders and stakeholders to define the research questions, strategize for data collection, select analytical techniques, and report on recommendations. Our case study provides an example of coproduction as pedagogy in action.
PUBLIC SERVANTS AND UNIVERSITY STUDENTS AS COPRODUCERS
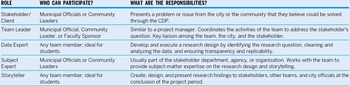
The authors teach at a mid-sized liberal arts college in Tulsa, Oklahoma, a medium-sized city in the American South. The city began a CDP as a way to generate data-driven solutions to issues facing the community.Footnote 1 It also viewed the CDP as a way to improve the technical abilities of its workforce and key community stakeholders. Essentially, the city recognized that it had more questions than answers and as much data as questions, but it lacked the time, resources, and expertise to explore it all. Every year, the CDP issues a public call for a cohort of diverse teams including city employees and unit heads, local businesses, and local professionals and experts. Responding to the solicitation for cohort team members, our students joined as data experts and storytellers, a term the CDP uses to describe those responsible for creating, designing, and presenting the summary report at the conclusion of the project.
As shown in table 1, the team works for a client—typically a city agency or local organization working on community issues. The teams convene client representatives, relevant community partners, and data experts who work together for approximately 10 weeks as part of a research cohort. At the end of the 10 weeks, all teams debrief the cohort, clients, and city leaders with a summary report on their project and provide specific policy or process recommendations.
Roles and Responsibilities of CDP Team Members

The emergency-management leaders operating the communications center believed that they had the data needed to answer many of their questions, but they did not have the expertise or computational power to act. Generally, the center needed assistance examining call volume to inform staffing requests from shift managers while also fulfilling its goal of decreased call wait times. The center had years of individual call data but lacked the computing power to examine more than three months at a time. The center also lacked the scientific research expertise to make the data usable, analyze the data systematically, and merge the data with other theoretically relevant variables from other datasets. Essentially, to improve strategic planning, the city sought to utilize the CDP to obtain exactly this type of assistance. As professors, we believed this scenario was an excellent opportunity to engage students in participatory coproduction.
Working alongside government officials and bureaucrats provides students the opportunity to observe the politics of government and routine government operations. For this project, instructors recruited students from the university’s honors program. Similar to other universities, students with high grade-point averages are invited to enroll in the honors program and have the opportunity to be involved as research assistants or to assist with special projects. At a teaching university like ours, the honors program provides one of the few avenues for students to be involved in research beyond their normal class requirements. In addition, the students in the project had prior research-methods training and had completed at least an introduction to research methods course.
Working alongside government officials and bureaucrats provides students the opportunity to observe the politics of government and routine government operations.
Viewing the CDP through a pedagogical lens, student team members had two goals and five tasks. The project’s two primary goals were: students would (1) apply the knowledge they had developed in policy analysis and research methods classes to real-life scenarios, and (2) develop and practice the social and networking skills needed to work with teams from diverse backgrounds and methodological trainings. Distilling these two goals into concrete actions, students were required to accomplish five tasks during the project: (1) listen to and understand the requests of the stakeholders; (2) create a research design to respond to the requests; (3) collect or request the relevant data to accomplish the stakeholders’ goals; (4) analyze the data using processes that are transparent and replicable for city officials; and (5) create and present a summary report with actionable recommendations for city officials.Footnote 2 Students were free to work on all five tasks or divide them among the team members.
CASE-STUDY OVERVIEW
The research design for the CDP project was crafted by incorporating project objectives and guiding questions from stakeholders at the emergency communications center. The CDP team consisted of the authors, nonprofit professionals, and city employees from the police department and emergency communications center. Primarily, stakeholders at the emergency communications center wanted to know how they could use call-volume data to “optimize resource allocation” and “prioritize work for impact.” The stakeholders and research team developed phases of the research project, each with a specific guiding question or task aligning with the primary objective. The team focused on the following three guiding questions:Footnote 3
-
1. Is there a pattern for day of the week and hour of the day as well as which months of the year have the highest call volume coming into the communications center?
-
2. Using existing guidelines, average call-handling time, and call volume, how many call takers should be assigned to each hour of the day and day of the week for handling calls using National Emergency Number Association standards?
-
3. Does advisory, watch, and warning data from the National Weather Service reveal whether there is a correlation between weather patterns and emergency-call volume?
Based on the decision-making needs of the community and the city stakeholders, the project analysis was mostly descriptive and exploratory. However, this did not preclude the use of statistical and predictive models to assist our stakeholders in determining the best use of public resources. For questions 1 and 2, the team used descriptive analysis to determine average call volumes and to provide an estimate of the minimum number of staff needed at the communications center. For question 3, the team created several ANOVA models of weather watches and warnings to help stakeholders determine which weather events were associated with increased call volume. Notably, the statistical tools used were undergraduate level and could be performed by student team members and other partners. Although some municipal and community team members had advanced statistical training, city employees lacked the time and physical computing power to organize, process, and analyze the data from the emergency communications center.
Data for the project came from two sources. First, call-volume data from the emergency communications center was provided from the city through the CDP. To protect privacy, our dataset consisted of a non-identifiable ID number, date, time, dispatcher actions, and related variables. Available data covered the period from January 2016 to July 2018 and contained 1.8 million usable calls for analysis. Second, data for weather watches and warnings were sourced from the Iowa State University MESONET archive of National Weather Service weather events.Footnote 4 A total of 189 weather events were recorded in our area during the data range of our call-volume data.
Participatory coproduction was evident in the data-collection process. The city provided access to a unique data source that the authors could not have acquired without the CDP. Meanwhile, the authors and student researchers were able to connect the city and CDP stakeholders with the Iowa State MESONET severe weather dataset. The CDP stakeholders were unaware of the existence of this dataset and were using more time-intensive methods to compile weather data. After the data were collected, the team created descriptive analysis of call patterns and predictive analysis using the weather data as requested by the stakeholders.
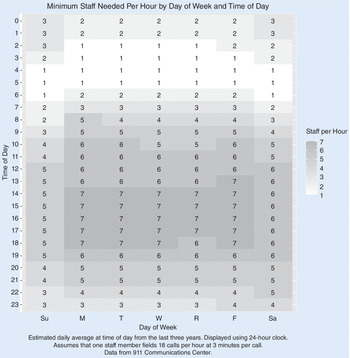
The primary objective of this research was to help the emergency communications center allocate its resources to maximize its impact. The most important resources at the emergency communications center are the staff and call takers. Questions 1 and 2 focus on increasing efficiency through optimizing the staffing levels by daily call volume and seasonal fluctuations. In essence, on an average day, how many call takers are needed? Do seasonal variations in call volume make certain times of the year better for training and onboarding new call takers? To answer questions 1 and 2, the team determined the average call volume by hour, by day, and by month and then displayed results using several heat map infographics, as shown in figure 1. The heat maps were embedded into a short set of slides used during a 15-minute presentation to city leaders and other cohort members as the final project deliverable. Several stakeholders on our team suggested that the heat maps were the most intuitive way to understand the data and then convey the findings to colleagues and superiors.
Example of a Project Deliverable
Heat map displays the minimum number of staff needed by the emergency communications center.

FEEDBACK AND APPLICATION
The project benefited the stakeholders and student team members in several ways. First, stakeholders were able to use the team analysis to inform their budget request for new hires and training for the upcoming year because they had a better understanding of how many staff were needed to operate the communications center at ideal levels. Second, the stakeholders were able to use the project findings to help with the hiring and training cycle because the analysis showed them which months were less busy and better for staff onboarding. Third, student team members found the coproductive project useful because they were able to participate in a direct application of their classroom knowledge. Being part of the research-design phase and being a storyteller on the project helped students to understand which types of questions to ask when conducting applied policy analysis. It also honed their presentation skills and boosted their confidence as a data communicator. One of our students partnered with a professional public speaker from a local nonprofit organization as the project’s lead storytellers. This experience helped the student to develop skills in communicating complex information to municipal officials in a way that would provide actionable information.
Being part of the research-design phase and being a storyteller on the project helped students to understand which types of questions to ask when conducting applied policy analysis.
Not only did this experience prove valuable for students, it also was perceived as immensely valuable by the stakeholders. The data from the presentation were used as objective evidence and justification for city budget requests. The mayor’s office gave the analysis team an award, recognizing its contribution to the city, and the presentation was requested to be given to a city council subcommittee. At the meeting, a council member noted that this type of participative coproduction was worth tens of thousands of dollars to the city related to the knowledge generated and consulting-fee savings.
This feedback revealed the value of this type of experiential learning for students and an issue that faculty will need to consider. The student team gained applied experience and a great addition to their resumé. However, the students essentially were working for free. As the discipline reconsiders the practice of internships and increasingly prioritizes paid internships, faculty may want to explore ways to compensate students beyond course credit for their time and effort on projects such as our case study.
Whereas this case study focuses on one particular instance, we believe this assignment can be replicated in other contexts. Any program that offers a capstone course or applied research methods course could substitute a coproductive project for the course deliverable. As demonstrated in our case study, the students were responsible for all elements of the research design, execution, and final presentation, which could be evaluated or graded using different approaches. The flexibility of our example allows the assignment to be scaled to various contexts. Our case study took place over 10 weeks and the conclusion of the project aligned with the end of the semester. In the weeks before the project began, students worked on Institutional Review Board training to be prepared for the ethical handling of data. We also reviewed data analysis and data visualization approaches from previous research methods courses.
This assignment could appear differently in every context; however, faculty interested in replicating the assignment could connect with data managers at various levels. Whereas our city issued a solicitation for a CDP, coproductive opportunities can be created and fostered in several ways. Regular university community outreach can create informal connections to learn about new opportunities. Faculty also could seek out data managers and directors who are increasingly common for county, municipal, and even school boards. Finally, faculty could turn toward specialized initiatives such as the National Neighborhood Indicators Partnership (www.neighborhoodindicators.org) and similar organizations. Our case study focused on emergency management, but other cohorts explored topics including the effect of local disasters on school-age students, existing usage of and public sentiment about bicycle lanes, reducing eviction by monitoring utilities cutoffs, and even prioritizing entrepreneurship initiatives to jump-start local businesses. Potential coproductive partners include municipal data managers, parks and recreation boards, school districts and boards, community-development organizations, and local young professional and entrepreneurship programs.
This case study is an example of how coproduction as pedagogy benefits municipalities and students. State and local bureaucracies create and manage a tremendous amount of data from their citizens and constituents. However, they may lack the resources to wrangle these data to produce actionable analysis. The result is an opportunity for local university researchers and students to engage in coproduction as pedagogy.
First, using a participatory coproduction model, universities can be a resource for local bureaucracies by improving data analysis and helping municipalities solve real-time data dilemmas. Second, using coproduction as pedagogy, professors can help students apply classroom knowledge and gain valuable experience in a real-life setting. By working alongside municipal and community leaders to design, conduct, and present research, students empower municipalities to make data-driven decisions using the big data that communities create.
ACKNOWLEDGMENT
The authors are grateful for the work of Daryl Herzmann at the Iowa State University MESONET and his patient explanations of National Weather Service Valid Time Event Codes.
SUPPLEMENTARY MATERIALS
To view supplementary material for this article, please visit http://dx.doi.org/10.1017/S1049096521001074.