Implications
This paper provides genetic parameters for early lactation and secretion rate traits. These parameters help to design selection programmes that are more responsive to modern concerns. Using models of milk production, which break the lactation curve down into its biological components, could make it easier to select for lactations that have a lower peak but are more persistent. This may not only put less pressure on dairy cows during early lactation, making them healthier, but may help improve fertility. Also, using this approach is inherently more informative about the biology of the cow and easier to implement compared to the random regression approach.
Introduction
There has been recent interest in models of lactation that mimic the biology of the dairy animal (Dijkstra et al., Reference Dijkstra, France, Dhanoa, Maas, Hanigan, Rook and Beever1997; Pollott, Reference Pollott2000 and Reference Pollott2004). These models are based on the idea that the lactation curve has an underlying biological reason for its various characteristics and that this biology could be used as the basis for its analysis. This may be inherently more satisfying to the animal production specialist and may reveal something useful about the biology of the animal. The more commonly used alternative approach is to use an empirical mathematical model that may fit the data well but is often uninformative about the biology of the animal.
Pollott (Reference Pollott2000) proposed a biological model which was shown to have a lower residual mean square when compared to several other biological and commonly used empirical models when fitted to sheep and cattle lactations (Pollott, Reference Pollott2000; Pollott and Gootwine, Reference Pollott and Gootwine2000). This model comprised three different parts corresponding to the growth of differentiated mammary cells, their reduction through apoptosis and the secretion rate per cell. Vetharaniam et al. (Reference Vetharaniam, Davis, Soboleva, Shorten and Wake2003) showed how the differentiation may be viewed in two parts, active and quiescent secretory cells. Pollott and Gootwine (Reference Pollott and Gootwine2000) demonstrated how the original seven-parameter model may be simplified for use in practice. Pollott (Reference Pollott2004) described how this biological model of lactation could also be applied to fat, protein, lactose and water, the four major constituents of milk, production throughout lactation and developed ideas to describe their secretion rate per cell. Albarrán-Portillo and Pollott (Reference Albarrán-Portillo and Pollott2008) applied a reduced version of the model to 431 commercial UK dairy herds and reported the genetic parameters of the lactation curve characteristics and the calculated values derived from them. They also discussed the limitations of using the biological model with commercial records, in particular the difficulty of fitting the biological model to early lactation records and the lack of parameters derived from this part of the lactation curve. This paper investigates the genetics of lactation using the parameters of the biological model of lactation and various values calculated from it (Pollott, Reference Pollott2000) using a model and dataset which allows study of early lactation parameters and cell secretion rates of the major milk components.
Material and methods
Descriptors of lactation
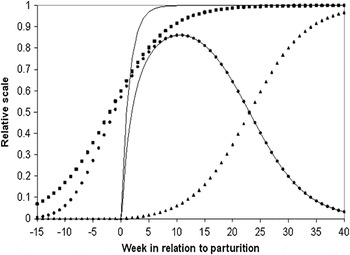
This research uses a biological model of lactation to investigate dairy cow genetics with the methodology described by Pollott (Reference Pollott2000 and Reference Pollott2004). Milk yield throughout lactation is ultimately determined by three largely independent processes: mammary cell proliferation and differentiation, programmed cell death (apoptosis) and secretion rate per cell. The biological model of lactation proposed by Pollott (Reference Pollott2000) is based on three mathematical functions which mimic these three processes (Figure 1). The basic multiplicative model of lactation comprises a term describing the number of differentiated parenchyma cells (NDPC), a term tracking the proportional reduction in cell numbers as lactation progresses (PR) and a term representing the daily change in milk secretion rate per cell during lactation (S M). The full multiplicative model (Pollott, Reference Pollott2000; appendix) is:
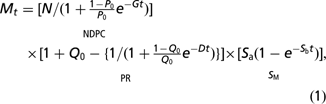
where Mt is milk production in kg/day on day t of lactation, N = total number of parenchyma cells which become active during lactation, P 0 = proportion of N present at the start of lactation, G = the relative growth rate in active cell numbers (G > 0), Q 0 = proportion of N dead at start of lactation, D = the relative death rate of cells (D > 0), S a = the maximum secretion rate of milk from the average cell (kg/cell per day), S b = the relative rate of change in milk secretion rate (S b > 0).
A schematic diagram of the three basic curves represented by the biological model of lactation; the number of differentiated parenchyma cells (▪), cell milk secretion rate (_), unity minus the proportion of cells remaining alive (▴), milk yield (-) and the number of active cells (●).

This form of the model sets the rate of apoptosis at parturition to zero by subtracting Q 0 from the apoptosis term, PR (Pollott, Reference Pollott2000). This is an empirical modification to the original model which may be abandoned when levels of apoptosis throughout lactation are better characterised or when cell number changes in early lactation can be measured.
Pollott (Reference Pollott2000) and Pollott and Gootwine (Reference Pollott and Gootwine2000) discussed simplified versions of this model for use under the more common farm conditions of monthly test-day records or where lactation records are terminated long before the natural end of lactation. Albarrán-Portillo and Pollott (Reference Albarrán-Portillo and Pollott2008) showed how this worked in practice in commercial dairy herds. In this analysis a simplified form of the model was used:

where the maximum secretion potential, MS = N × S a, but because most of the change in S M takes place in the first few days of lactation (Pollott, Reference Pollott2000) it is effectively N × S M. This form of the model recognises that currently there is no available method for separating the number of differentiated parenchyma cells from their secretion rate; hence, the combination of S a and NDPC in equation
(2). The form of PR in equation
(2)is a simplified version of the full logistic curve used in equation (1), which only models the first half of this curve. This recognises that cows are generally dried off long before they reach the end of their natural lactation. The result of these two modifications is a four-parameter model, rather than the seven parameters of equation (1), which is a more practical model to compute.
Several characteristics of lactation can be calculated from the fitted lactation curve parameters. The peak yield (PY) and day of peak yield (DP) can be located at the maximum of the overall curve. The daily increase in milk yield midway between the peak and start of lactation (GM) and the daily decrease in lactation midway between the peak and the end of lactation (DM) can be calculated. The latter term, DM, is a measure of persistency of lactation. The calculated total milk yield of the lactation (CTMY) can be derived from the area under the curve. Pollott (Reference Pollott2000) has detailed how to calculate these values from the biological model of lactation.
An extension of the biological model of lactation to describe milk component production throughout lactation was given by Pollott (Reference Pollott2004). In this approach, the secretion of milk in kg/cell per day, S M in equation (1), was replaced with a term to describe the secretion rate of the milk components fat (S F), protein (S P), lactose (S L) and water (S W) or the total solids (S T), also in kg/cell per day. Alternatively S M in equation (1) could be multiplied by, for example, fat proportion (FP), from the test-day milk sample, to give the same value of S F. The milk component lactation curve parameters can be used to calculate the total fat yield throughout lactation and similar calculations can be made using the other milk components.
The secretion rate variables (S M, S F, etc), as described above, relate to the whole udder, since it is not possible yet to separate the number of cells from milk secretion rate. In this analysis, the value of N = 2.8 × 10¹⁰ was used to calculate all the secretion rate variables for all lactations, after Vetharaniam et al. (Reference Vetharaniam, Davis, Soboleva, Shorten and Wake2003). Clearly this is a simplification since N is expected to vary between lactations but the use of this estimate does make the secretion rate traits have more ‘realistic’ values.
Dataset
The data used in this study were derived from a single herd of Holstein-Friesian cows maintained by Genus Ltd at their Bays Leap Farm, Northumberland, UK. Previous descriptions of the herd have been reported by Strathie and McGuirk (Reference Strathie and McGuirk1995) and Olori et al. (Reference Olori, Brotherstone, Hill and McGuirk1997, Reference Olori, Brotherstone, Hill and McGuirk1999a and Reference Olori, Hill, McGuirk and Brotherstone1999b). Briefly the cows were part of a multiple ovulation and embryo transfer herd. Establishment and management of the herd were described by Strathie and McGuirk (Reference Strathie and McGuirk1995). Cows were housed indoors throughout the year and milked three times per day. The cows were fed a total mixed ration all year round. Milk production from individual cows was recorded at each milking and weekly test-day yields were recorded along with percentages of fat, protein and lactose.
The dataset analysed in this study has previously been described by Olori et al. (Reference Olori, Brotherstone, Hill and McGuirk1997, Reference Olori, Brotherstone, Hill and McGuirk1999a and Reference Olori, Hill, McGuirk and Brotherstone1999b) and Pollott (Reference Pollott2004). Weekly records comprising milk yield (kg) and proportions of fat, protein and lactose in test-day milk samples were used. Weights (kg) of fat (Ft), protein (Pt) and lactose (Lt) produced per day were calculated using the appropriate proportion value and test-day milk yield. Total solids (Tt) were calculated as the sum of the three component weights (fat + protein + lactose). The weight of water (Wt) produced daily was calculated as milk weight minus total solids, and the proportion of water as 1 − ∑(fat, protein and lactose proportions). Thus, water estimates included the small amount of ash, minerals and vitamins produced in milk.
Records were available from 488 heifers calving between July 1990 and December 1994. Apart from the test-day data described earlier, information was available on age at first calving, pregnancy status, date of conception and calving date. Month of calving and month of production were grouped into 2-month periods for use in the analysis, resulting in 6 groups per calendar year. Lactations from 461 heifers were used in the analyses described here. These were selected from the original 488 available lactations on the criterion that they had more than 15 test-day records in the lactation after removal of any test-day milk yield that was more than 2 s.d. from the previous record. Data were adjusted for the stage of pregnancy and month of production as described by Pollott (Reference Pollott2004).
Curve fitting
Equation (2) was fitted to the weekly test-day milk yield data for each of the 461 lactations selected as described above. In analyses using the biological model of lactation, the week of lactation was used as the time variable (t in equations (1) and (2)). An iterative least-squares curve fitting procedure (NLIN in SAS; SAS, 1989) was used employing the Marquardt computational strategy to find the best-fit solution. This was found when there was a <10−6 difference between the error sums of squares in successive iterations. This resulted in four parameters (MS, P 0, G, D) being derived for each lactation curve. These parameters were used to calculate total milk yield until day 305, PY, DP, persistency and the rate of GM, as described by Pollott (Reference Pollott2000). Similar analyses were carried out using test-day fat, protein, lactose, water and total solid weights and total 305-day yield was calculated from the resulting parameters.
An alternative set of calculations was carried out for the composition traits. Secretion rate on all test days was calculated as FP × S M for fat (Pollott, Reference Pollott2004). This was repeated for each component to give a set of five secretion rate values for each week, which had a test-day record, of every lactation.
Analyses
Genetic analyses were carried out for the lactation curve parameters, calculated values and total lactation yield traits derived from applying equation (2) to the 461 individual lactations for milk and each of the component traits. Equation
(3)was fitted to these traits using an animal model in ASREML (Gilmour et al., Reference Gilmour, Gogel, Cullis, Welham and Thompson2002). The pedigree file consisted of three generations in total.

where Yijk was the trait being analysed, a the ith age at calving in months, m the jth month of calving of cow cijk with a residual of eijk. Both cow and the residual were fitted as random terms and a variance component estimated for each. The heritability of each trait was calculated as the ratio of the animal variance to total phenotypic variance, after adjustment for the fixed effects, and the standard error of the heritability was calculated as described by Gilmour et al. (Reference Gilmour, Gogel, Cullis, Welham and Thompson2002). Genetic and phenotypic correlations were calculated for each pair of traits using a model containing the significant effects derived from the heritability analyses. All correlations were calculated using ASREML and their standard errors estimated as described by Gilmour et al. (Reference Gilmour, Gogel, Cullis, Welham and Thompson2002).
A further model was used to analyse the secretion rates of the milk component traits derived from (FP × S M)/(2.8 × 1010), the secretion rate per cell, using the standard value for N derived from Vetharaniam et al. (Reference Vetharaniam, Davis, Soboleva, Shorten and Wake2003). This model was:

where the terms were as described for equation (3) plus the effect of the kth week of lactation, the lth month of production, mth lactation and Yijklmn, the weekly test-day component secretion rate. Using this model the phenotypic variance was calculated as the sum of the animal, residual and lactation components of variance, since these three were fitted as random terms in the model. Heritability and its standard error were calculated as described above. The within-lactation intraclass correlation, a type of repeatability, was calculated as the ratio of the lactation variance component to the phenotypic variance and the standard error computed as described by Gilmour et al. (Reference Gilmour, Gogel, Cullis, Welham and Thompson2002).
Genetic correlations were estimated between the lactation curve parameters and calculated values with the secretion rate traits. The appropriate models from the univariate animal model analyses for each trait were used in a series of bivariate analyses, using the methodology described above.
Results
Milk lactation curve parameters and calculated values
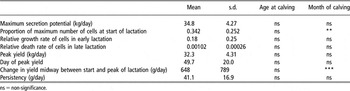
The parameters and calculated values derived from fitting equation (2) to the weekly test-day milk yields of 461 lactations are summarised in Table 1. The fixed effect ANOVA summary from fitting equation (3) to the data is also included in Table 1. On average the peak milk yield of 32.3 kg was reached on day 49 of lactation. Milk yield was increasing at 648 g/day midway between the start of the lactation and its peak and decreased at 41.1 g/day mid-way between the peak and end of lactation (day 305). In terms of the underlying biology of the lactations, 0.342 of the maximum number of active cells were present at the start of lactation; they increased at a relative growth rate of 0.18 in early lactation and declined at a relative rate of 0.00102 in late lactation. The MS of the lactations was 34.8 kg, representing the product of the maximum number of cells and the secretion rate per cell. Early lactation parameters and calculated values (P 0, G, DP and GM) were much more variable than later lactation characteristics (D, DM).
Mean, standard deviation and ANOVA summary of lactation curve parameters and calculated values for milk from fitting the four-parameter biological model of lactation to 461 heifer lactations

ns = non-significance.
Age at calving had no effect on the lactation curve parameters and calculated values. Month of calving affected the proportion of cells active at the start of lactation and the increase in milk yield mid-way between the start and peak of lactation.
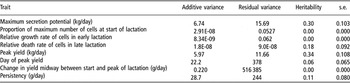
The results of analysing the lactation curve parameters and calculated values with an animal model to derive heritabilities are shown in Table 2. Early lactation variables (P 0, G, GM) showed very little genetic variation and so were completely determined by environmental factors. DP had a low heritability, but was probably little different from zero. PY and MS had similar moderate values of heritability, whilst persistency (DM) and relative cell death rate (D) had low heritability values.
Additive and residual variances, heritabilities and standard errors of the milk lactation curve traits and calculated values derived from fitting the four-parameter biological model of lactation to 461 heifer lactation curves

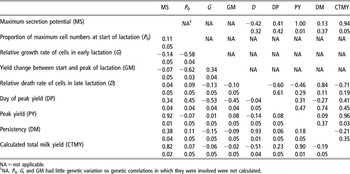
The phenotypic and genetic correlations between the nine curve parameters and calculated values are shown in Table 3. MS and the PY were highly correlated and were effectively controlled by the same genes. They also had similar correlations with the other traits. MS/PY were also highly correlated with CTMY indicating that the genes that determined MS/PY were largely also responsible for complete lactation yield. These two traits were also moderately correlated with both day of peak and the relative death rate of cells in late lactation, although the standard errors of these latter two correlations were high. The relative death rate of cells in late lactation was highly correlated with both persistency and total milk yield, animals with a lower rate of cell death having higher lactation yields. Interestingly, persistency had a lower genetic correlation with CTMY than D.
Genetic (above diagonal) and phenotypic correlations between curve parameters and calculated values (s.e. shown below each correlation)

NA = not applicable.
1NA. P 0, G, and GM had little genetic variation so genetic correlations in which they were involved were not calculated.
The phenotypic correlations shown in Table 3 had similar relationships to their equivalent genetic correlations. The three early lactation characteristics were all highly phenotypically correlated with each other. The late lactation characteristics were also highly correlated with each other but not with any other trait except CTMY.
Calculated total 305-day milk and composition yields
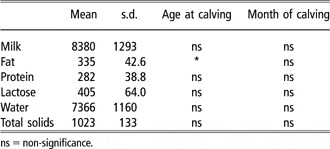
The means and standard deviations of the six calculated 305-day yield traits derived from the curve parameters calculated from fitting equation (3) to six test-day yield datasets are shown in Table 4. A summary of the fixed effects fitted in the genetic analyses, are also shown in Table 4. The only effect of significance was the effect of age at calving on fat 305-day yield. Inspection of the least-squares means derived from this analysis (not shown) showed that older animals at first calving had higher fat yields. All six traits had a coefficient of variance of between 0.12 and 0.16.
Mean, standard deviation and ANOVA summary for calculated total 305-day yields for milk and milk components from fitting the four-parameter biological model of lactation to 461 lactations (kg)

ns = non-significance.
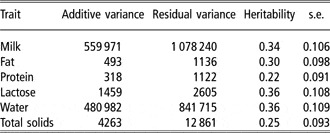
The heritabilities of the six 305-day yield traits are shown in Table 5. Milk, lactose and water 305-day yield had similar heritabilities, with fat having a slightly lower value. Protein yield had the lowest heritability (0.22 ± 0.091) with total solids yield being intermediate between protein and the other components of milk solids as expected.
Additive and residual variances, heritabilities and standard errors of the calculated total 305-day yield traits derived from fitting the four-parameter biological model of lactation to 461 lactations (kg)

The six yield traits were all highly correlated with genetic correlations ranging from 0.58 ± 0.16 to 0.99 ± 0.001 and phenotypic correlations from 0.72 ± 0.03 to 0.99 ± 0.003. Fat yield had the lowest correlations with all traits (genetic 0.58 to 0.83; phenotypic 0.72 to 0.87), the others having values above 0.91 (genetic) and 0.92 (phenotypic) with each other.
Secretion rates
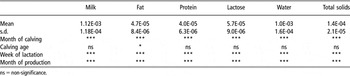
Secretion rate values, S M, S F, S P, S L, S W and S T, at the weekly test days were computed, as described above, assuming a value for N of 2.8 × 10¹⁰ (Vetharaniam et al., Reference Vetharaniam, Davis, Soboleva, Shorten and Wake2003). They were analysed using an animal model and the fixed effects of month of calving, age at calving, week of lactation and month of production were included in the model as fixed effects. In addition, to take account of the repeated measurements on each cow, a random term for cows was also fitted. The results are summarised in Tables 6 and 7. Month of calving, week of lactation and month of production significantly affected all six traits (P < 0.001). Calving age only affected fat secretion rate (P < 0.05).
Mean, standard deviation and ANOVA summary for secretion rates of milk and milk components from fitting the four-parameter biological model of lactation to 461 lactations (kg/cell per day)

ns = non-significance.
Additive, permanent environmental and residual variances, heritabilities, repeatabilities and their standard errors of the secretion rate traits (kg/cell per day)

All secretion rate traits had similar heritabilities and repeatabilities, with the exception of the repeatability of fat secretion rate, which was somewhat lower than the others.
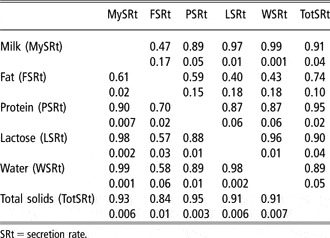
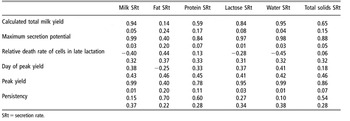
The genetic and phenotypic correlations between the six secretion rate traits are shown in Table 8. Most of the secretion rate traits were very highly correlated. The main exception was fat secretion rate, which was only moderately correlated with most other traits.
The genetic (above diagonal) and phenotypic correlations between the six secretion rate traits (standard errors shown under each correlation)

SRt = secretion rate.
The genetic correlations between the secretion rate traits and the curve parameters plus calculated values are shown in Table 9. Milk, lactose and water had similar correlations with the curve/calculated value traits. They were all highly correlated with CTMY, MS and PY and moderately correlated with D and DP. They had no genetic link with persistency. Protein secretion rate was also highly correlated with CTMY, MS and PY but at a lower level than milk, lactose and water. By contrast, protein secretion rate was highly correlated with persistency. Fat secretion was not highly linked to anything except persistency. Total solids showed genetic correlations that were intermediate to those of its components.
Genetic correlations between the lactation curve parameters and calculated values with the secretion rate traits (standard errors below the correlations)

SRt = secretion rate.
Discussion
Heritabilities
Genetic studies using the biological model of lactation have previously been described by Pollott and Gootwine (Reference Pollott and Gootwine2001) for sheep and Albarrán-Portillo and Pollott (Reference Albarrán-Portillo and Pollott2008) for dairy cattle. Both reports were based on commercial animals with monthly test-day records and so were of limited value for estimating early-lactation lactation curve parameters due to the low number of records before the peak of lactation. The dataset used in this study comprised weekly test-day records and so a biological model with more parameters could be fitted and there were enough pre-peak test-day records available to give good estimates of the curve in early lactation. Interestingly, all the three traits, relative rate of cell number growth, proportion of maximum cell number at the start of lactation and change in yield midway between the start and peak of lactation, exhibited virtually no additive genetic variation and had zero heritabilities. Other biological model parameters had similar values to those found by Olori et al. (Reference Olori, Hill, McGuirk and Brotherstone1999b) when using random regression methods on this dataset and Albarrán-Portillo and Pollott (Reference Albarrán-Portillo and Pollott2008) from UK commercial dairy herds. For example, PY had a heritability of 0.34 ± 0.108 compared to 0.30 ± 0.01 (Albarrán-Portillo and Pollott, Reference Albarrán-Portillo and Pollott2008) and ∼0.3 (Olori et al., Reference Olori, Hill, McGuirk and Brotherstone1999b) at about week 10 of lactation. Similar comments apply to CTMY as well. Thus the low level of genetic variation in early lactation traits was probably not due to the current dataset but truly reflected the fact that these traits were totally determined by non-genetic factors.
Albarrán-Portillo and Pollott (Reference Albarrán-Portillo and Pollott2008) discussed the relative pattern of heritability values for the different curve parameters and calculated values. A similar pattern was seen here with milk yield, PY and MS, all having similar values at around 0.3. Early lactation parameters had low values (<0.1) whilst late-lactation parameters had intermediate heritabilities between these two groups (0.1 to 0.2).
Random regression methods to analyse milk production and estimate breeding values are more widely implemented throughout many dairy industries. It may be instructive to compare the approach used here with the random regression approach used on the same dataset and described by Olori et al. (1999b). Figure 3 of the Olori et al. (1999b) shows the heritability of milk yield rising from 0.3 in early lactation to 0.5 in late lactation. Thus later lactation production levels are more highly heritable than those in early lactation, as found above in a slightly different form. Also, as noted earlier, where the two sets of results intersect (PY) heritability is the same. Apart from these two similarities the rest of the two sets of results are difficult to compare. The random regression approach is effectively estimating the heritability on each day of lactation whilst the biological model approach is attempting to look at the genetic basis for the traits underlying milk yield. Even though early lactation traits show little genetic variation, cell secretion rate of milk was heritable (0.24 ± 0.09). Other parallels between the two studies are hard to find and it may be more important to consider how these two approaches could be used in a breeding programme.
The other novel heritabilities reported in this study are the secretion rate/cell values quoted for all the milk components. Milk, lactose and water had the highest secretion rate heritabilities (0.24 to 0.28) whilst fat and protein were lower (0.17 and 0.19).
Correlations
The genetic correlations between the curve parameter traits followed the pattern found previously (Albarrán-Portillo and Pollott, Reference Albarrán-Portillo and Pollott2008) with PY and MS being effectively the same trait and being highly correlated with total milk yield. Total yield was also highly correlated with the relative rate of cell death. The lack of genetic variation in the early lactation traits meant that no genetic correlations were available involving these traits. However, the phenotypic correlations (Table 3) indicated that early lactation traits were not correlated with late lactation traits or PY but were moderately correlated with each other and DP. An earlier DP was associated with greater proportion of cells active at the start of lactation, a greater relative growth rate of cells and a faster daily change in milk yield midway between the start and peak of lactation.
The genetic correlations between the six total yield traits and between the six secretion rate traits showed a similar pattern. Most correlations were >0.87 with the exception of those involving fat, which ranged from 0.62 to 0.83 (total yield traits) and from 0.40 to 0.74 (secretion rate traits). This reflects the difference in the metabolic pathways used to produce the different milk constituents as discussed in this context by Pollott (Reference Pollott2004). The genetic correlations between the lactation curve parameters and the secretion rate traits present some novel insights into the way lactation is controlled by the animal’s genes. Of particular note is the relationship between persistency and fat (0.70) and protein (0.60) secretion rates which contrasts with those for milk, lactose and water (all <0.27). In this analysis, persistency is defined as the daily loss in milk yield midway between the peak and the end of lactation. This suggests that milk production maintained at a higher level in late lactation is associated with cells which secrete fat and protein more slowly, or conversely a fast drop in milk production is associated with cells which secrete fat and protein at a high rate.
Biological implications of results
Following the logic of the biological model of lactation used here, it is not surprising that the calculated total yield traits are highly correlated. Each of the five component traits is a part of the CTMY trait but also a major contributor to the each total yield trait is the number of secretory cells active at any given point in lactation, which are the same cells for all traits. In fact the only difference between these traits is the result of the secretion rates for each component. In this study, all total yield traits were related with each other by both phenotypic and genetic correlations >0.9, with the exception of correlations involving fat yield. In addition, milk, lactose and water yield traits are highly related due to the osmotic regulation effect of lactose. Lactose acts to draw water out of the secretory cells by osmosis and so water yield, and hence milk yield due to the dominance of water in the makeup of milk, is controlled by lactose secretion. The position of lactose is so critical that it could be said that lactose production drives milk yield and that any factor affecting lactose production has a direct effect on milk yield. Since milk comprises 87.9% water (Table 4) and milk and water levels are determined by lactose concentrations in the udder, selection for milk production can be considered as selection for lactose levels in the cow.
Fat and protein production in milk are partially independent from lactose production (Pollott, Reference Pollott2004) and hence their genetic parameters are often different from milk/lactose/water. Clearly, the genetic parameters for total solids are always somewhere between those of lactose and fat/protein values. In this study, fat and protein tended to have lower heritabilities than milk, lactose and water. However, both protein and fat production are independent of the ‘lactose’ effect but not the ‘cell number’ effect. Thus any factors that influence protein synthesis or fat production in the secretory cells will affect the total yield of these components. Also of interest are the high correlations between protein and lactose, and hence water, total solids and milk. This implies similar drivers between lactose and protein secretion rate. Selection schemes, which are based on fat and protein, will also increase milk production due to their relationship with cell numbers and the secretion rate correlations. This is often offset by weighting traits differentially in a selection index.
The early lactation traits have been shown to have very little genetic basis. This may indicate that it is not the number of secretory cells, which limits production in early lactation but other factors such as the availability of energy, the health of the animal or other management effects. It has not been possible to estimate these effects with this dataset, but if data were available from a fully recorded herd it may be possible to investigate energy balance effects in early lactation on lactation curve shape.
The secretion rate of lactose/milk/water is not linked to persistency but that of fat and protein appeared to have a different relationship. The major determinant of milk yield in late lactation is cell loss rather than fall in secretion rate. This may reflect the influence of energy balance, feed intake and body condition changes on the cow’s physiology at this stage of lactation.
Acknowledgements
Brian McGuirk supplied the data used in this study from the dataset analysed by Victor Olori for his PhD study at Edinburgh University. Both are gratefully acknowledged for their contribution to this research.